CANADA: A TEMPORARY VERSUS MORE ENDURING REBOUND
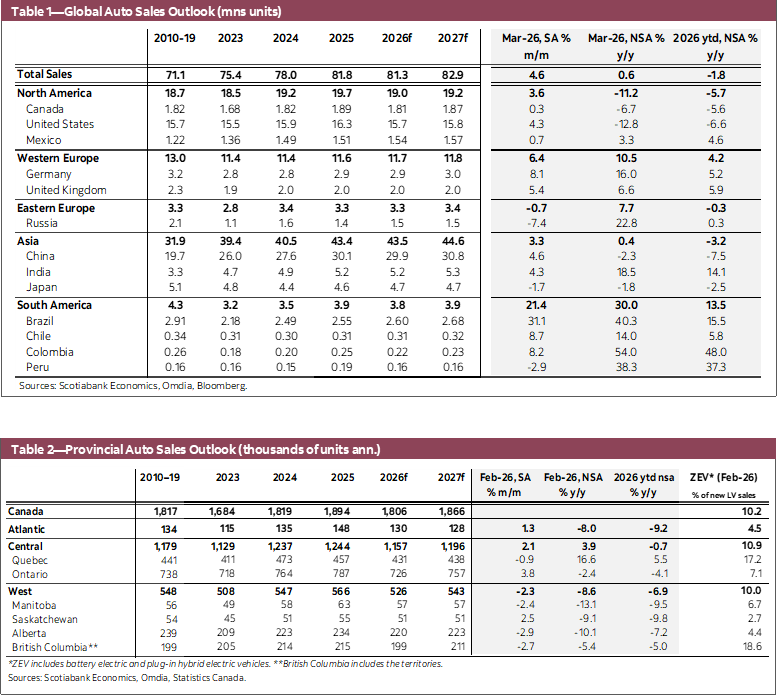
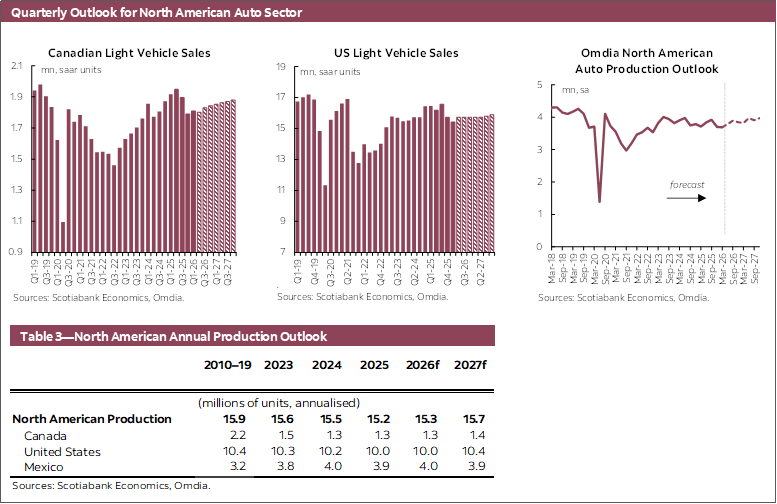
Canadian auto sales increased 3% month-over-month to 1.9 mn units at a seasonally adjusted annualized rate (SAAR) in April based on data from Omdia (chart 1). Last month’s sales rate was the highest seasonally adjusted month since July 2025, while a 1% upward revision to Q1 sales provided a stronger hand-off going into Q2. In non-seasonally adjusted terms as reported by the same source, auto sales were 181.6 k in April, down 4.1% y/y but up 7.9% relative to the same month in 2024.

Canadian auto sales have improved in recent months, with the three-month moving average (3mma) rising to 1.86 mn (SAAR) in April, up from 1.76 mn (SAAR, 3mma) in January. This rise is primarily supported from higher car sales, which increased 22% m/m (SA) in April amid a surge in demand for small cars. It remains to be seen whether this is a temporary rebound from the softer sales at the end of last year versus a more enduring rebound. One possible explanation for the rise in car sales is increased demand owing to the recently implemented Electric Vehicle Affordability Program (EVAP). Statistics Canada is expected to publish new vehicle sales by fuel type for March on May 14th which could show early signs of an uptick in ZEV sales from the EV rebate program. Canada’s labour market continues to face headwinds, as employment gains have stalled this year, with the unemployment rate increasing to 6.9% in April. Meanwhile, the ongoing conflict in the Middle East is keeping oil prices elevated. The Bank of Canada held the policy rate unchanged at the April 29th meeting, but flagged that they could raise the overnight rate in response to persistently elevated oil prices to avoid the risk of inflation moving higher and becoming broad based. The BoC’s Monetary Policy Report also flagged that they could cut the policy rate should significant trade restrictions be imposed on the Canadian economy. We expect the Bank of Canada to begin rate hikes in the H2-2026, raising the policy rate from 2.25% to 3% by the end of year and holding unchanged thereafter, with large uncertainty amid volatile oil prices.
Our outlook for Canadian light vehicle sales is 1.81 mn in 2026. Auto sales remain quite volatile on a monthly basis, smoothing through this volatility we expect demand to gradually improve throughout this year and next, rising to 1.87 mn in 2027, albeit with larger uncertainty given elevated and volatile oil prices clouding the outlook.
UNITED STATES: SALES ARE TRENDING SIDEWAYS AMID MIXED BACKDROP
US auto sales fell 1.6% m/m to 15.9 mn (SAAR) units in April, according to the BEA (chart 2). Q1 vehicle sales were revised down 1.4%, as such, the 6-month moving average (6mma) automotive selling rate has trended around 15.6 mn (SAAR) units since February. In non-seasonally adjusted terms, the BEA reported 1.36 mn units in April, down 6.9% y/y but up 3.3% relative to April 2024.

Light vehicle sales have largely trended sideways since October, albeit with elevated variability from month-to-month, against a mixed underlying backdrop. The US labour market has added more than 100 k jobs in three of the past four months, while the unemployment rate held steady around 4.3%. An improvement in the recent jobs data is allowing the Federal Reserve some time to assess oil price developments and the potential impact on inflation, as they held the policy rate at 3.75% in April. Our outlook expects the Fed to begin cutting the policy rate towards the end of this year into early 2027, but a persistent rise in inflation would pose headwinds to this outlook.
Our outlook for US auto sales is 15.7 mn units in 2026 with the sales rate trending sideways this year, and marginally improving to 15.8 mn in 2027 as expected interest rate relief and improving labour market dynamics support consumer demand but remains highly uncertain in the face of headwinds from elevated and volatile oil prices.
GLOBAL AUTO SALES: BROAD IMPROVEMENTS AT THE END OF A SOFT Q1
Global auto sales increased 4.6% m/m (SA) in March, as monthly sales increased in nearly all regions tracked (chart 3). Nevertheless, global vehicle sales had a soft start to the year, -3.5% q/q in Q1, weighed down by the lower selling rate in January and February.
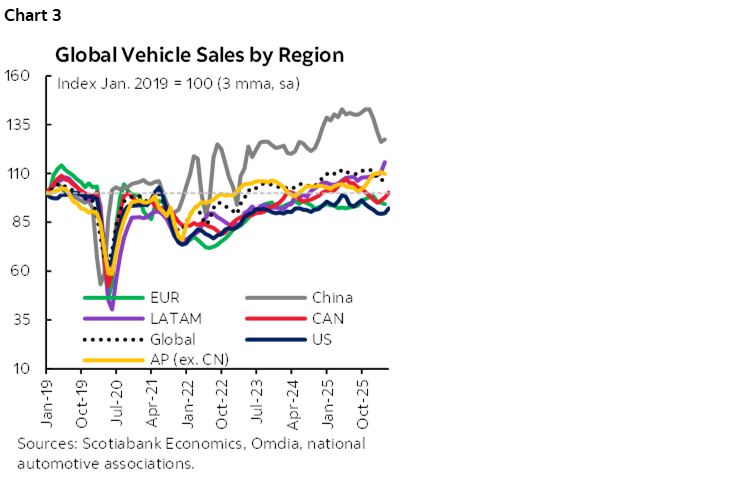
In western Europe, vehicle sales increased 6.4% m/m (SA) to the highest seasonally adjusted month since August 2023 and the gains were broad based, as sales increased in 14 of the 15 countries tracked. However, auto sales in the region remain volatile on a monthly basis, and were marginally lower (-0.3% q/q) in Q1. Meanwhile, auto sales in eastern Europe fell 0.7% m/m (SA), having slowed in four of the past five months, and were down 17% q/q in Q1.
In the Asia Pacific region, auto sales increased 3.3% m/m (SA), up for a second consecutive month as seasonally adjusted sales rebound from their recent low at the start of the year, notably in China (4.6% m/m), which accounts for roughly two thirds of sales in the region. However, Q1 auto sales fell 5.3% q/q in the Asia Pacific region, weighed down by the softer sales in China (-7.8% q/q).
In Latin America, vehicle sales increased 15.7% m/m (SA) owing to a surge in Brazil (31.1% m/m SA), while increasing 1.6% m/m in the other countries tracked for the region, and Q1 auto sales increased 6.5% q/q.
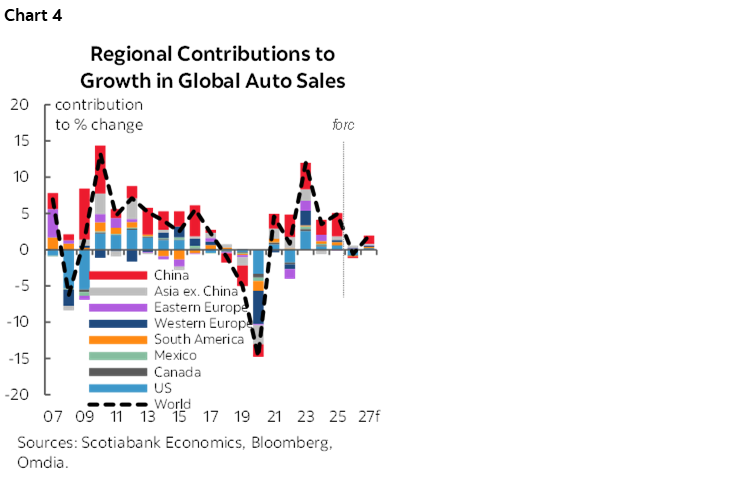
Our outlook for global vehicle sales is a decline of 0.6% in 2026 before increasing 1.9% in 2027 but could face downside risk from the recent higher and more volatile oil prices (chart 4).
DISCLAIMER
This report has been prepared by Scotiabank Economics as a resource for the clients of Scotiabank. Opinions, estimates and projections contained herein are our own as of the date hereof and are subject to change without notice. The information and opinions contained herein have been compiled or arrived at from sources believed reliable but no representation or warranty, express or implied, is made as to their accuracy or completeness. Neither Scotiabank nor any of its officers, directors, partners, employees or affiliates accepts any liability whatsoever for any direct or consequential loss arising from any use of this report or its contents.
These reports are provided to you for informational purposes only. This report is not, and is not constructed as, an offer to sell or solicitation of any offer to buy any financial instrument, nor shall this report be construed as an opinion as to whether you should enter into any swap or trading strategy involving a swap or any other transaction. The information contained in this report is not intended to be, and does not constitute, a recommendation of a swap or trading strategy involving a swap within the meaning of U.S. Commodity Futures Trading Commission Regulation 23.434 and Appendix A thereto. This material is not intended to be individually tailored to your needs or characteristics and should not be viewed as a “call to action” or suggestion that you enter into a swap or trading strategy involving a swap or any other transaction. Scotiabank may engage in transactions in a manner inconsistent with the views discussed this report and may have positions, or be in the process of acquiring or disposing of positions, referred to in this report.
Scotiabank, its affiliates and any of their respective officers, directors and employees may from time to time take positions in currencies, act as managers, co-managers or underwriters of a public offering or act as principals or agents, deal in, own or act as market makers or advisors, brokers or commercial and/or investment bankers in relation to securities or related derivatives. As a result of these actions, Scotiabank may receive remuneration. All Scotiabank products and services are subject to the terms of applicable agreements and local regulations. Officers, directors and employees of Scotiabank and its affiliates may serve as directors of corporations.
Any securities discussed in this report may not be suitable for all investors. Scotiabank recommends that investors independently evaluate any issuer and security discussed in this report, and consult with any advisors they deem necessary prior to making any investment.
This report and all information, opinions and conclusions contained in it are protected by copyright. This information may not be reproduced without the prior express written consent of Scotiabank.
™ Trademark of The Bank of Nova Scotia. Used under license, where applicable.
Scotiabank, together with “Global Banking and Markets”, is a marketing name for the global corporate and investment banking and capital markets businesses of The Bank of Nova Scotia and certain of its affiliates in the countries where they operate, including; Scotiabank Europe plc; Scotiabank (Ireland) Designated Activity Company; Scotiabank Inverlat S.A., Institución de Banca Múltiple, Grupo Financiero Scotiabank Inverlat, Scotia Inverlat Casa de Bolsa, S.A. de C.V., Grupo Financiero Scotiabank Inverlat, Scotia Inverlat Derivados S.A. de C.V. – all members of the Scotiabank group and authorized users of the Scotiabank mark. The Bank of Nova Scotia is incorporated in Canada with limited liability and is authorised and regulated by the Office of the Superintendent of Financial Institutions Canada. The Bank of Nova Scotia is authorized by the UK Prudential Regulation Authority and is subject to regulation by the UK Financial Conduct Authority and limited regulation by the UK Prudential Regulation Authority. Details about the extent of The Bank of Nova Scotia's regulation by the UK Prudential Regulation Authority are available from us on request. Scotiabank Europe plc is authorized by the UK Prudential Regulation Authority and regulated by the UK Financial Conduct Authority and the UK Prudential Regulation Authority.
Scotiabank Inverlat, S.A., Scotia Inverlat Casa de Bolsa, S.A. de C.V, Grupo Financiero Scotiabank Inverlat, and Scotia Inverlat Derivados, S.A. de C.V., are each authorized and regulated by the Mexican financial authorities.
Not all products and services are offered in all jurisdictions. Services described are available in jurisdictions where permitted by law.