Authors
Rebekah Young
Vice-President, Economic Policy
rebekah.young@scotiabank.com
Ben de Wit, CFA, CAIA, P.Eng
Senior Associate,
Scotia Growth Institute
benjamin.dewit@scotiabank.com
Syed Hasnain Abbas
Economic Analyst
syedhasnain.abbas@scotiabank.com
Zeeshan Nayani, CFA, B.Eng.
Associate,
Scotia Growth Institute
zeeshan.nayani@scotiabank.com
Patrick Bryden, CFA
Global Head of Research,
Scotia Growth Institute
patrick.bryden@scotiabank.com
· Canada is pursuing a transformational investment agenda, and the North is increasingly at the centre. Emerging project, defence, and infrastructure priorities are starting to look like a broader northern capital call.
· The North is no longer just a regional development file. It is becoming a national test of economic capacity, sovereignty, and security. Arctic warming, contested access, defence gaps, and critical mineral demand are converging in a region rich in resources but thin in infrastructure.
· The capital call is large, even if the final tally is uncertain… There is already a trillion dollars in potential demand across major project inventories, defence plans, and infrastructure priorities nationwide. Those lists are growing by the week. Not all is new, some will overlap and some will fall away. Even so, the scale is ambitious for a roughly $3 trillion economy.
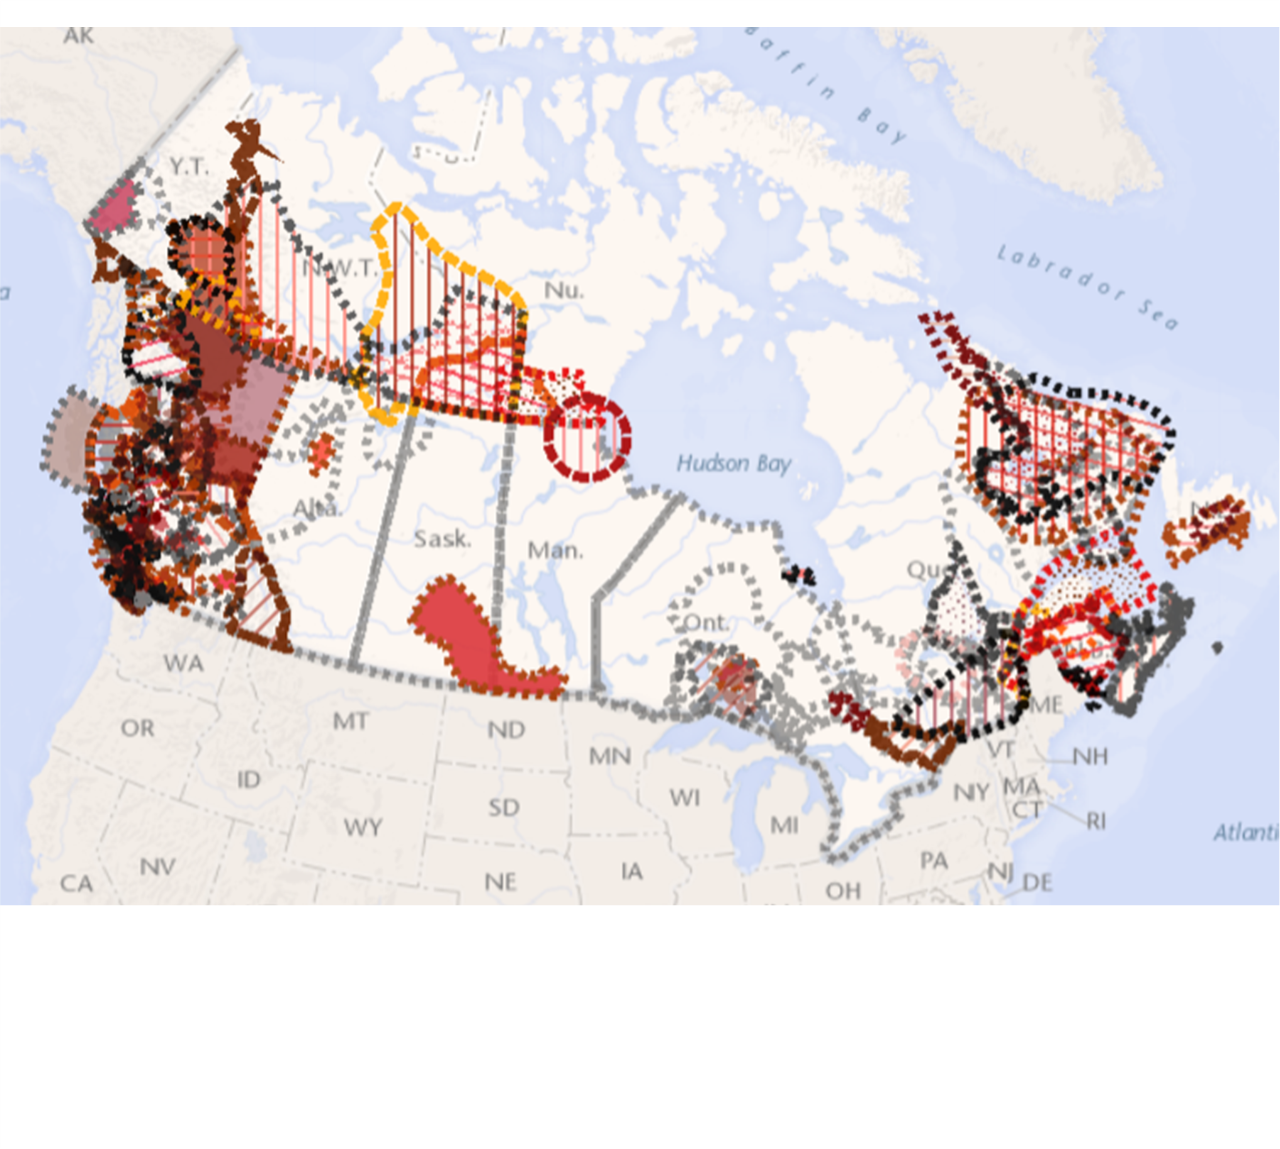
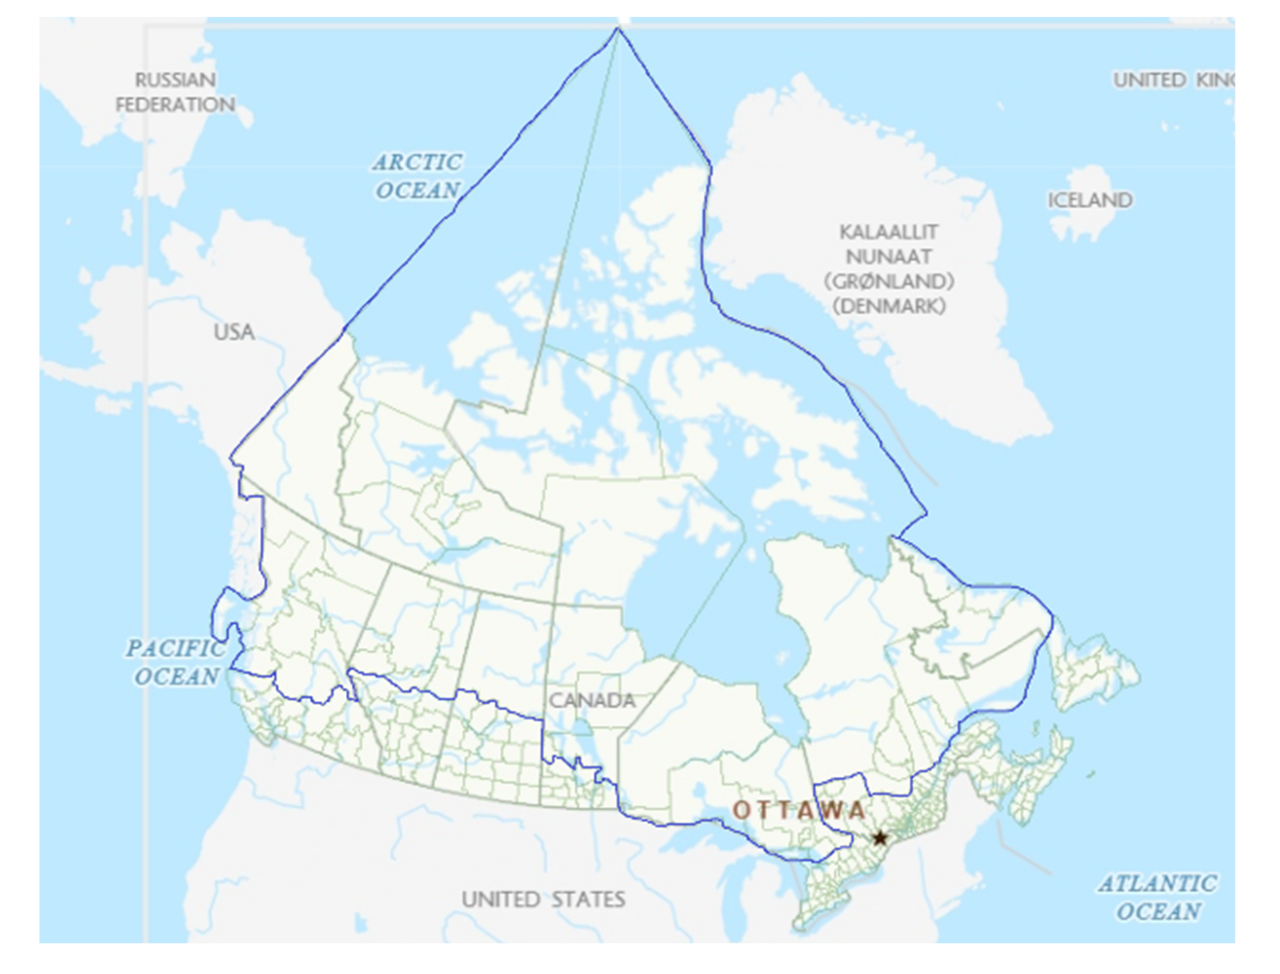
· … and a disproportionate share points north. Using Statistics Canada’s Census-based northern boundaries, we estimate that almost half of the potential investment pipeline sits in a region with just 6% of the country’s population but about 88% of its landmass (Exhibits 1 and 2).
· This is a generational opportunity. Canada has a rare chance to turn a major investment cycle into lasting northern presence, stronger productive capacity, and more local wealth.
· The payoff is not just a construction burst. Done well, investment can add capital, lower costs, and improve connectivity in ways that make future projects easier to advance and improve life in the region.
· The policy test is turning projects into presence. Defence investments can anchor shared infrastructure, but durable gains depend on systems that build local capacity, expand housing and services, and support Indigenous ownership.
· That will take discipline as much as ambition. The risk is spending at scale on disconnected assets that drive up costs rather than building the shared foundations needed for lasting presence and local wealth.
· Canada has little choice but to respond at scale in the North. Sovereignty risk changes the cost-benefit test. It puts a premium on presence that is difficult to price but impossible to ignore.
Exhibit 1 – Major Investment Plans
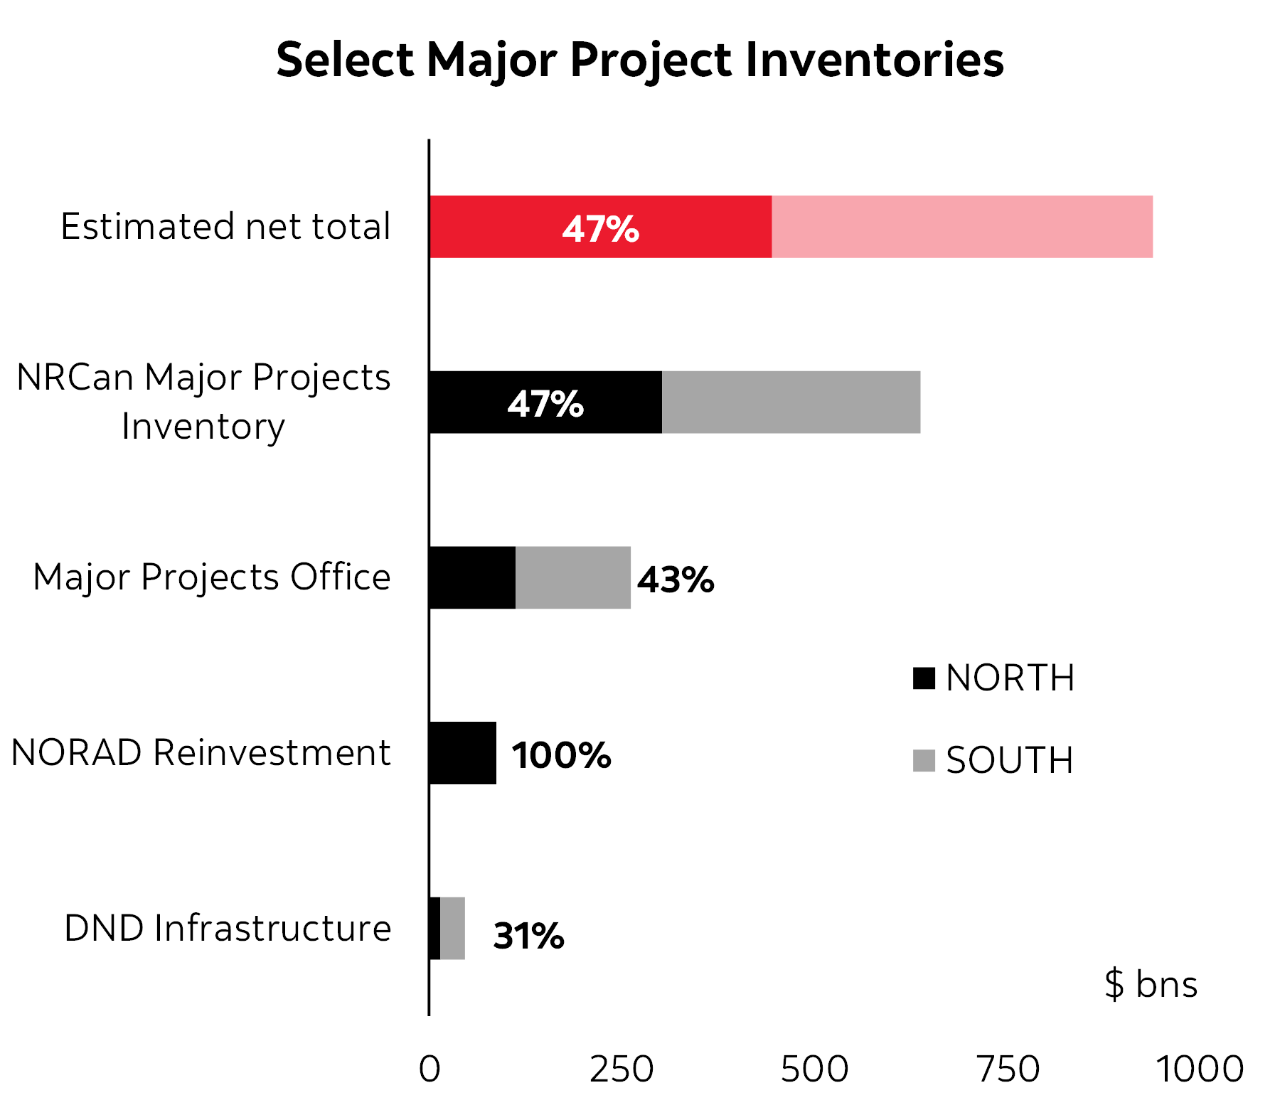
Exhibit 2 – Census Boundaries for Canada’s North
(Almost) All Signs Point North
Canada’s North is first and foremost home to many Indigenous Peoples with inherent rights, distinct cultures, unique histories, and lived experiences. That enduring reality now intersects with a more contested world that is increasing the value of the region’s geography, resources, and infrastructure. As the country looks for new sources of resilience and growth, a once-fragmented set of northern priorities is starting to look more like a broader opportunity to build the North with the North.1
Exhibit 3 – Northern Shipping Routes
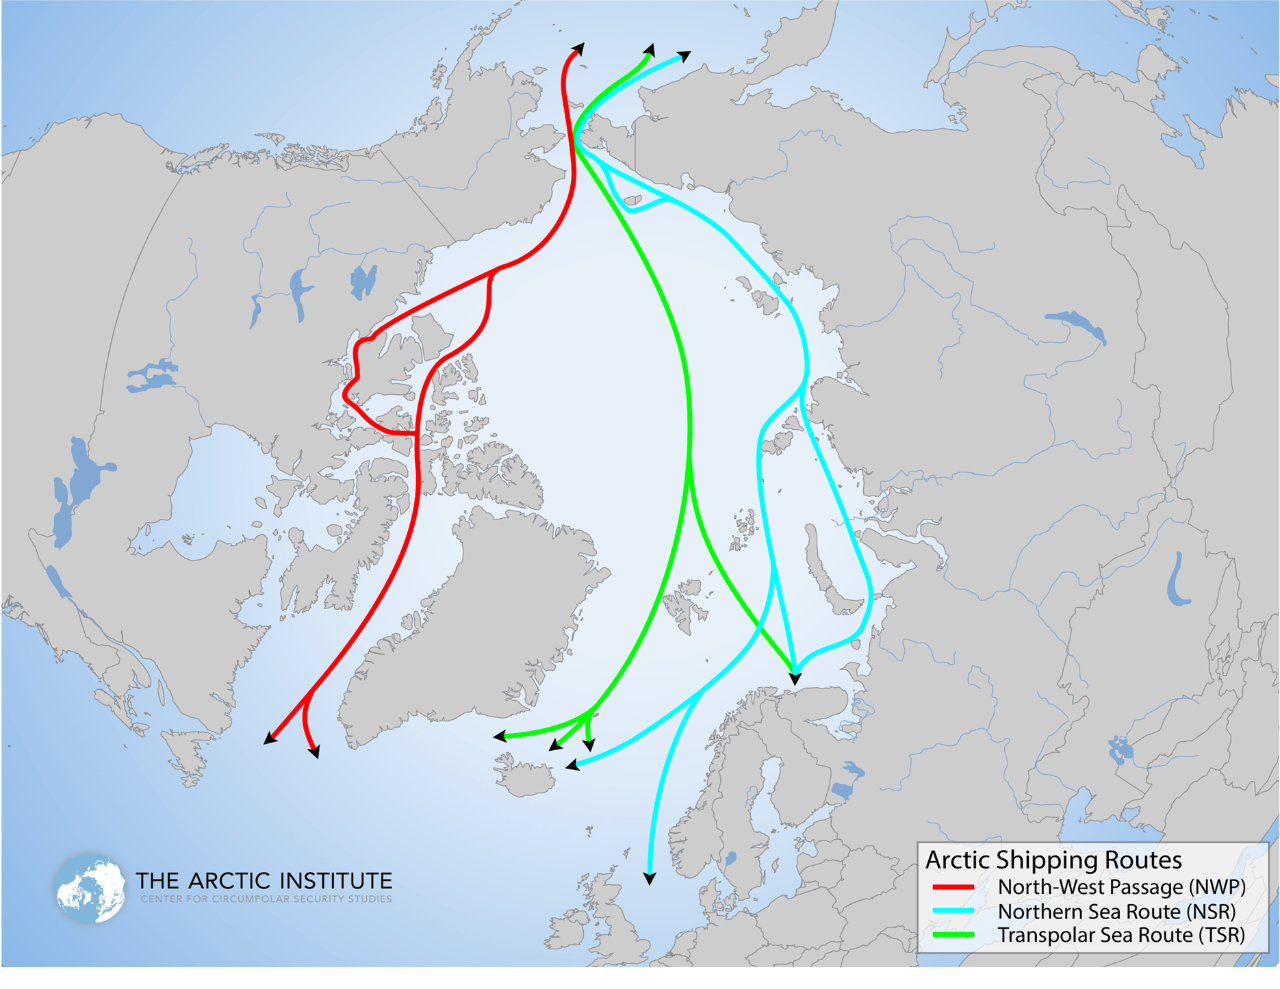
Exhibit 4 – Arctic Sea Ice Extent
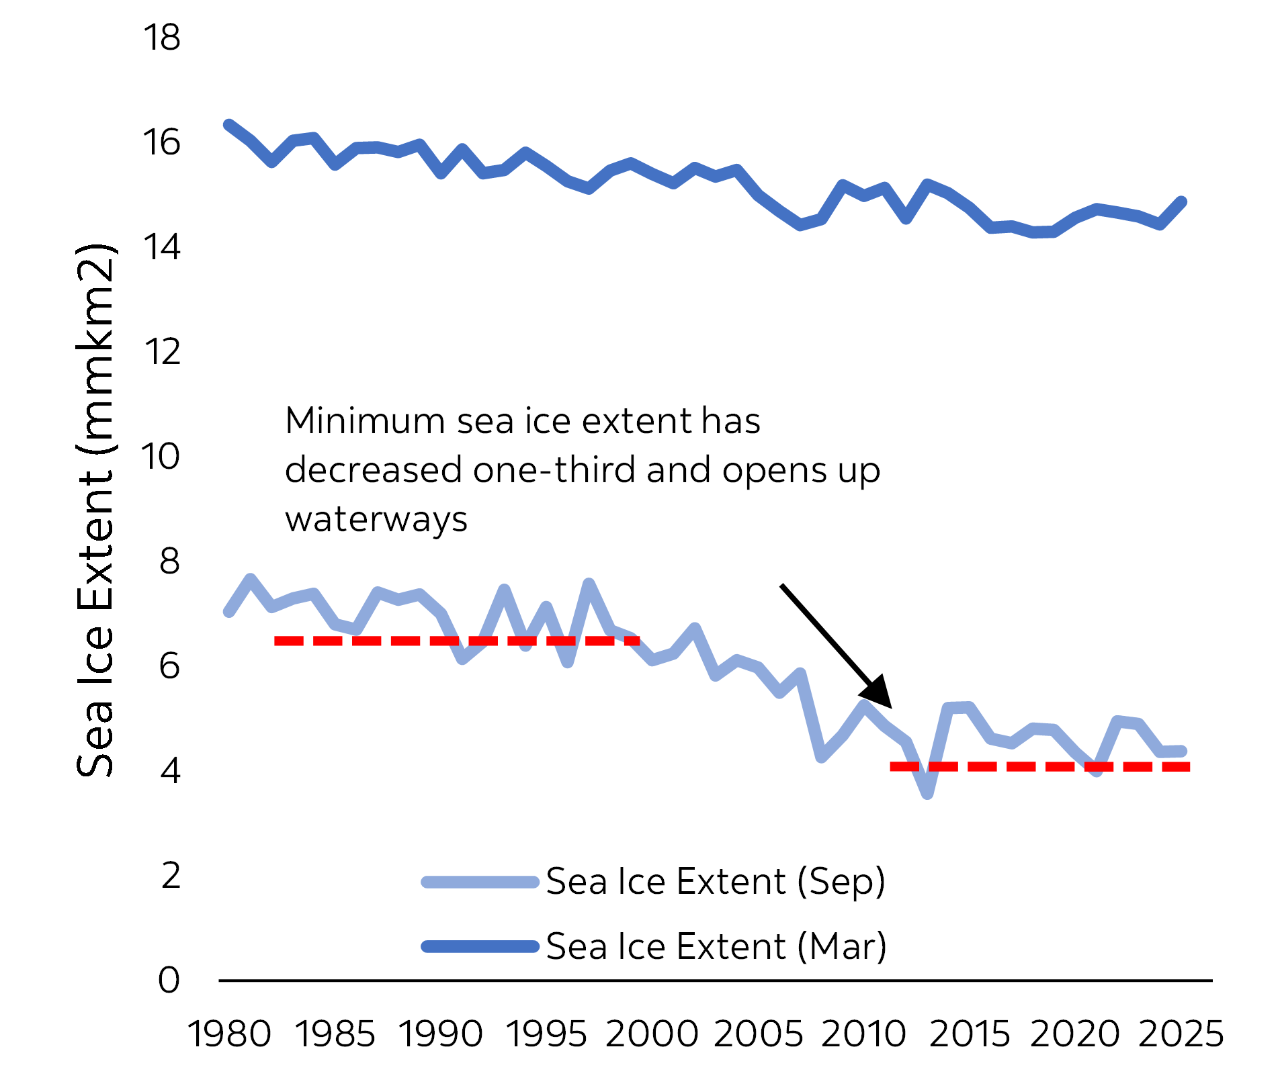
The opening of northern passageways is raising the commercial and strategic value of Canada’s northern footprint (Exhibits 3-5). China’s move toward regular Arctic container service shows how shorter routes are becoming commercially relevant. Its new service could cut the Asia-Europe route in half, while Russia’s control over permits and service charges underscores how access is already being monetized. Canada’s Northwest Passage remains difficult for most commercial vessels outside limited seasonal windows, but a region warming nearly four times faster than the global average is lengthening access and raising the premium on year-round Canadian presence in northern waters.
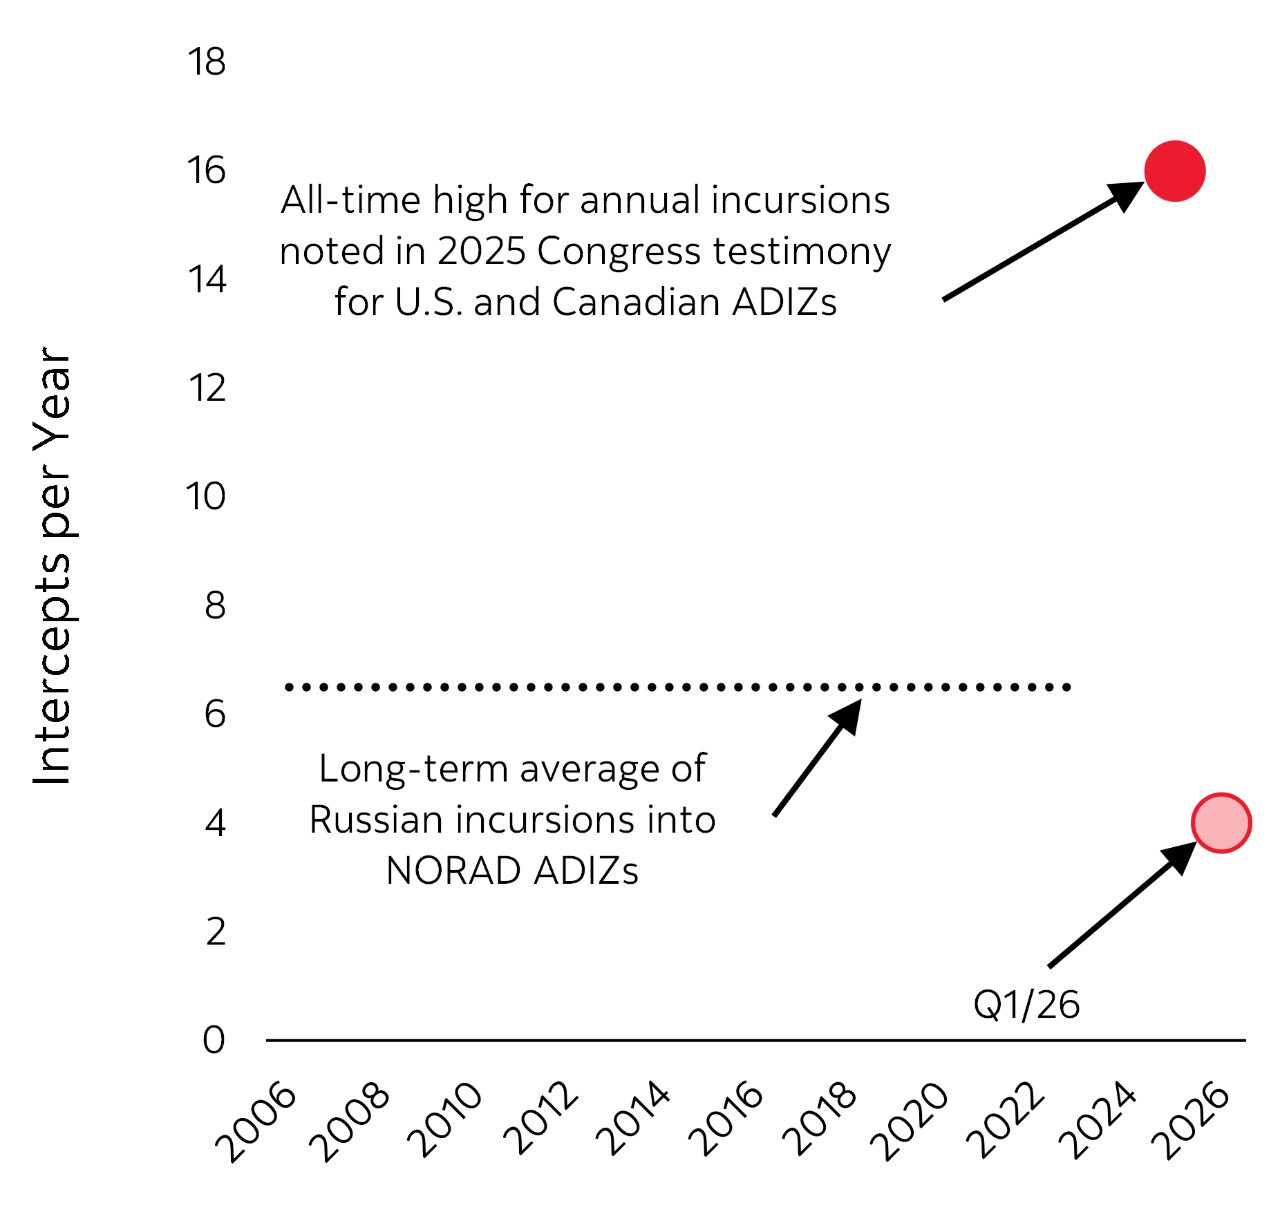
Wider access is making an already contested region harder to secure. Northern airspace is more active, with detected incursions prompting allied interceptions near Arctic and North American air-defence zones, while European officials warn that Russia could challenge NATO territory before the end of the decade (Exhibit 6). China’s “Polar Silk Road” ambitions add another layer of geoeconomic complexity, blending commercial, scientific, and strategic interests in the region.
Exhibit 5 – Arctic Shipping Activity
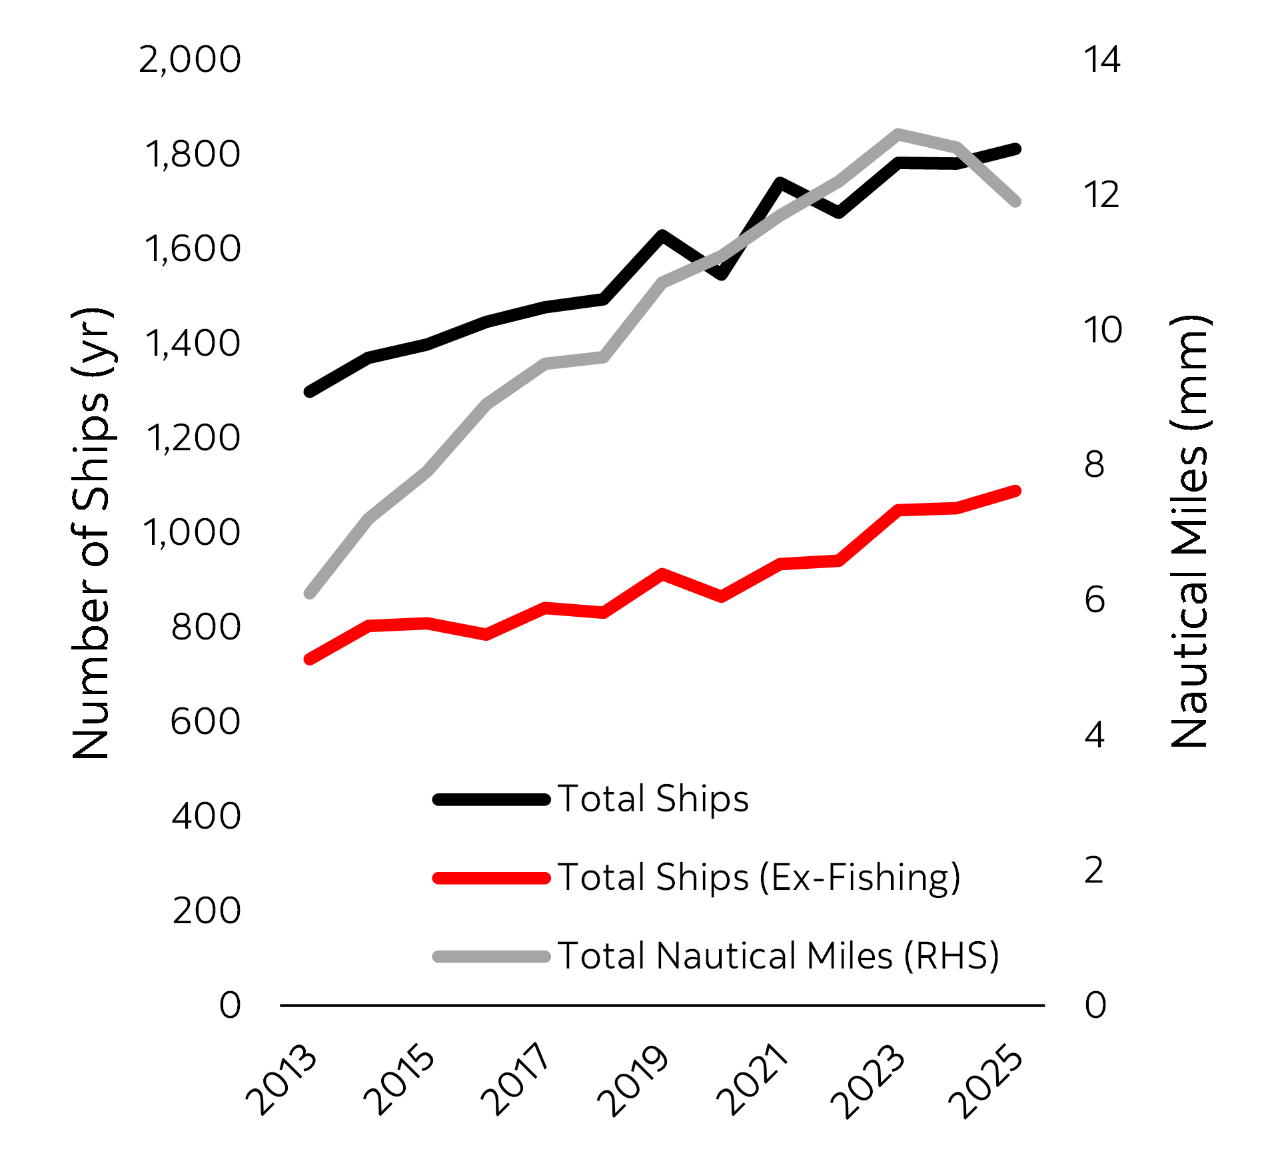
Exhibit 6 – NORAD Air Defence Incursions
Rivals are not the only concern. Recent U.S. interest in Greenland signals that northern territories are being viewed more openly through the lens of strategic control. These developments caution against dismissing recurring talk of Canada as a “51st state.” Canadians may have cause to be increasingly concerned that Washington still does not recognize the country’s claim that the Northwest Passage is internal waters.
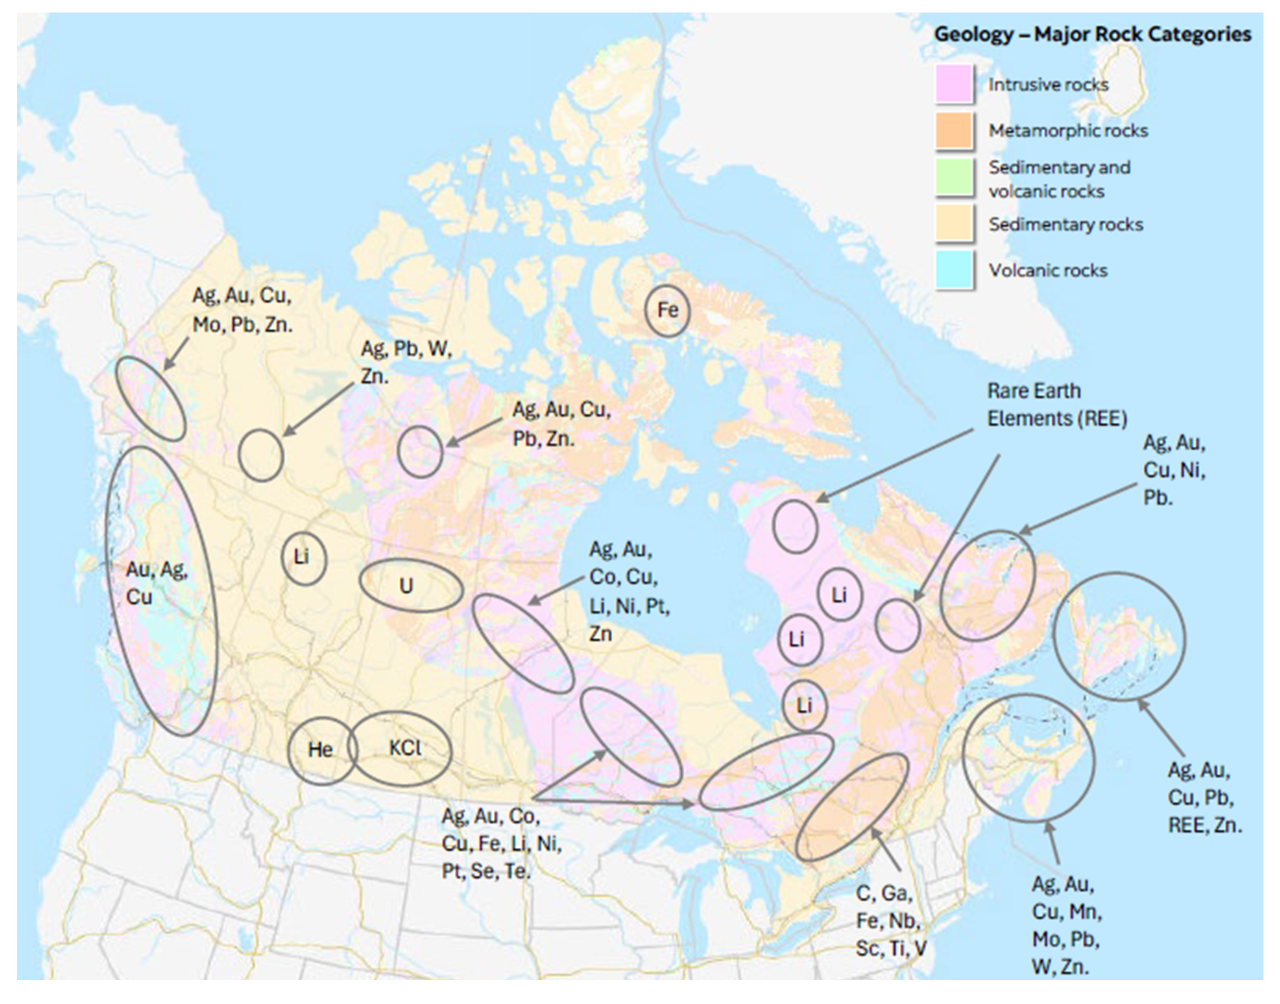
Critical minerals are adding further weight to the North’s strategic value. These resources are key inputs to the new industrial and security economy, from chips and data centres to grids, factories and defence systems. Yet global production and processing remain concentrated in jurisdictions willing to use supply chains as leverage. Canada’s North holds major endowments, making it more valuable—and more exposed (Exhibits 7 and 8).
Exhibit 7 – Existing Critical Mineral Mining Activity
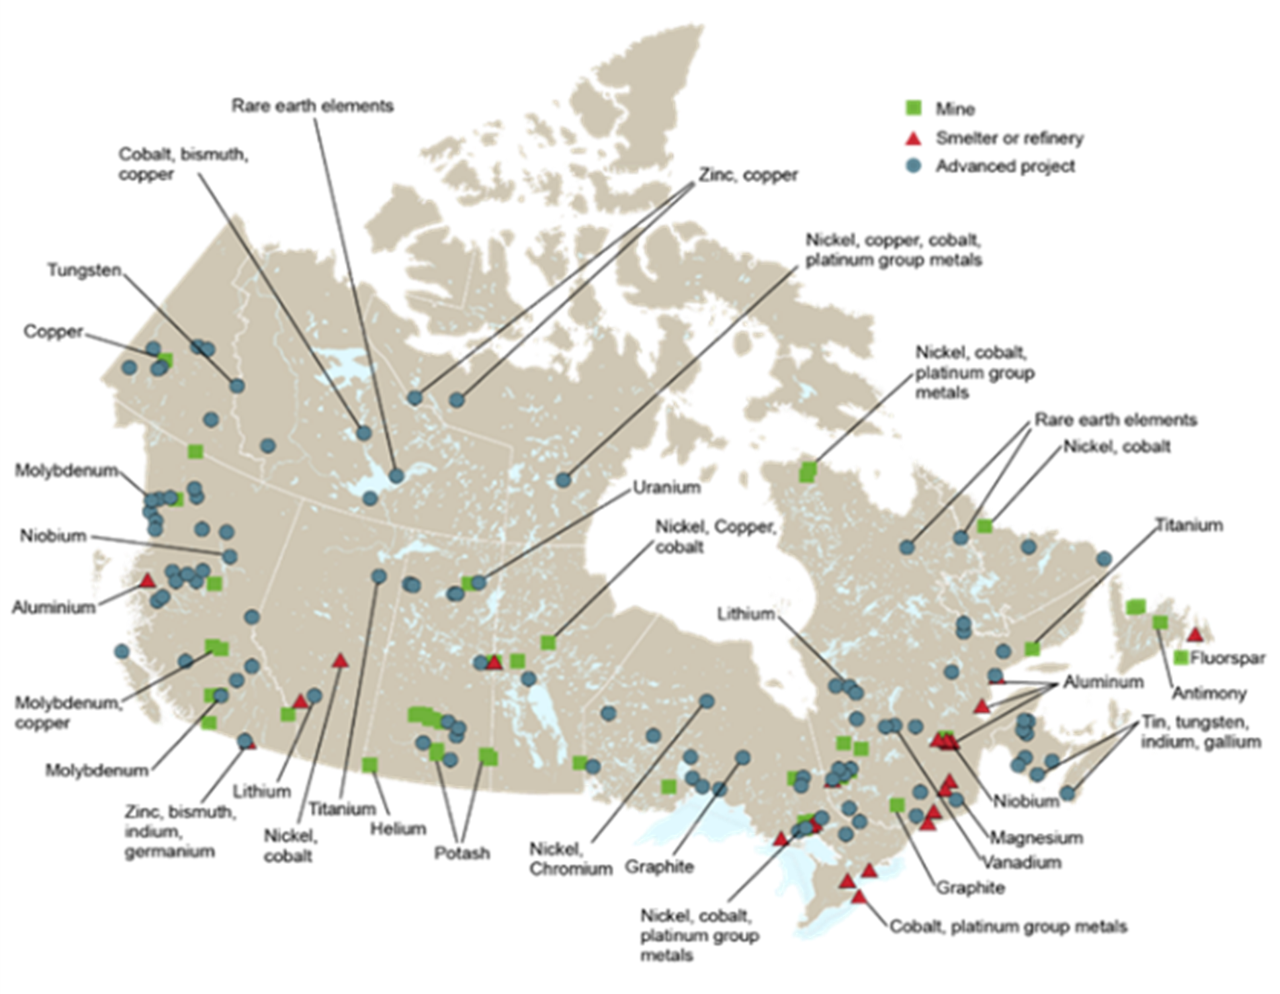
Exhibit 8 – Key Mineral Deposits
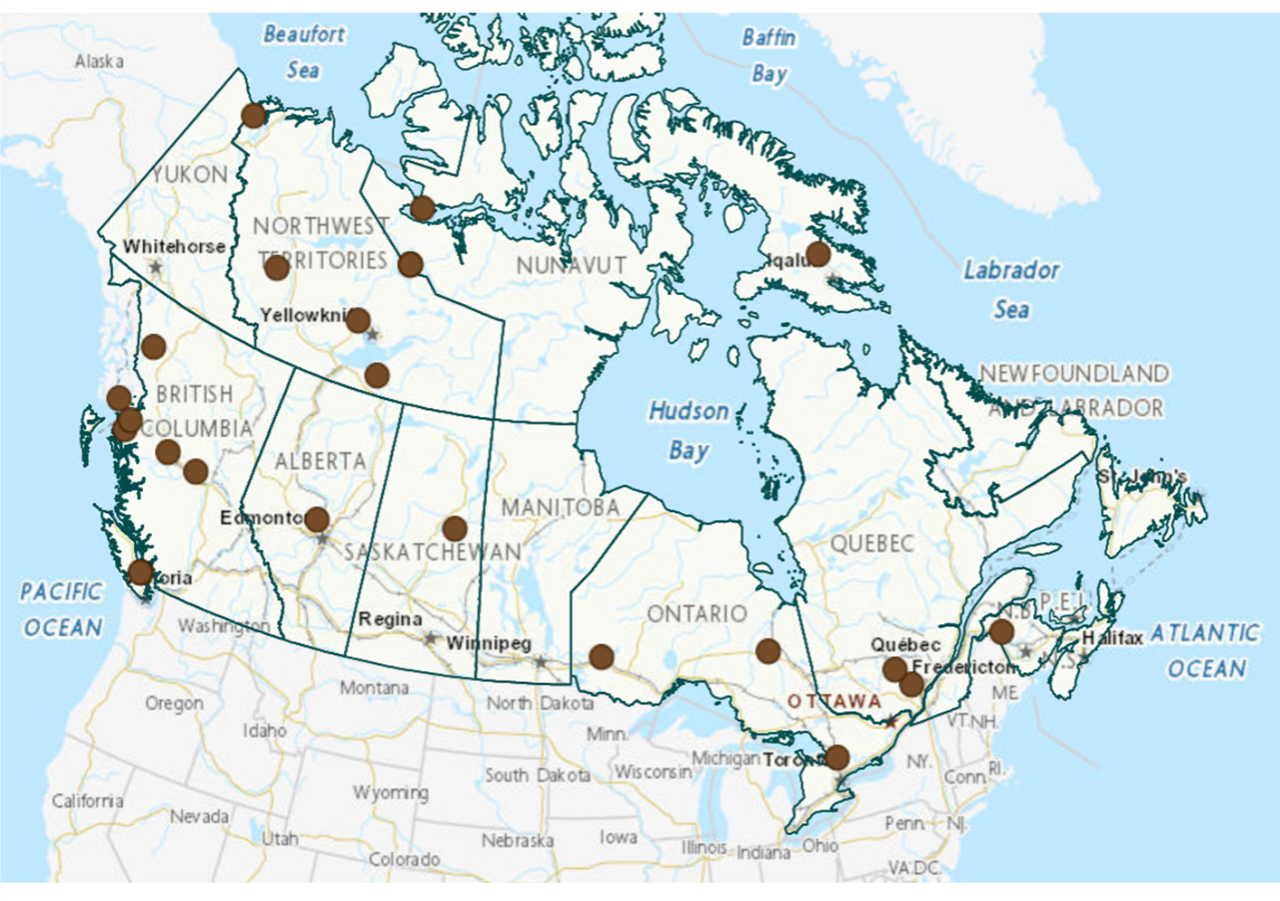
These pressures are converging with a broader federal investment push. Ottawa is leaning into its balance sheets, policy tools, and political capital to crowd in investment at scale and restart growth after decades of underinvestment and weak productivity. A rough read across the Major Projects Office pipeline, Natural Resources Canada’s Natural Resource Major Projects Inventory, and defence infrastructure plans, including NORAD reinvestment tallies, points to easily a trillion dollars in potential investment demand nationwide (Exhibits 9-12). Netting out apparent overlap across inventories still leaves an estimated $940 billion in potential national investment demand. The estimate is directional, not all is incremental, and, of course, not all will advance.
Exhibit 9 – Natural Resource Major Project Inventory (2025-2034)
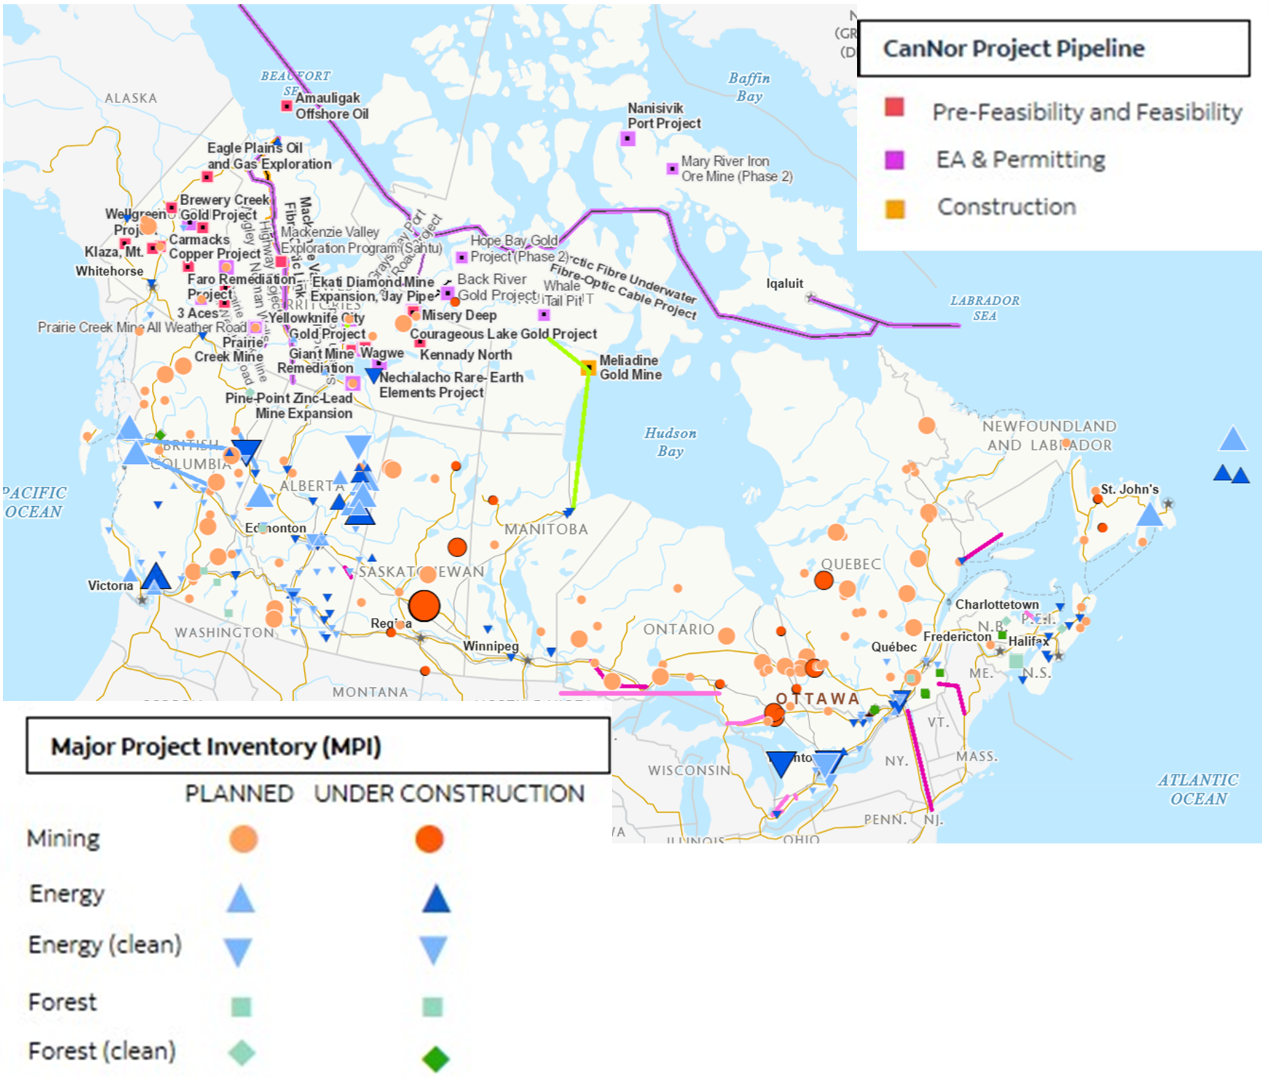
Exhibit 10 – Natural Resource Activity in the Territories
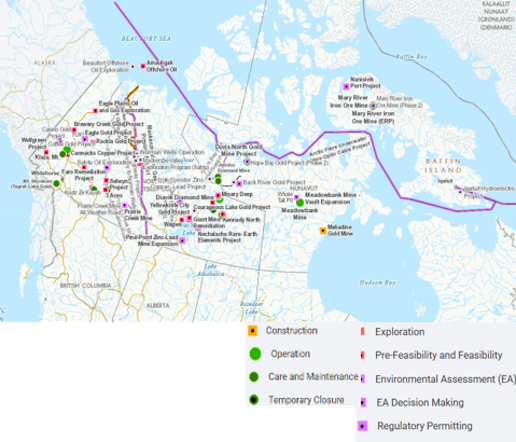
Exhibit 11 – Major Project Office Inventory
The sheer scale—albeit imprecise—is nevertheless big and disproportionately tilts north. Using Statistics Canada’s Census-based northern boundaries, our rough estimate is that easily almost half of the potential pipeline sits in the North. That concentration turns a national investment agenda into a generational opportunity for the North. Key is whether Canada can convert ambition at this scale into mutually reinforcing systems that raise productivity, strengthen security, and sustain presence. Meeting that test starts with the North’s thin capital base and the scale of the territory it must serve.
A Large Territory, but a Thin Footprint
Canada’s northern footprint is large by any definition. The three territories, often used in government statistics, cover roughly 40% of Canada’s landmass and more than 70% of its coastline, but are home to only about 140,000 people in a country of over 41 million. Statistics Canada’s broader Census-based definition of the North better captures the investment environment because it extends beyond the territories into areas that roughly track permafrost patterns. By that measure, the North covers about 88% of Canada’s landmass but only about 6% of its population.
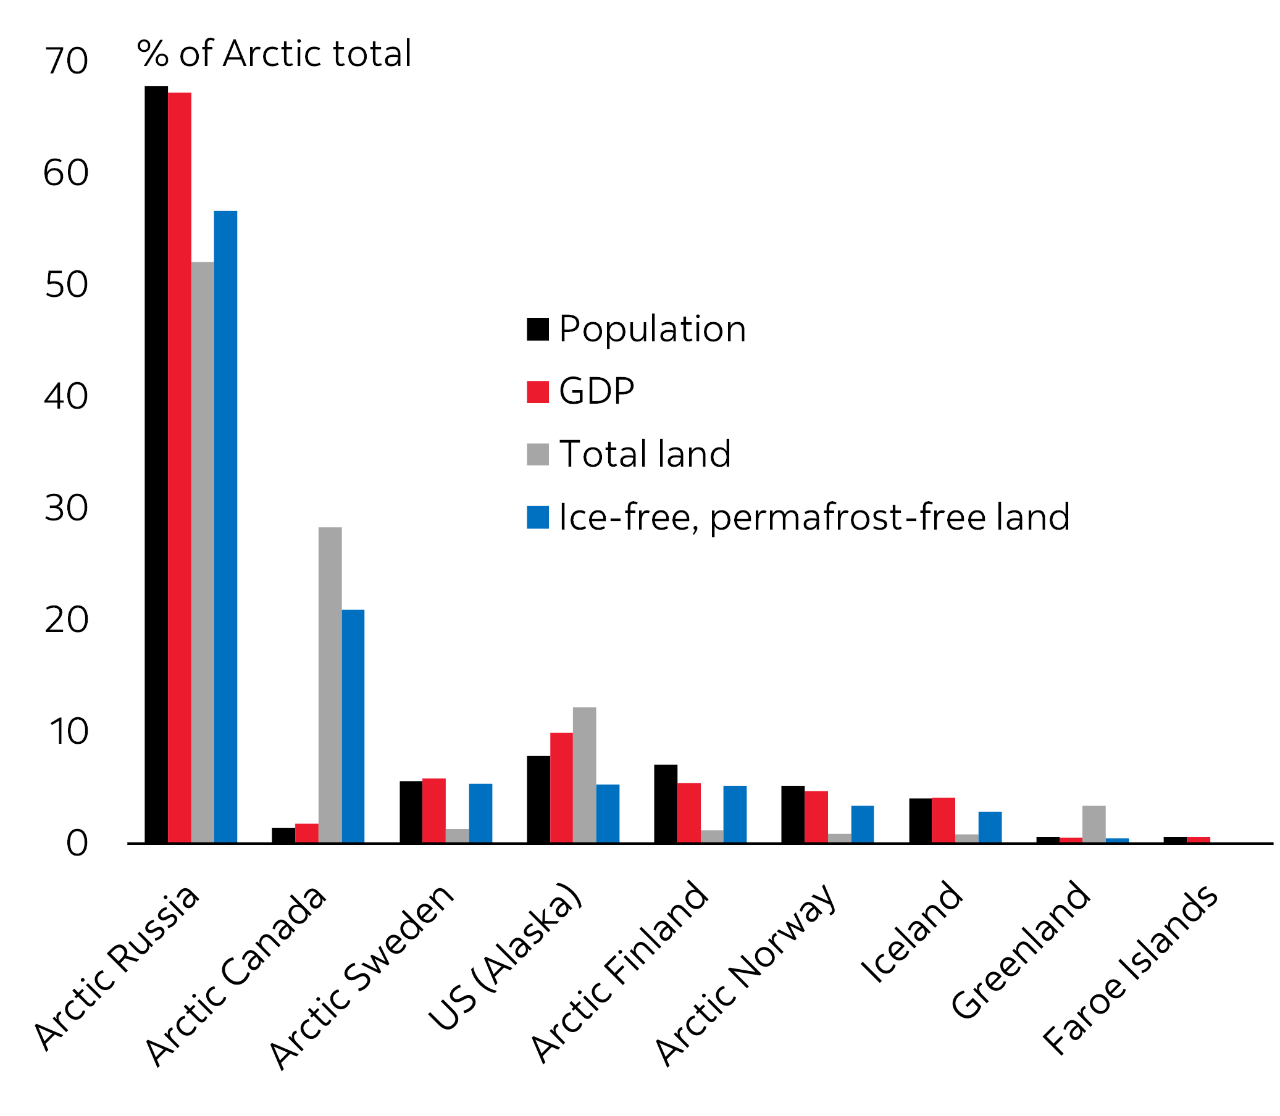
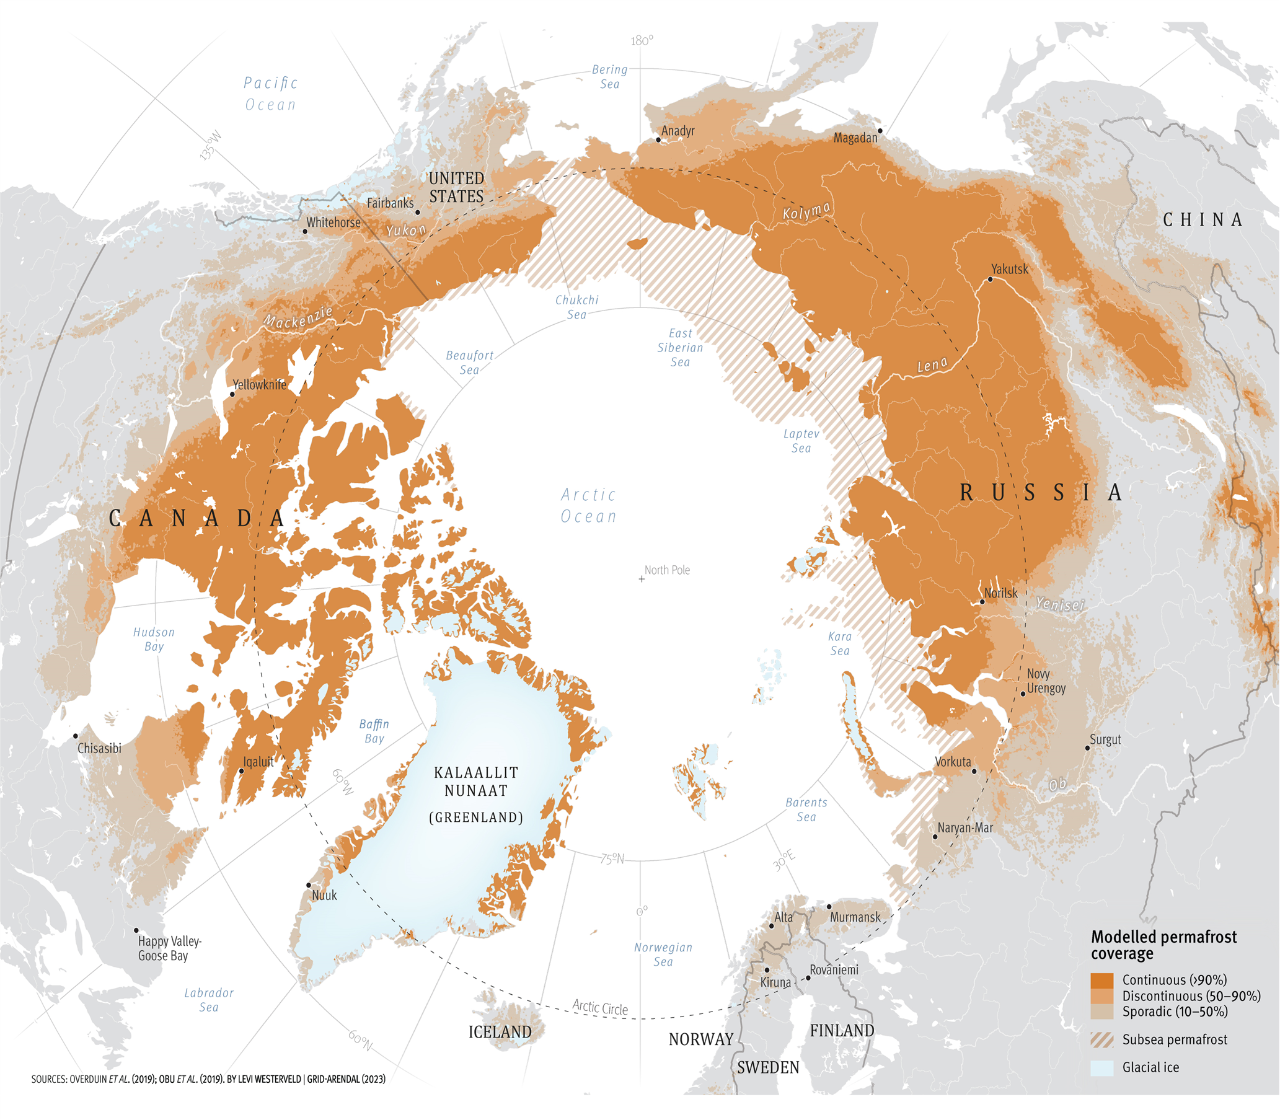
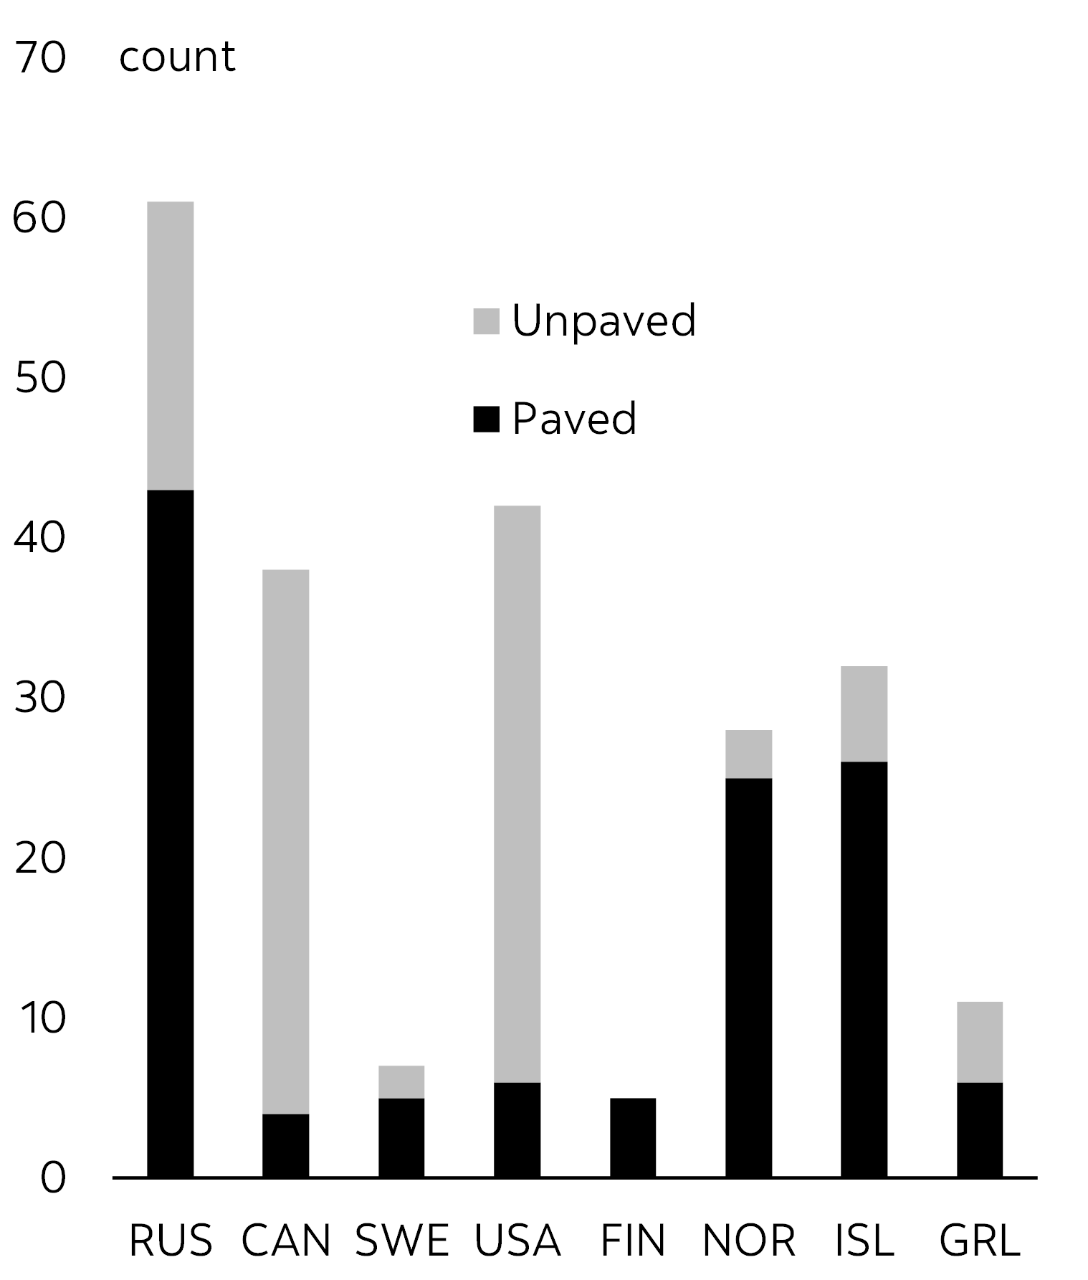
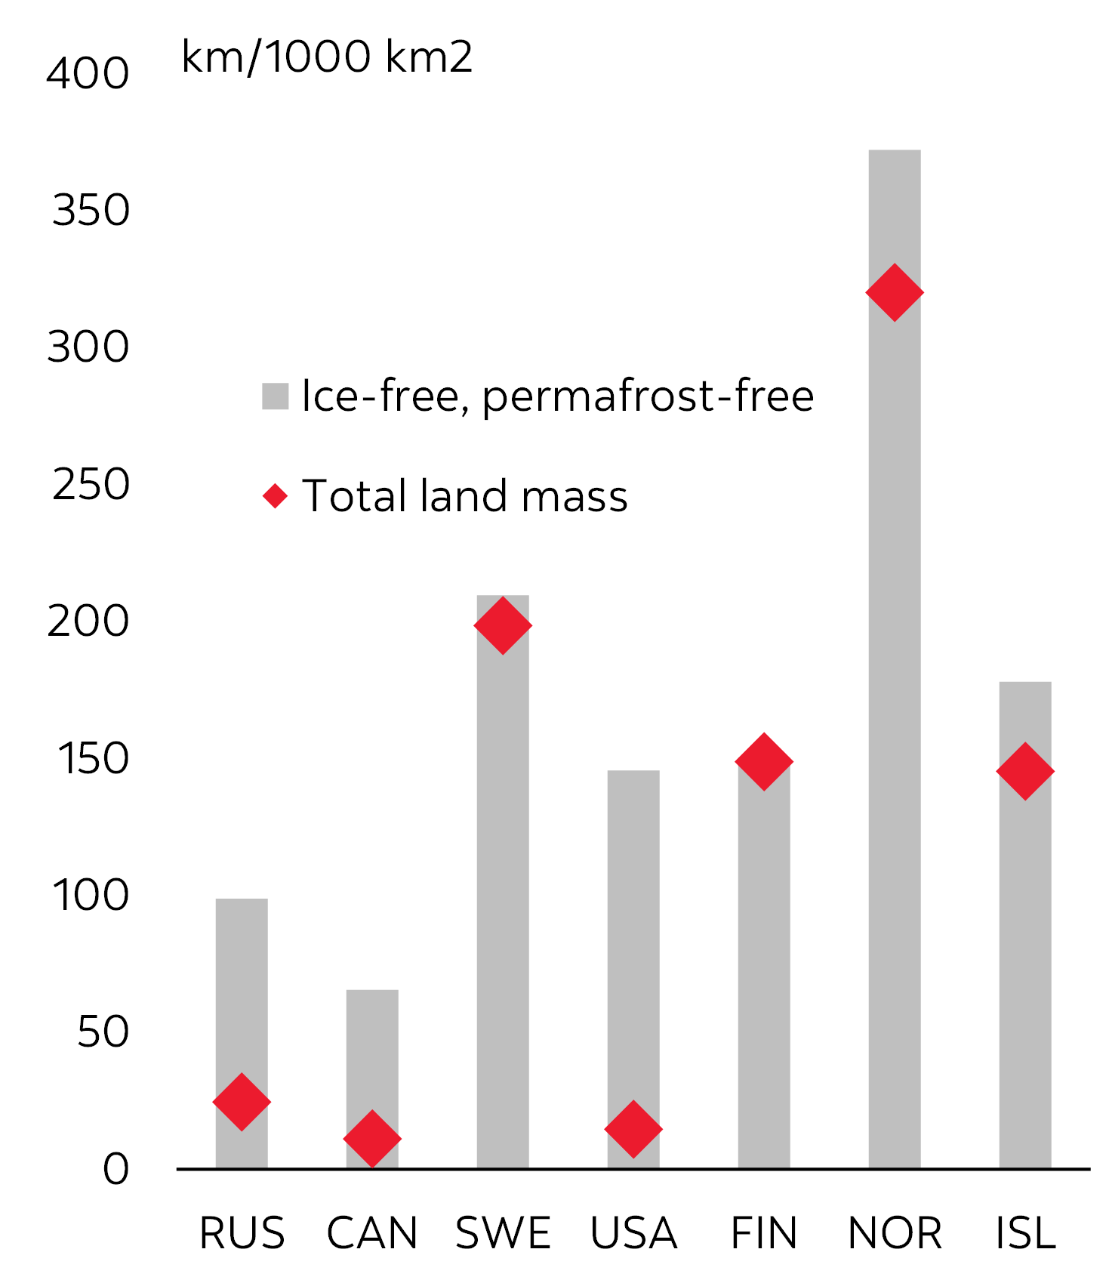
Canada’s northern scale also stands out globally. It accounts for roughly 28% of Arctic landmass, second only to Russia, and is more than twice the size of the United States, per the Arctic Council’s measure. Comparisons with European peers should be treated cautiously because their northern regions generally have warmer climates, denser settlement, and fewer permafrost constraints. But even on rough estimates of ice-free and permafrost-free territory, Canada’s relative footprint remains substantial (Exhibits 13 and 14).
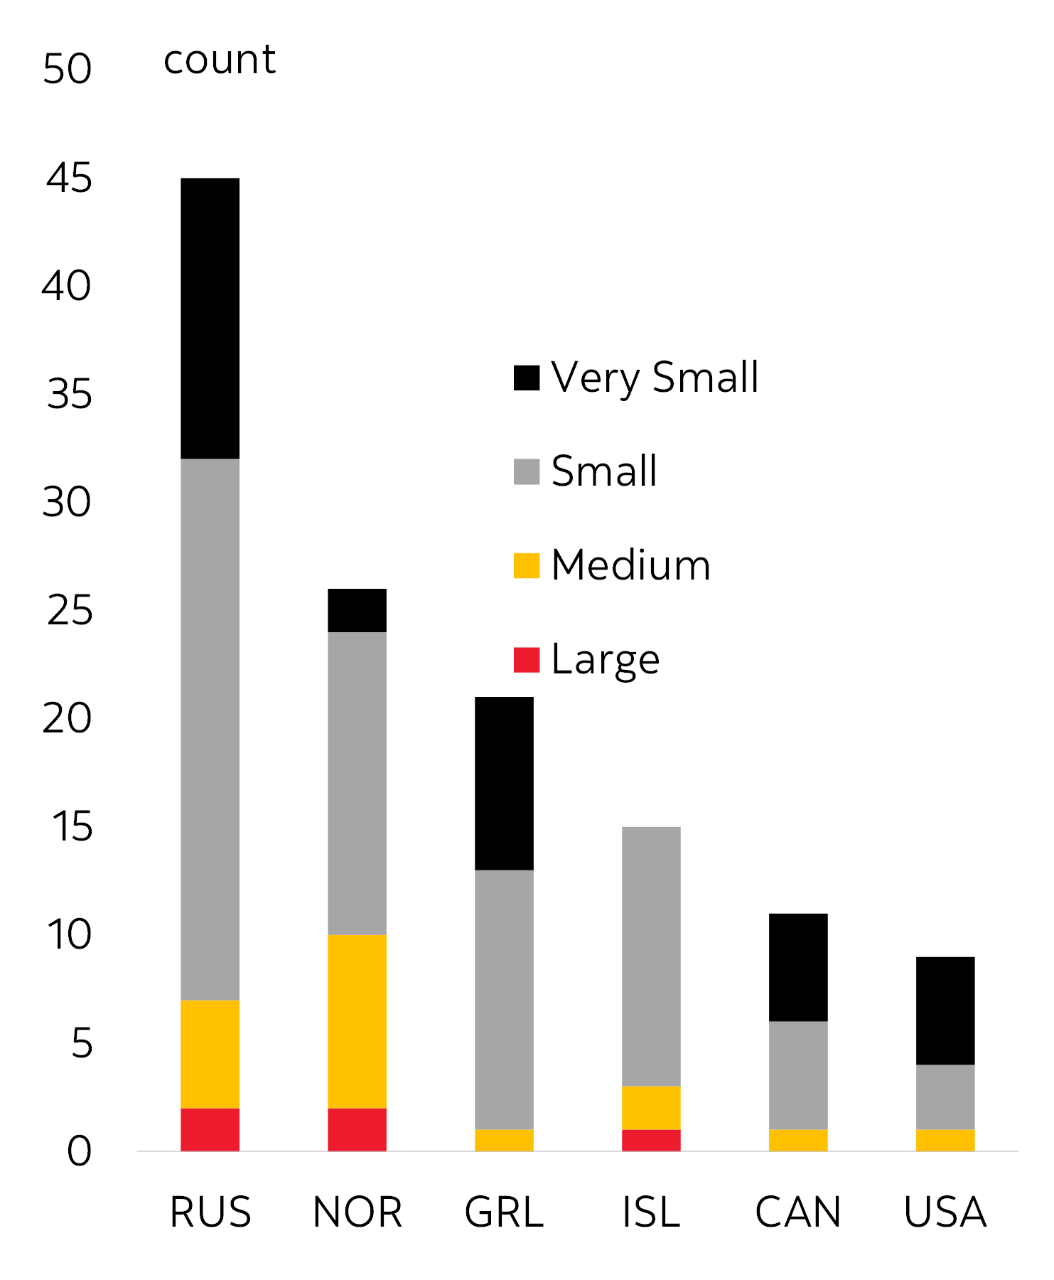
That physical footprint is not matched by an equivalent economic presence. Canada accounts for roughly 1.8% of Arctic GDP across peer economies on a purchasing power parity-adjusted basis, according to the Arctic Council’s estimates. Domestically, the three territories account for only about 0.5% of Canada’s GDP. By any measure, Canada’s northern build footprint remains thin, with limited connective infrastructure spread across an enormous territory (Exhibits 15-17). Distance itself is often a defining constraint.
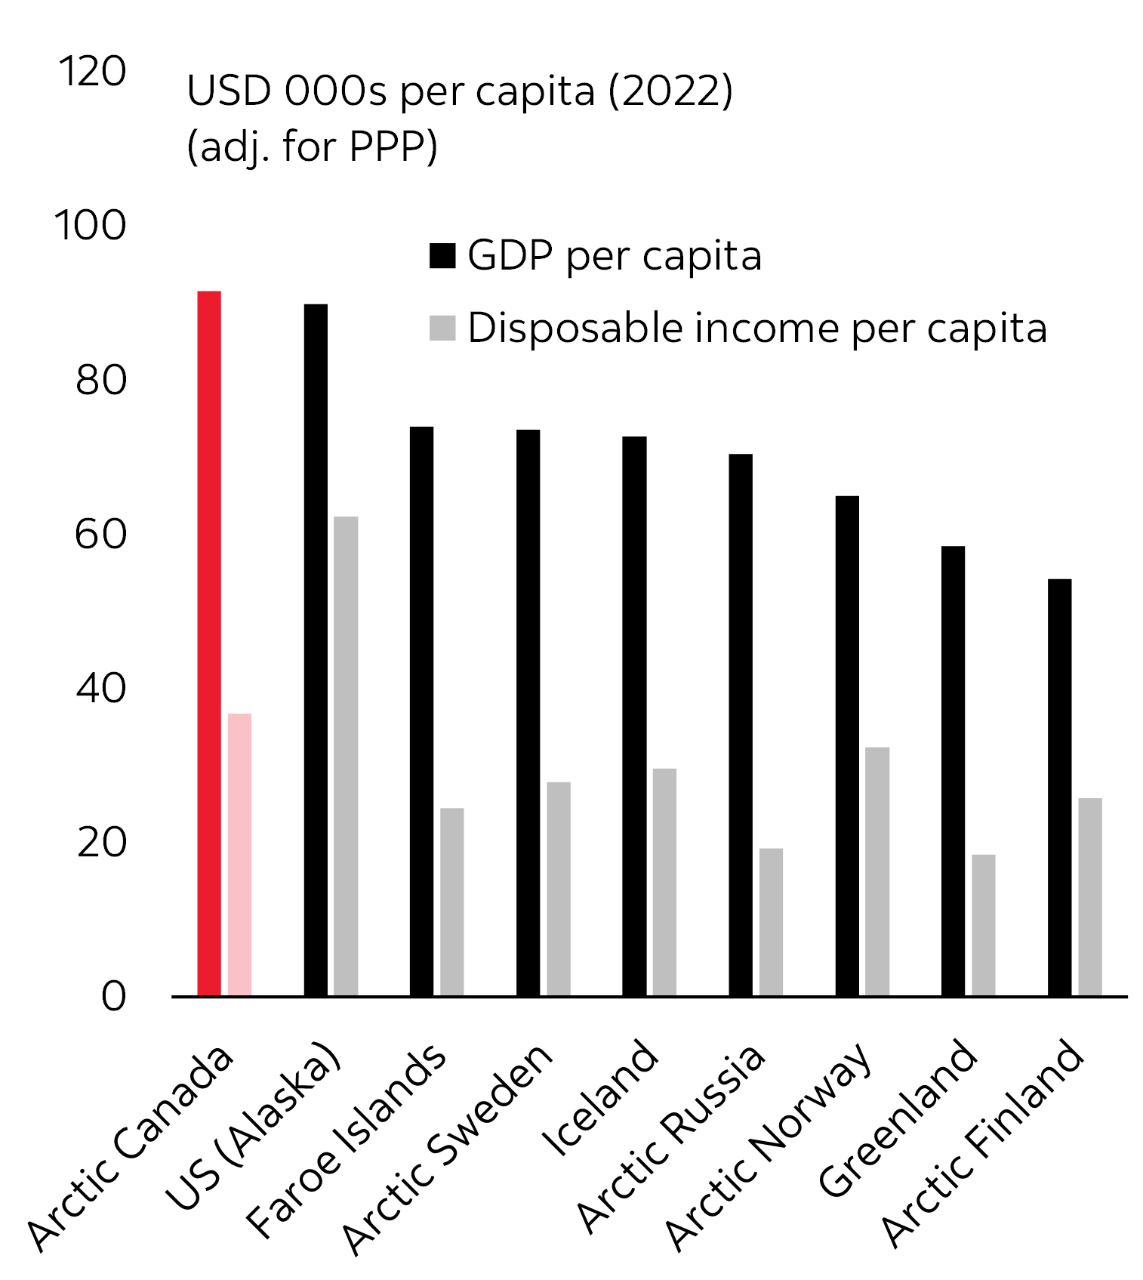
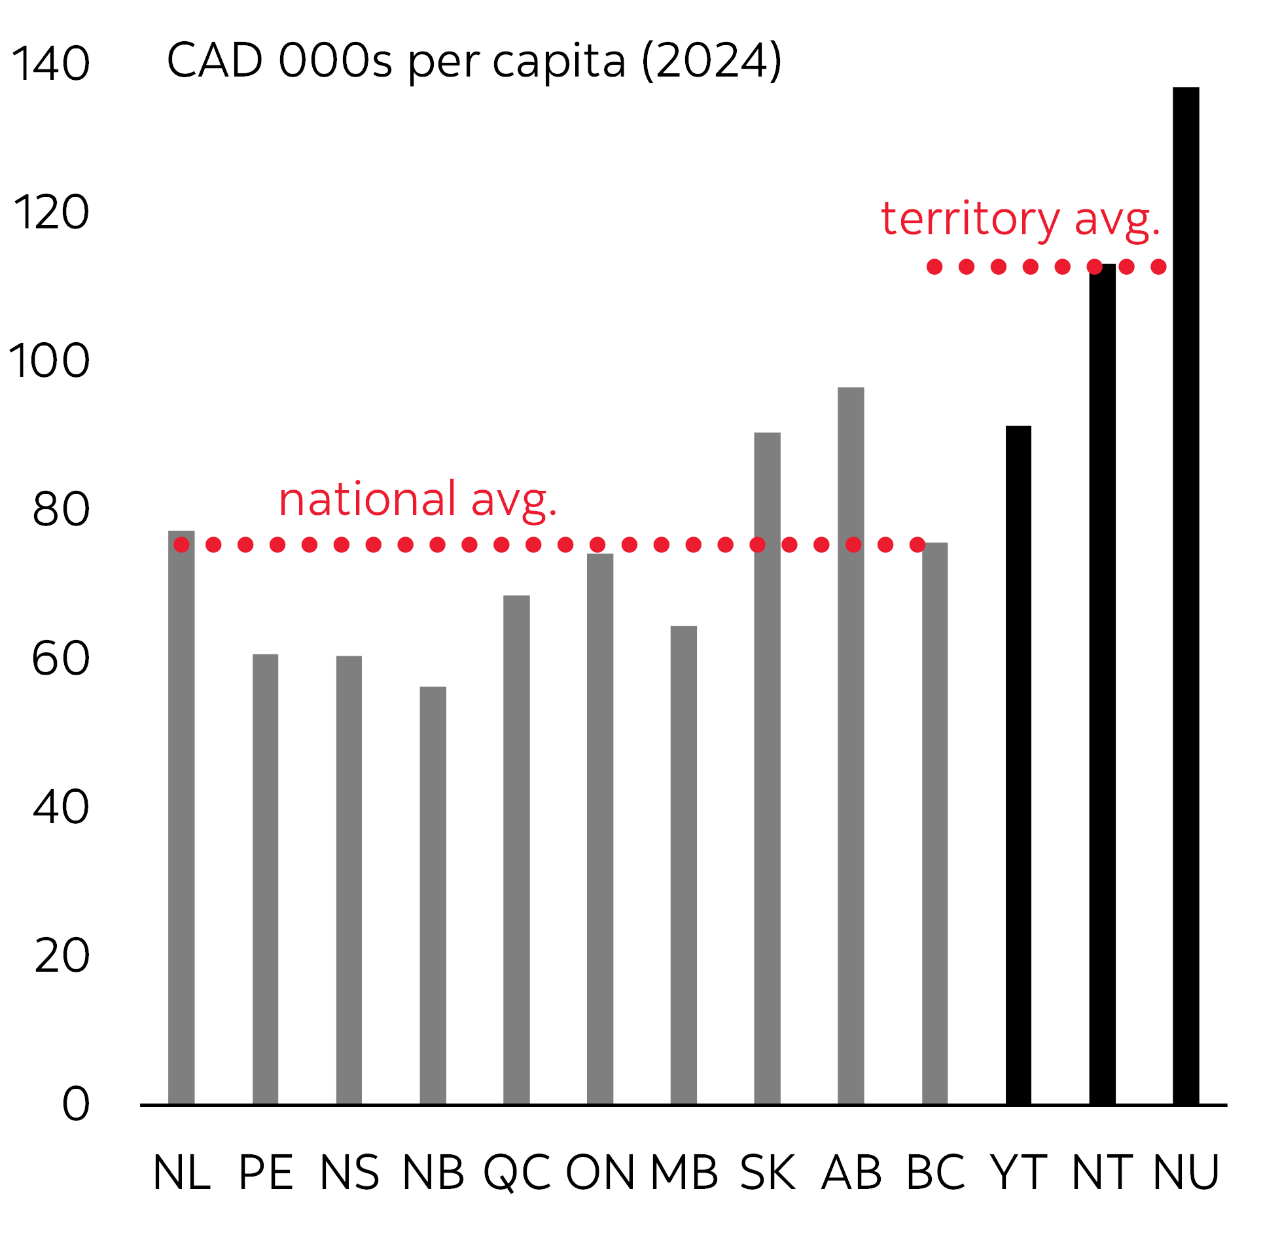
Output per person is high relative to provincial and Arctic peers, but it can overstate northern prosperity. In the territories, GDP per capita is lifted by capital-intensive resource extraction and public services spread across a small, dispersed population (Exhibits 18-20). That can mask an enclave model in which production is high but value leaks out through outside firms, workers, and suppliers, and GDP rises without building broad-based local income, ownership, or wealth. The result is a persistent gap between activity in the North and prosperity in the North.
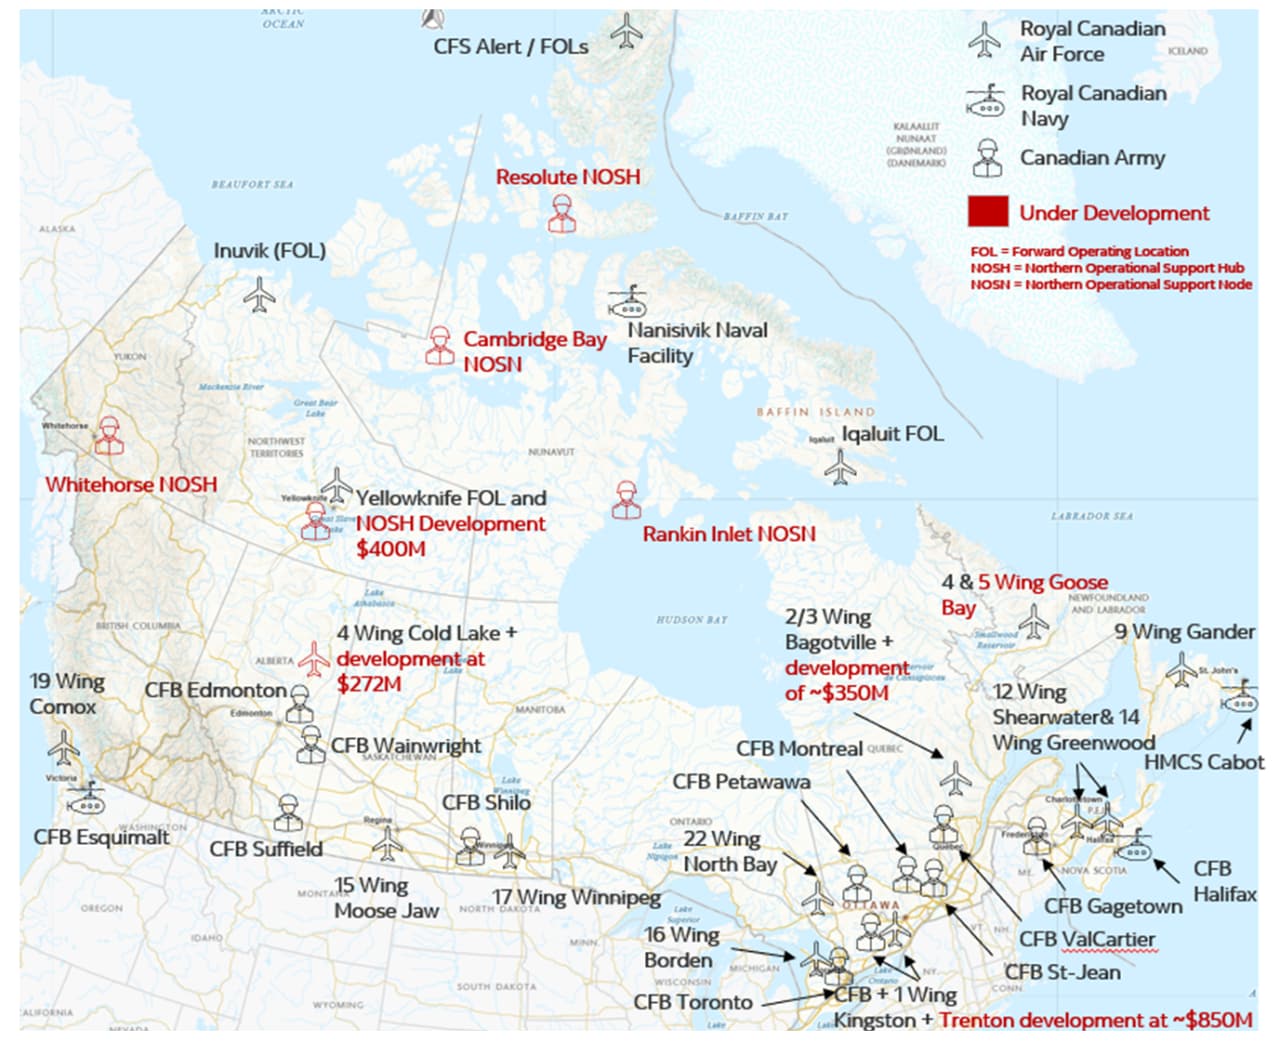
| Exhibit 12 – DND Planned Expansions |
This is starkly apparent in the social realities of many people living in the North, particularly Indigenous Peoples. Persistent gaps in basic needs, health, housing, infrastructure, and economic participation underscore that northern development is not only about mobilizing capital, but about whether that capital improves daily life and broadens opportunity.
From Production to Local Prosperity
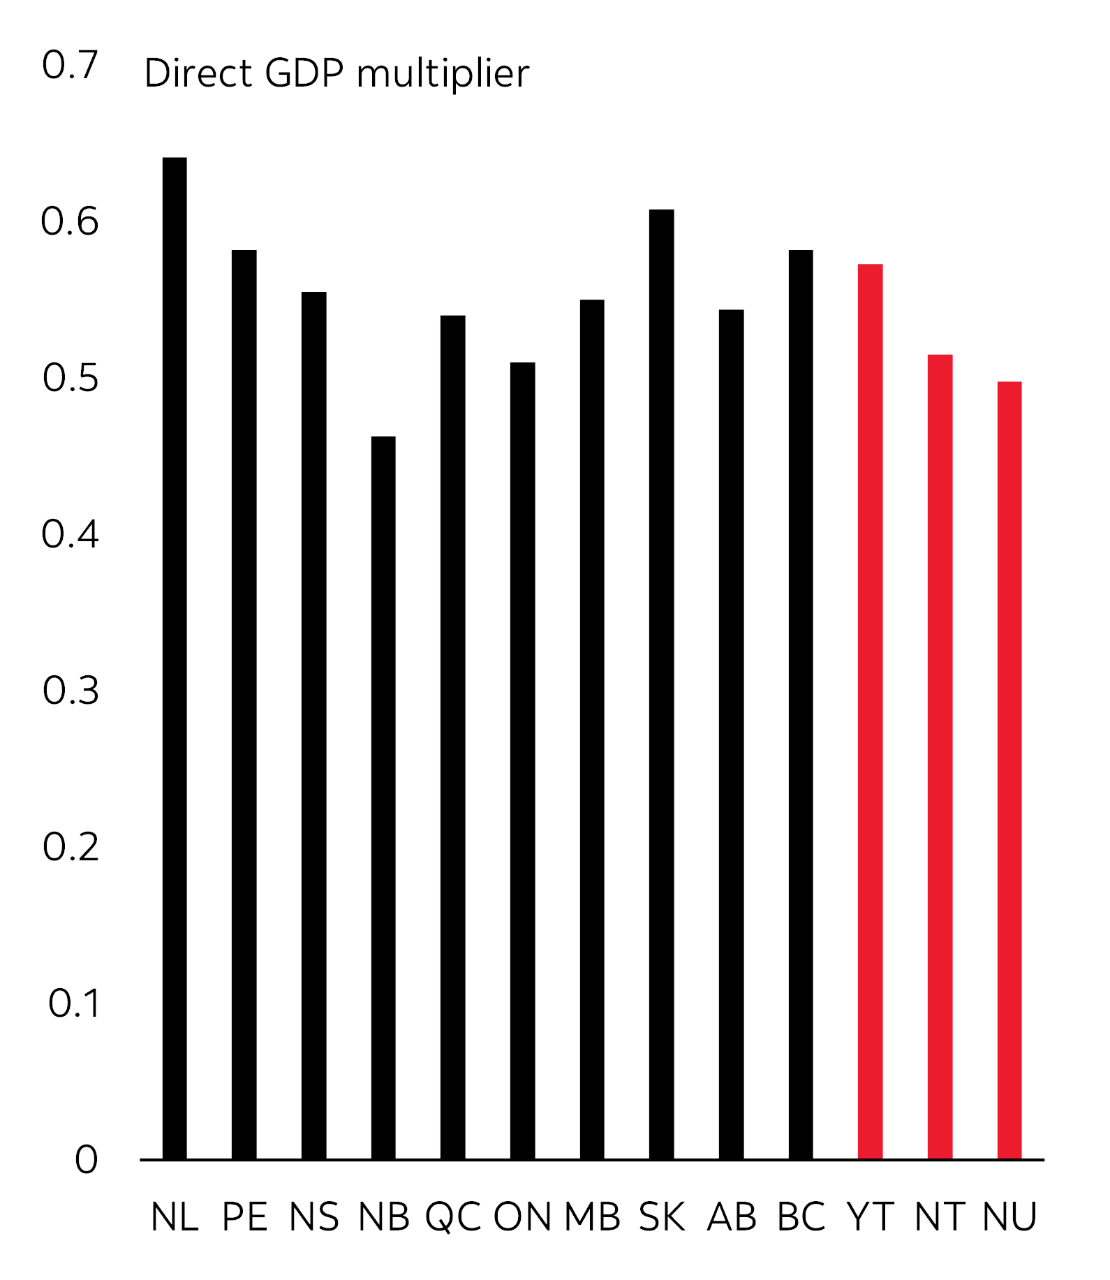
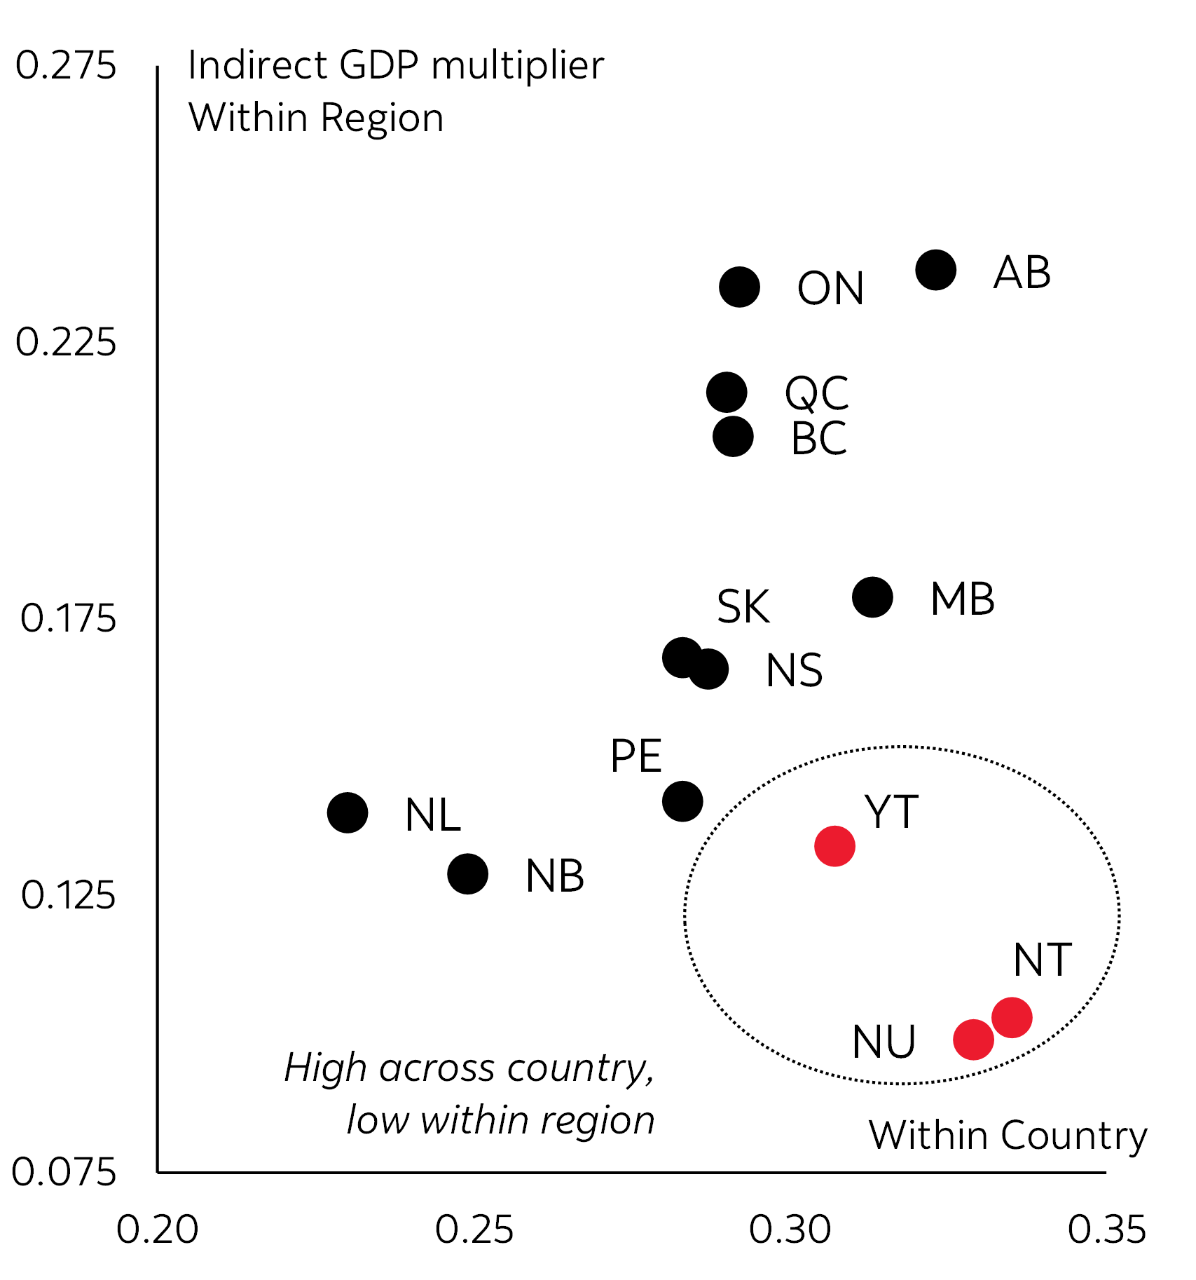
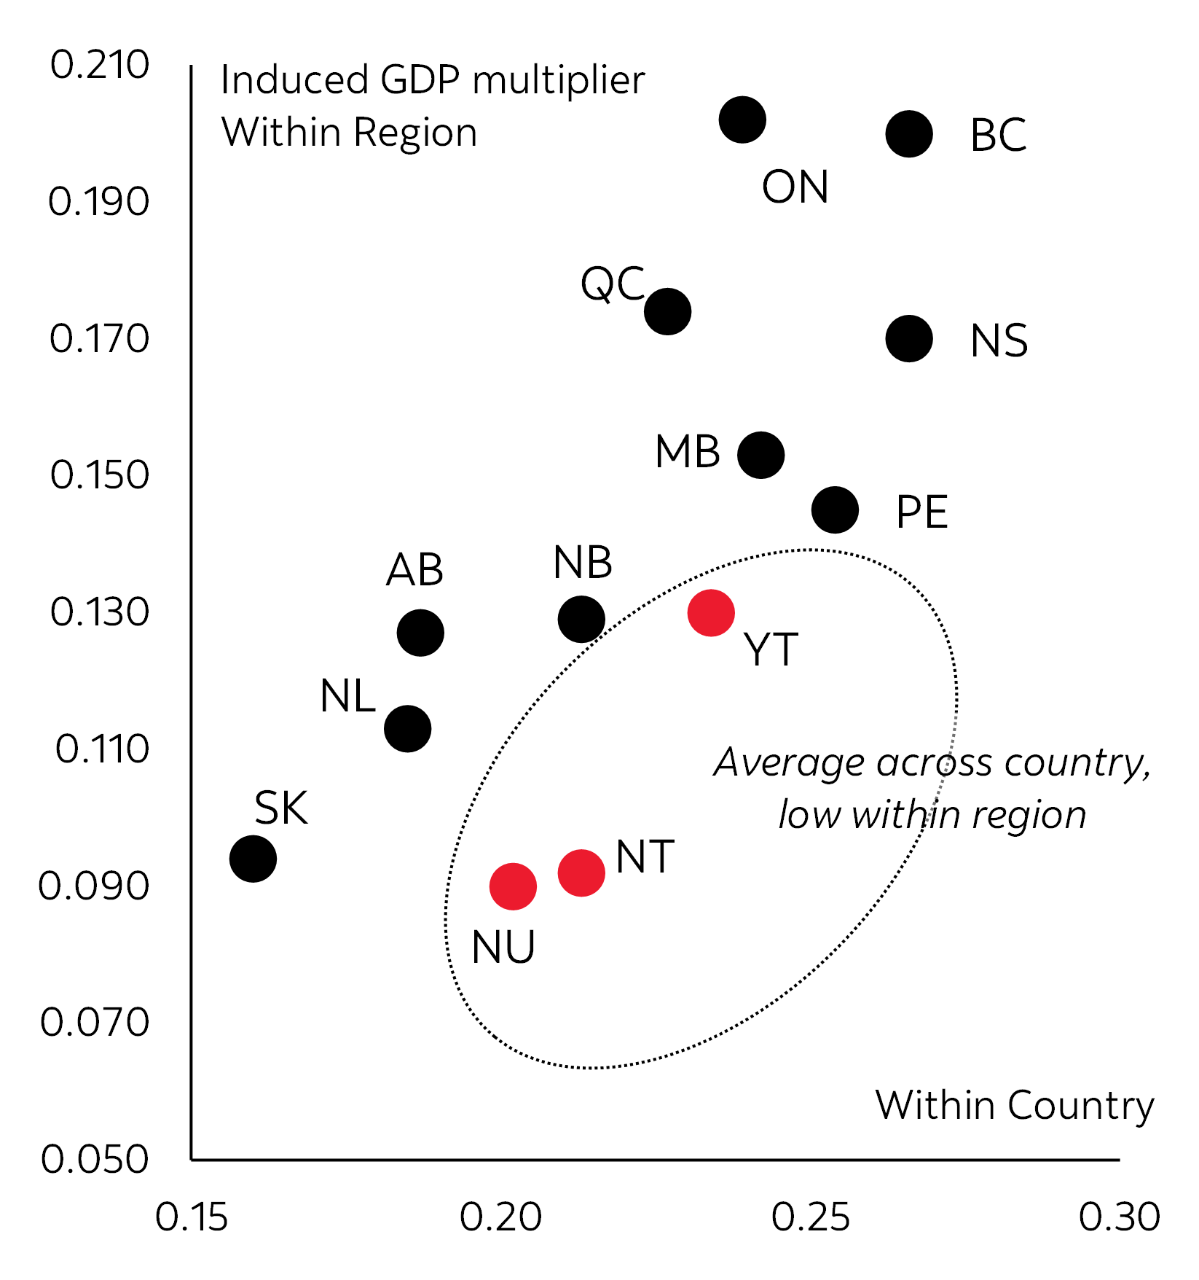
Supply-use data corroborate this story of weak locally retained value. These standard accounting tables trace how activity in one part of the economy creates spending in other parts of the economy. For example, every dollar of direct GDP generated across the Canadian economy is typically associated with roughly another $0.75 in related activity. Some of that comes through supply chains, and some through the additional spending supported by wages and profits. In the North, the first round of activity can be meaningful, but the follow-on spending is less likely to stay local (Exhibits 21-23). Many inputs are imported, and some wages and profits flow out. As a result, national multipliers can overstate how much of a project’s impact is retained in northern communities.
Project proponents and local partners are increasingly trying to narrow that gap. Socio-economic agreements, impact and benefit agreements, procurement commitments, hiring targets, and Indigenous ownership can all increase the share of project value retained locally. Experience in the Northwest Territories and Nunavut shows meaningful gains, with local and Indigenous participation targets for procurement and hiring often falling in the broad range of roughly one-quarter to two-thirds, depending on project phase, sector, and available capacity.
| Exhibit 13 – Share of Arctic Footprint |
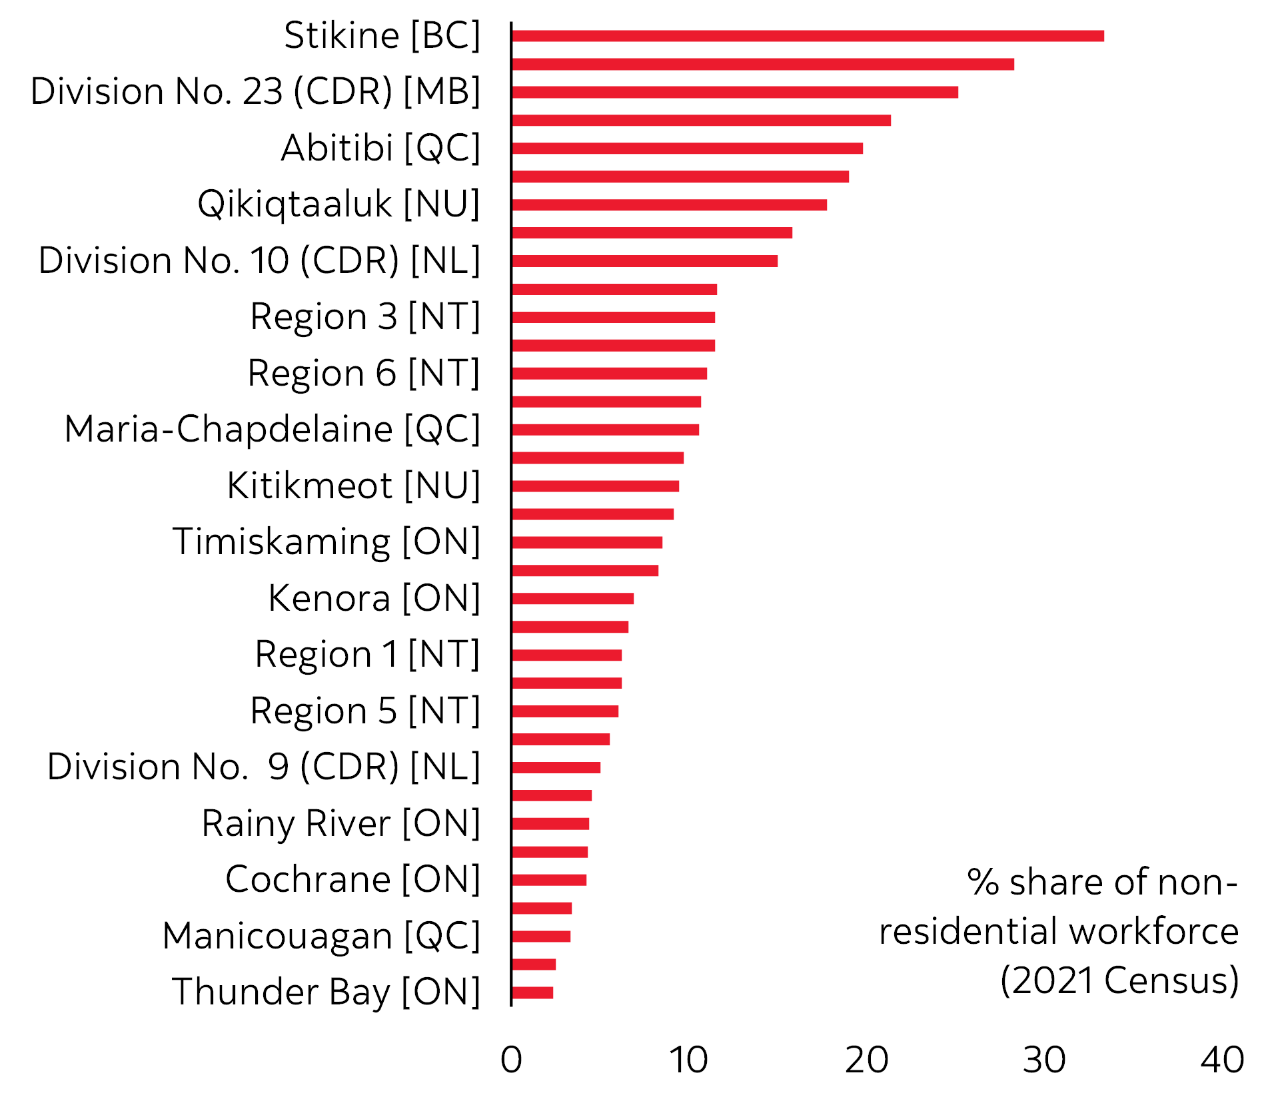
Local capture is nevertheless hard to sustain in the North. Procurement and hiring targets can help, but tight labour markets, limited housing, thin services, and high costs keep many projects reliant on non-resident workers and outside suppliers (Exhibits 24 and 25). In some northern mining communities, fly-in, fly-out workers can make up roughly one-quarter of the workforce. These conditions make local targets harder to sustain over time, especially beyond the construction phase.
Local capture is easier to sustain when the enabling capacity is shared. Training workers, building suppliers, housing families, and providing supporting services can be costly if each project must solve those constraints on its own. Shared capacity can lower those costs, support local participation, and help more value stay in the North. Over time, it can also strengthen local trust and improve license to operate. These are the enabling conditions that turn activity into higher local dividends over time.
From Projects to Productive Capacity
The real long-term potential rests on the supply side. Construction and procurement can lift near-term activity, but the lasting value comes from changing the North’s growth trajectory by adding productive capacity, increasing productivity, and making future projects easier to advance.
Estimating that potential is imprecise. Budget 2025 cites a long-run fiscal multiplier for public infrastructure investment ranging from roughly 0.8 to 3.5, meaning each dollar invested could ultimately raise GDP by $0.80 to $3.50 over the medium term (the high end is optimistic). That range informs Finance Canada’s estimate that Ottawa’s trillion-dollar investment agenda could lift the level of real GDP about 3.5% above baseline by 2030. These are economy-wide benchmarks, not project-level or northern multipliers.
In the North, the translation is less straightforward. High costs, remoteness, and thin markets can dilute local impacts. Conversely, a low capital base and stranded resource potential could raise returns where infrastructure removes binding constraints. The point is not to apply national multipliers mechanically, but to identify the investments that lower costs, unlock private activity, and strengthen strategic presence.
Start with capital itself. Roads, ports, power systems, housing, utilities, and communications networks expand the productive base available to workers and firms. That can raise productivity and potential output over time. Broad estimates suggest the effect is positive but modest. An elasticity near 0.1 means a 10% increase in the public capital stock is associated with roughly a 1% increase in output. (This differs from the fiscal multiplier above: the multiplier links GDP to a spending intervention, whereas elasticity links annual output to the accumulated stock of productive capital.)
| Exhibit 15 – Arctic Seaports |
| Exhibit 16 – Arctic Airports |
That stock effect may matter more where infrastructure unlocks otherwise stranded value, including critical minerals, energy, trade routes, and strategic geography. The arithmetic can also flatter the result on paper. A dollar added to a thin capital base represents a larger percentage gain than the same dollar added to a mature one, even if real gains still depend on project quality, sequencing, and local capacity.
In the North, connectivity is a particularly relevant form of strategic capital because it reduces the economic penalty of distance. Roads, ports, power systems, and communications links connect resources to markets, communities to services, and firms to suppliers. Lower transport, energy, and transaction costs can improve resource allocation and raise productivity across a much larger geography.
Those effects can also come through shared platforms. In thin northern markets, the fixed cost of enabling infrastructure is often too large for any one project to bear alone. Shared assets can spread those costs across firms, communities, and future projects, raising utilization and making more private investment viable. A road, port, power system, or communications link can therefore unlock multiple complementary projects, lifting the system-wide return above the return to any single asset.
Some value will not show up neatly in GDP. Northern infrastructure, including ports, airfields, communications systems, and dual-use assets, can strengthen surveillance, defence readiness, and sovereignty. Markets and policymakers may struggle to price that security dividend because it is partly an insurance value. It reduces the risk and expected cost of disruption, even when those benefits are not captured in measured output.
Together, this is not a case for assuming unusually high multipliers. It is a case for disciplined investment in assets that do more than one job. The North’s thin starting point and substantial latent value make those effects potentially powerful, but only if projects are selected and sequenced as part of a system.
| Exhibit 17 – Arctic Road Density |
| Exhibit 18 – Income Across Arctic Peers |
From Financing to Enabling Foundations
The northern capital challenge is therefore bigger than financing. Canada has an unusual chance to use a major step-up in public, private, Indigenous, and defence investment to build shared systems that lower costs, support presence, and make future projects easier to advance. The question is whether those investments are organized as mutually reinforcing platforms, rather than treated as a series of disconnected projects.
A toolkit is taking shape across public finance, funding, policy, and program tools at the federal, provincial, territorial, and Indigenous levels.2 But many tools are still oriented toward project-level approvals, financing, and last-mile support needed to reach final investment decision. The bigger opportunity is to connect projects, programs, and capital tools into shared northern platforms that deliver more than any single project or entry point.
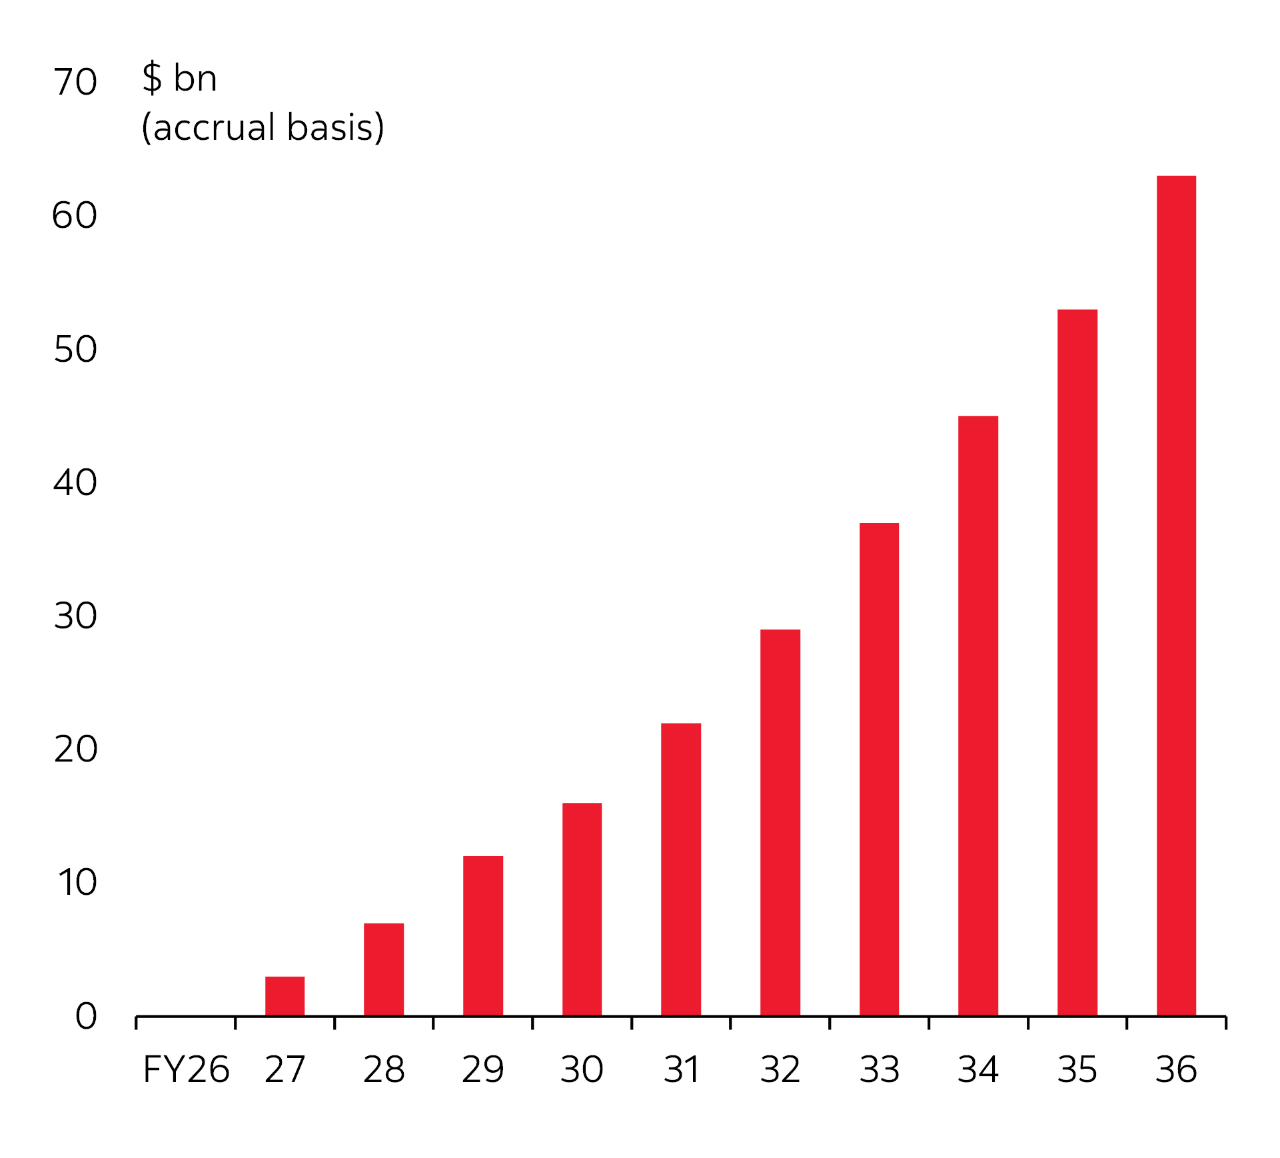
Defence spending is the clearest test of this approach. Ottawa’s dual-use agenda rightly focuses on assets that can improve readiness while also supporting civilian access, commercial activity, and community resilience. As Canada moves toward a 5% NATO spending path, substantial sums are likely still to come, with an outsized share directed north (Exhibits 26 and 27). The key is to ensure that this ramp-up builds shared northern systems rather than isolated military assets.
That logic should also extend to daily life. Ports, airstrips, energy systems, and communications can anchor security and commerce, but year-round presence also depends on housing, services, utilities, and local capacity. In the North, community infrastructure is economic infrastructure.
| Exhibit 19 – Income Across Provinces |
Land and rights certainty is also economic infrastructure. This is especially true in northern regions, where Indigenous Peoples make up a much larger share of the population than nationally and where many projects intersect with treaty, rights, and partnership obligations. Modern treaties cover much of the North, but implementation gaps and unresolved claims remain (Exhibits 28 and 29). Ottawa held $55 billion in contingent liabilities in FY25; despite sparse details, much of the contingent liabilities relates to Indigenous land claims and litigation. Major Projects Office referrals have become a visible signal that a project matters nationally. Unresolved land and rights priorities need a comparable signal as a critical part of the investment foundation. This would not replace free, prior, and informed consent, duty to consult, or constitutional and treaty obligations, but it could signal a shared commitment to faster resolution, deeper trust, and more durable local participation.
Canadians will eventually need to confront the fiscal cost of sustained northern presence. Building in the North is expensive, and it will likely always carry a premium. For decades, Canadians have not had to fully price the cost of Arctic security and sovereignty. That assumption is becoming harder to sustain. Deficit-financed public investment can start the transition, but sustained presence will require a more deliberate public debate about who pays, how costs are shared, and what level of national commitment Canadians are prepared to make.
The implication is simple: northern development should be less about advancing individual projects and more about building systems that reinforce one another. That is harder than approving assets one by one, but it is what determines whether capital becomes lasting presence, capacity, and wealth.
| Exhibit 20 – Industry Concentration Across Arctic Regions |
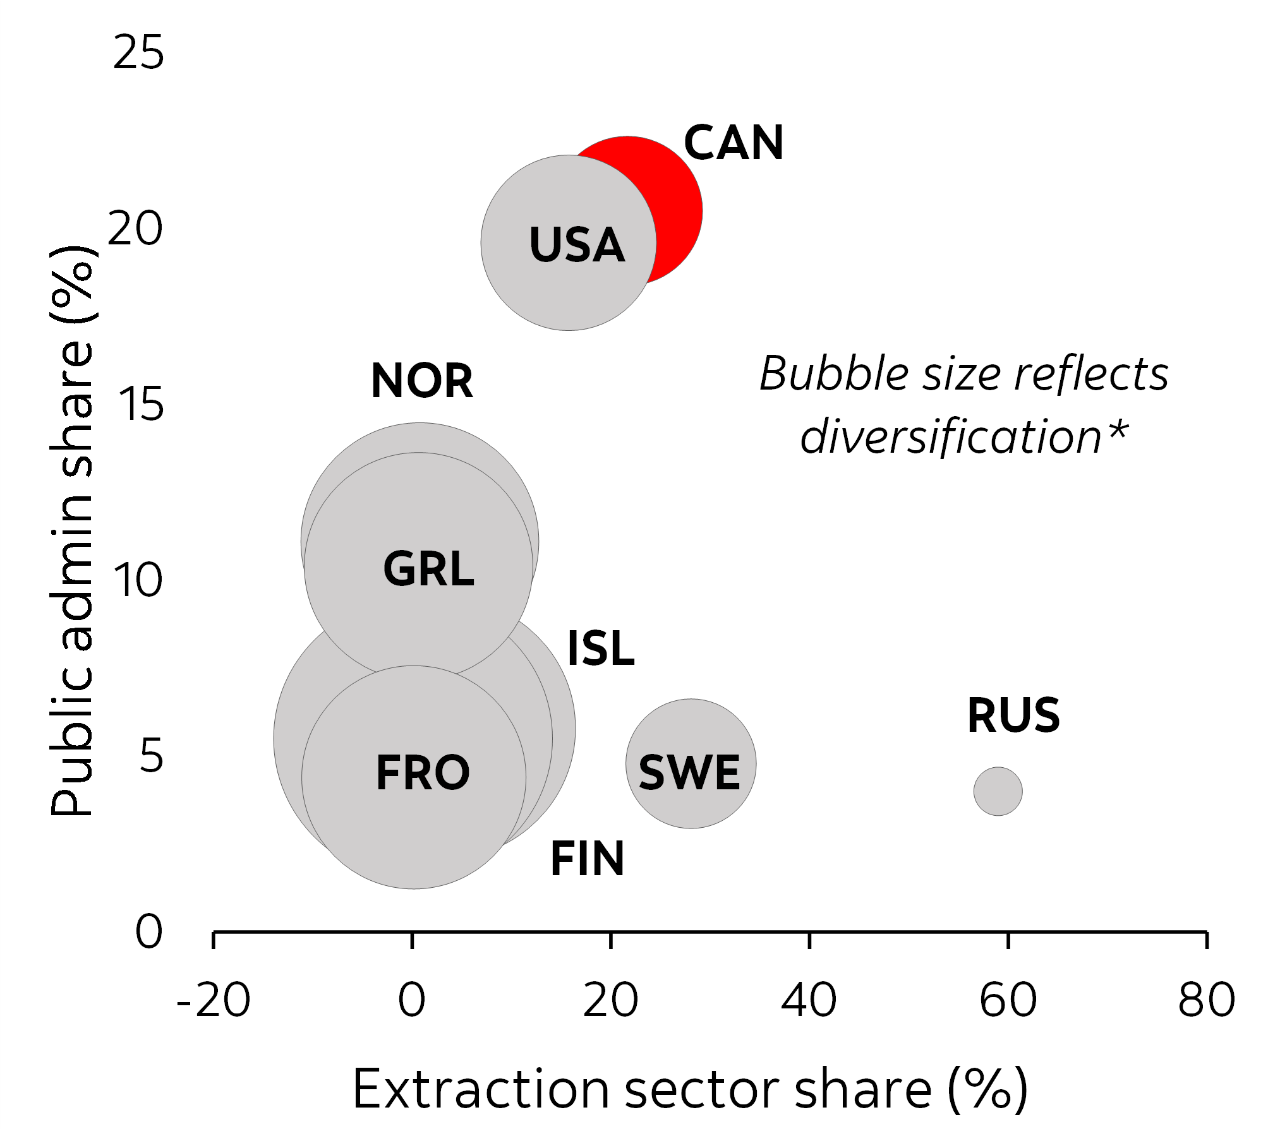
*Inverse Herfindahl-Hirschman Index (larger bubble = more diverse). Data reflect Arctic regions of countries only. Extractive industry includes mining and quarrying and oil and gas.
Sources: Scotiabank Economics; The Arctic Council (ECONOR 2025); Statistics Canada.
Meeting the North’s Capital Call
Canada’s northern capital call is difficult to size precisely, but the direction and order of magnitude are clear. A major investment push is taking shape across private projects, public infrastructure, defence requirements, and the community infrastructure needed for year-round presence. The generational opportunity is to turn that investment into lasting northern presence, stronger productive capacity, and more local wealth.
The response should be ambitious, but disciplined. The test is not simply how much capital is mobilized. It is whether this investment cycle builds mutually reinforcing systems that raise productive capacity, retain more value locally, strengthen community infrastructure, and support a durable security presence.
That is the difference between building in the North and building the North with the North.
| Exhibit 21 – Direct GDP Multipliers |
| Exhibit 22 – Indirect Multipliers (e.g., Supply Chain) |
| Exhibit 23 – Induced Multipliers (e.g., Income) |
| Exhibit 24 – Non-Resident Labour Force in Northern Mining Regions |
| Exhibit 25 – Dwellings per Capita |
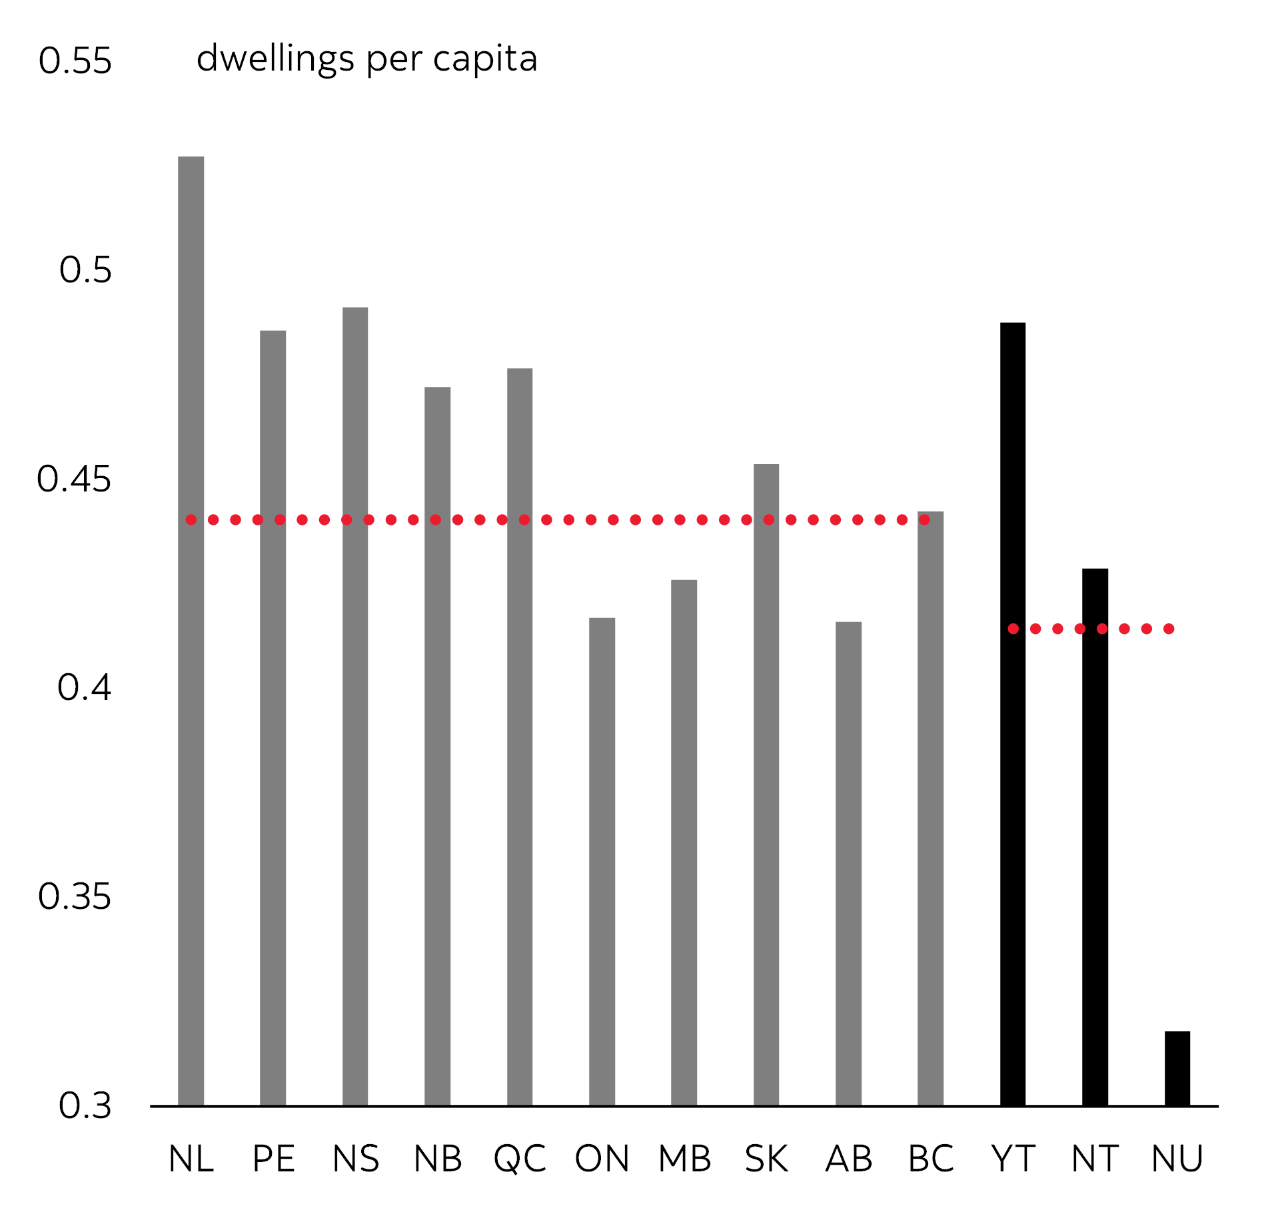
Exhibit 26 – Historic Defence Spending
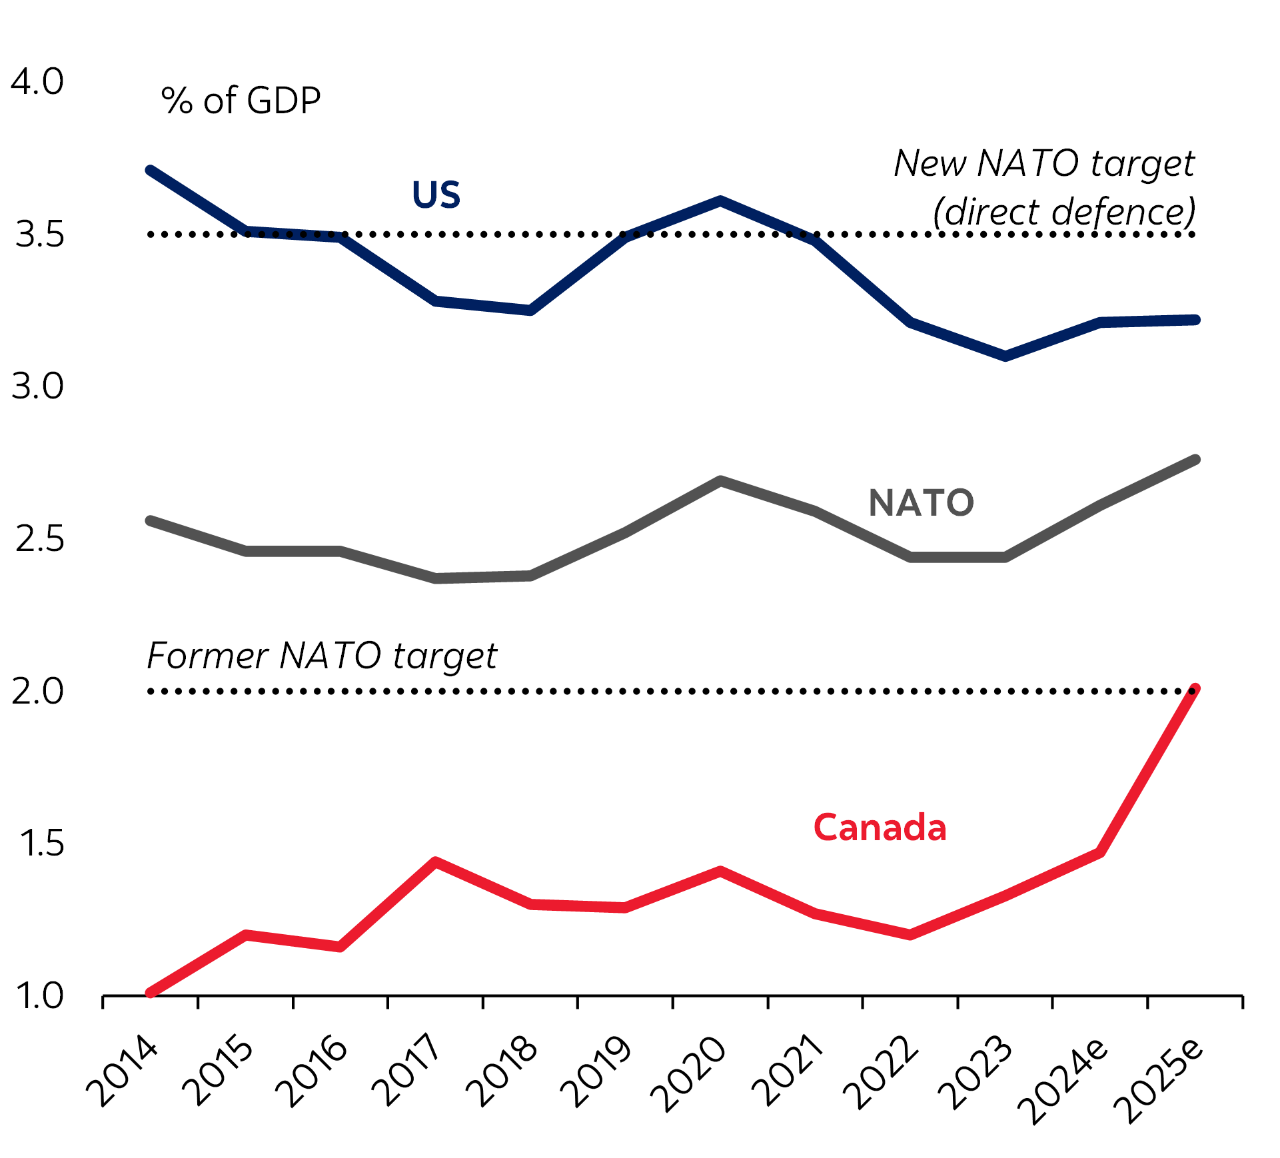
Note: The federal government has not provided consolidated defence figures since its 2024 plan.
Sources: Scotiabank Economics; NATO.
Exhibit 27 – Estimated Fiscal Shortfall to Meet NATO’s 5% Target
| Exhibit 28 – Indigenous Settlements and Treaties |
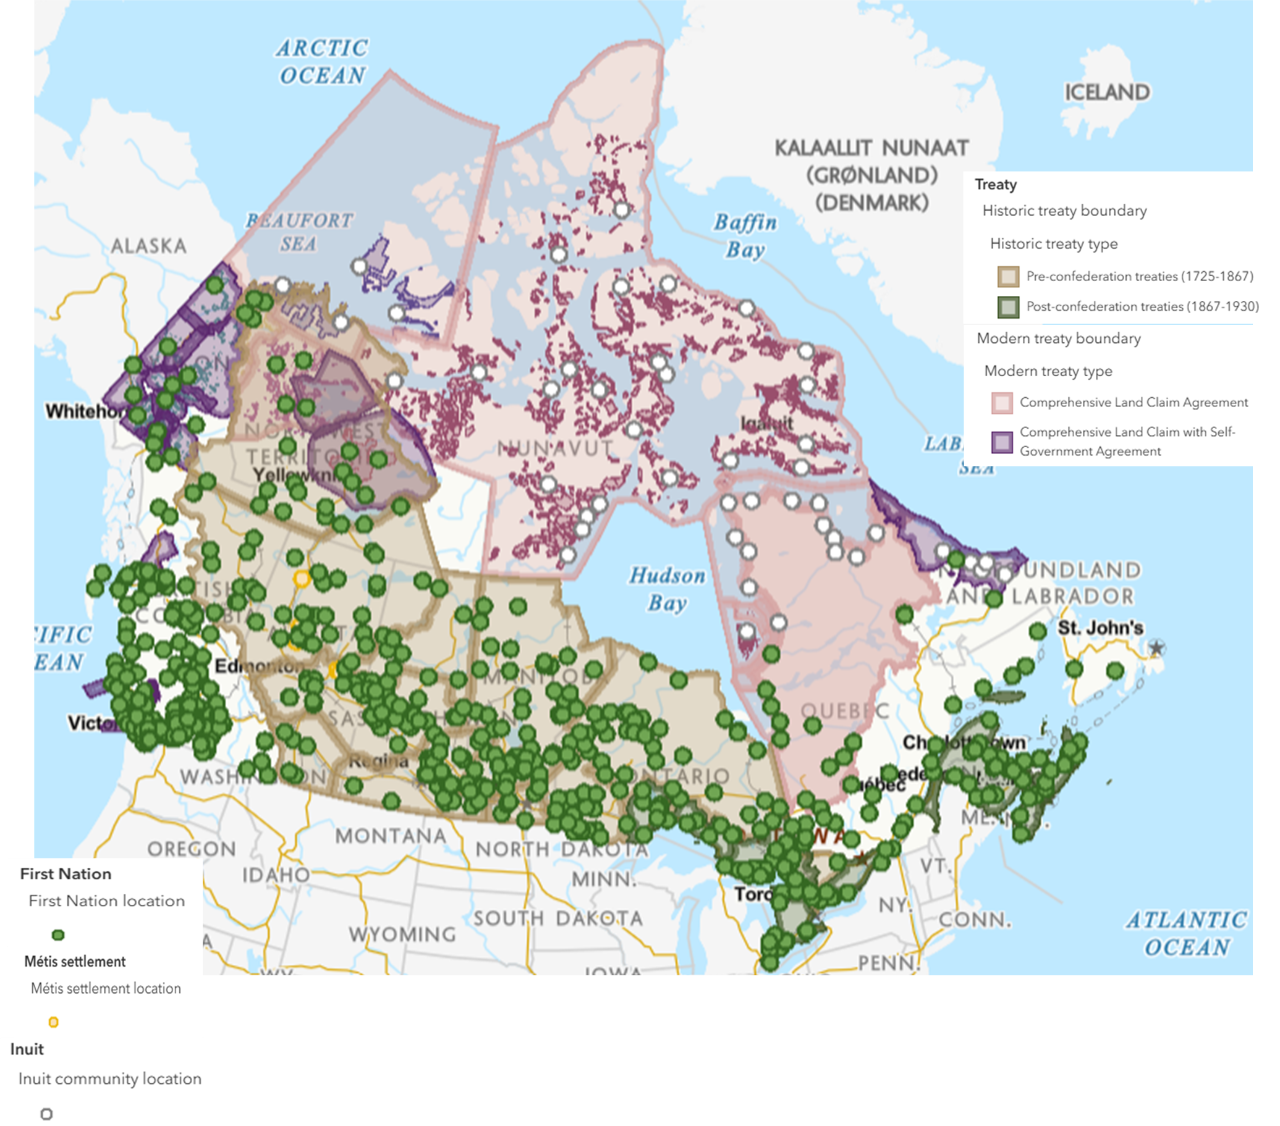
| Exhibit 29 – Indigenous Claims and Assertions |