FORECAST UPDATES
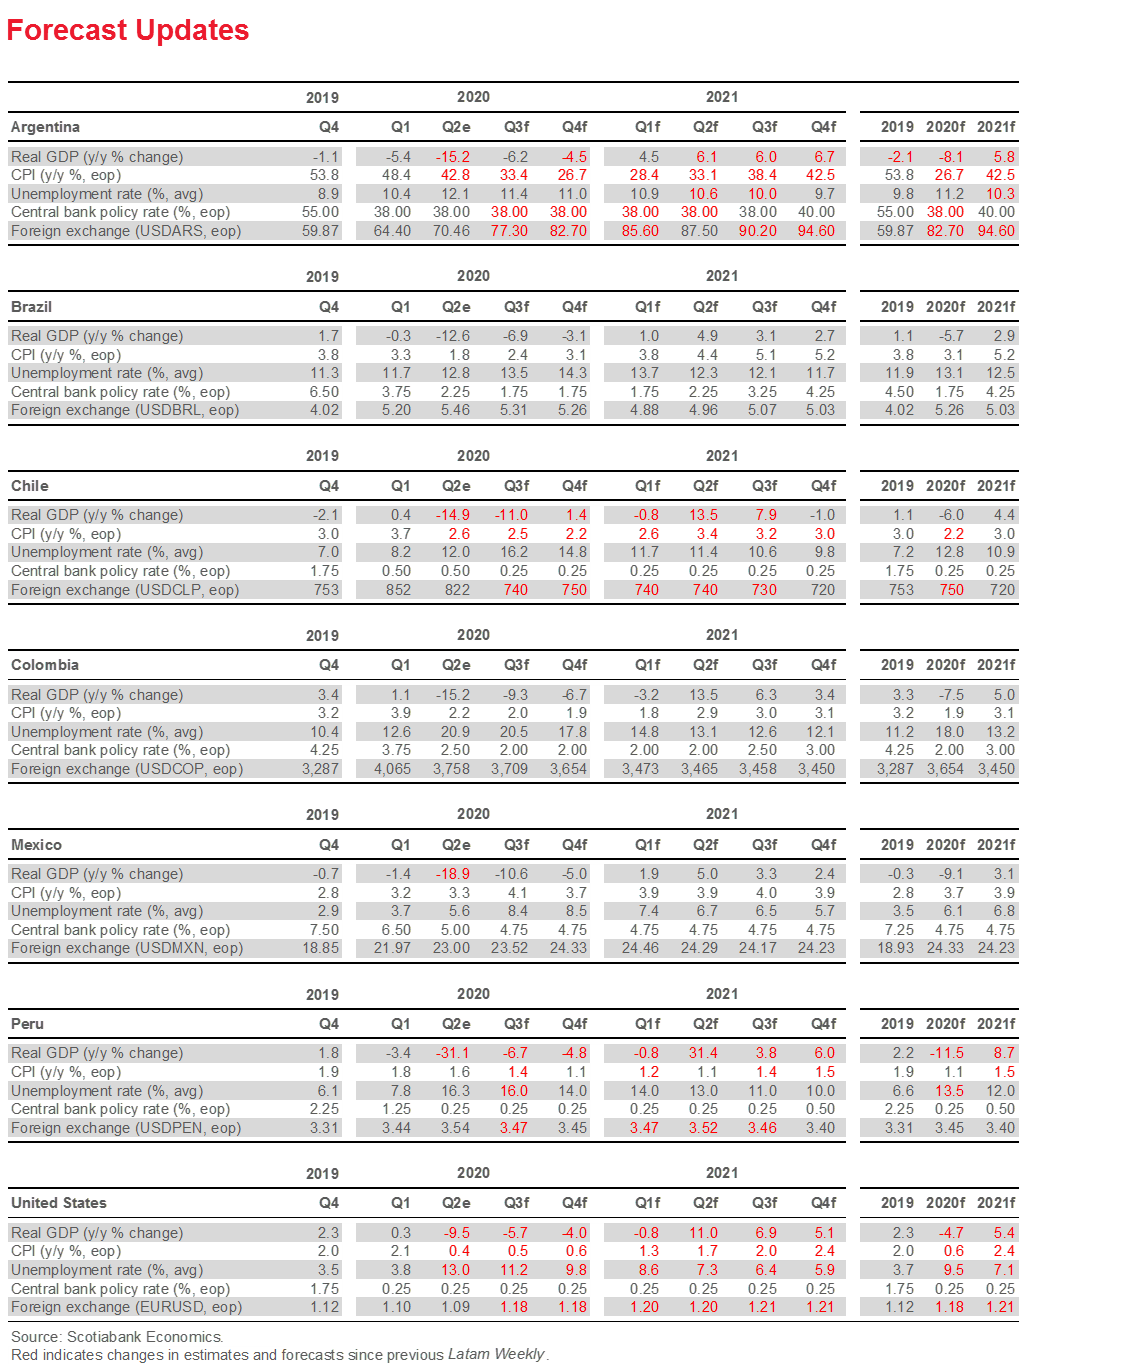
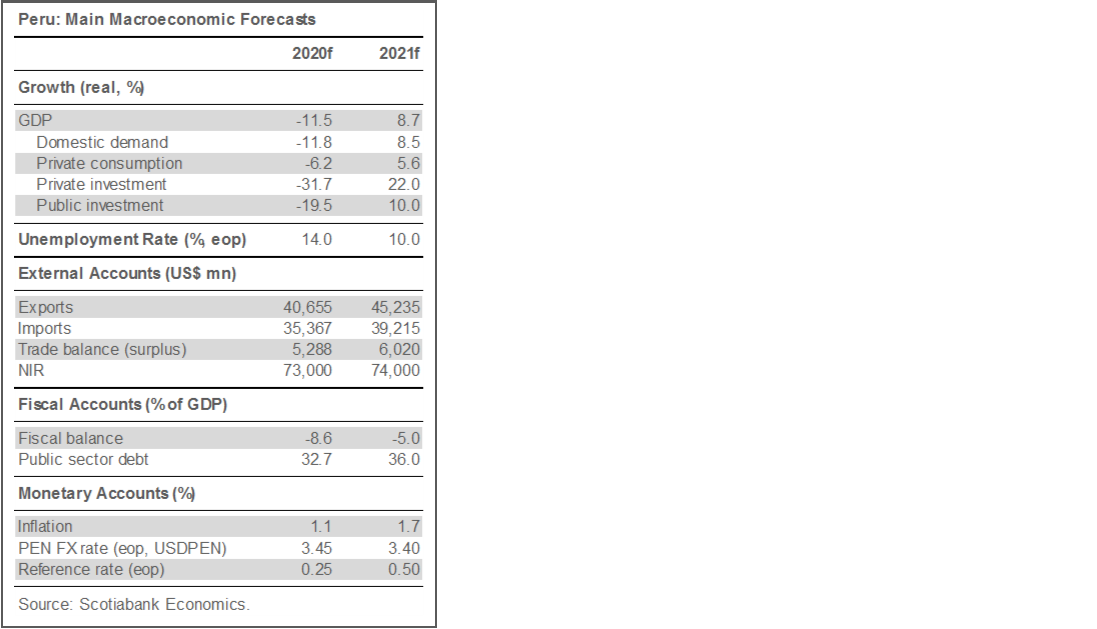
Otherwise minor forecast revisions are dominated by a cut in Peru’s 2020 growth outlook from -9.0% y/y to -11.5% y/y.
ECONOMIC OVERVIEW
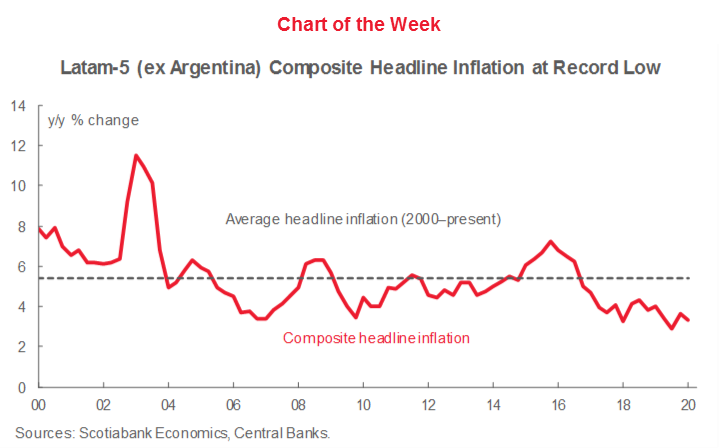
With Latam-wide inflation at record lows, we expect some further headline annual disinflation to support additional rate cuts in Brazil, Colombia, and Mexico, and an ongoing dovish stance from the central banks in Chile and Peru.
MARKETS REPORT
We analyze the latest inflation readings and contrast them with market-based inflation expectations, our forecasts, central bank projections, and analysts’ consensus.
COUNTRY UPDATES
Concise analysis of recent developments and guides to the fortnight ahead in the Latam-6: Argentina, Brazil, Chile, Colombia, Mexico, and Peru.
MARKET EVENTS & INDICATORS
Risk calendar with selected highlights for the period August 8–21 across our six major Latam economies.
Economic Overview: The Disinflation Echo
Brett House, VP & Deputy Chief Economist
416.863.7463
Scotiabank Economics
brett.house@scotiabank.com
Otherwise minor forecast revisions are dominated by a cut in Peru’s 2020 growth outlook from -9.05 y/y to -11.5% y/y.
Price declines typically lag drops in output. With Latam-wide inflation at record lows, we expect some further disinflation to support additional rate cuts in Brazil, Colombia, and Mexico, and an ongoing dovish stance from the central banks in Chile and Peru.
The need for extended restrictions to fight COVID-19 contagion presents ongoing downside risks to the region’s growth outlook.
Pension changes remain in focus as lawmakers move to allow further withdrawals from Peru’s AFPs.
MARKET & FORECAST UPDATES
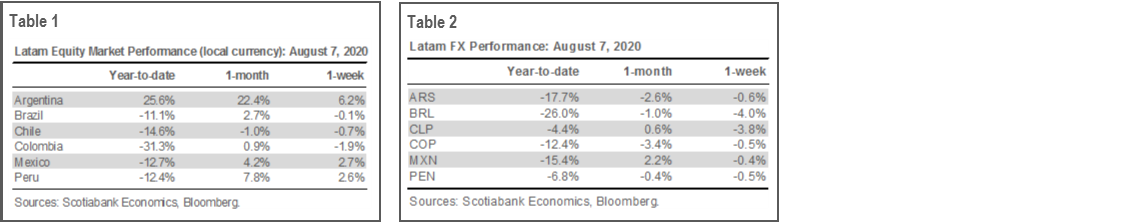
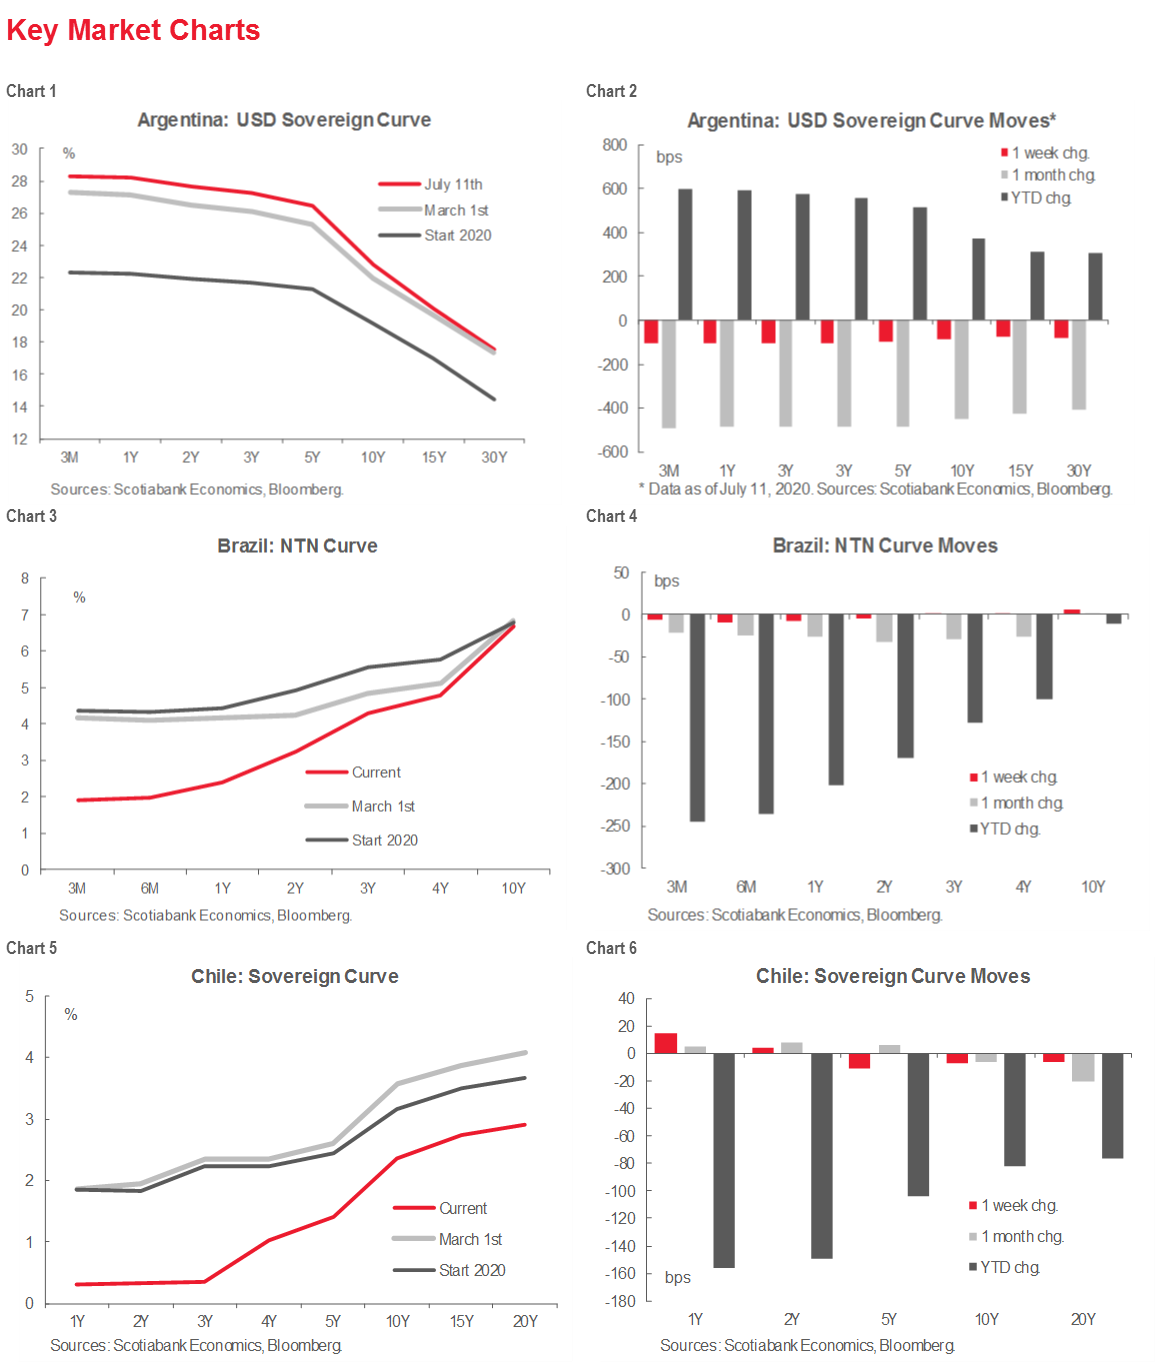
Emerging-market risk benefitted from a week of gains in US equity markets despite a “just okay” US jobs reports on Friday, worsening US-China trade tensions, and stalled talks on further fiscal aid from Washington to the pandemic-stricken US economy. Equities rallied in Argentina on news Tuesday of an agreement on a deal to treat its USD 65 bn in foreign-law bonds in default (table 1), while Peru’s markets benefited from further progress in re-opening. Latam currencies were broadly flat on the week, with downward moves in BRL and CLP the notable exceptions (table 2). Brazil’s real suffered despite intervention from the BCB as June IPCA inflation data remained contained, which removes at least one impediment to a further cut to the Selic in September that would take record-low Brazil-US rate differentials even lower. Concerns are also increasing about the deterioration in the fiscal stance, pressure for changes in the spending limit, and possible delays in bringing forth a broader fiscal reform package. The CLP dropped on a pullback in copper prices driven by the US-China spat even as China registered record copper imports for the month of July.
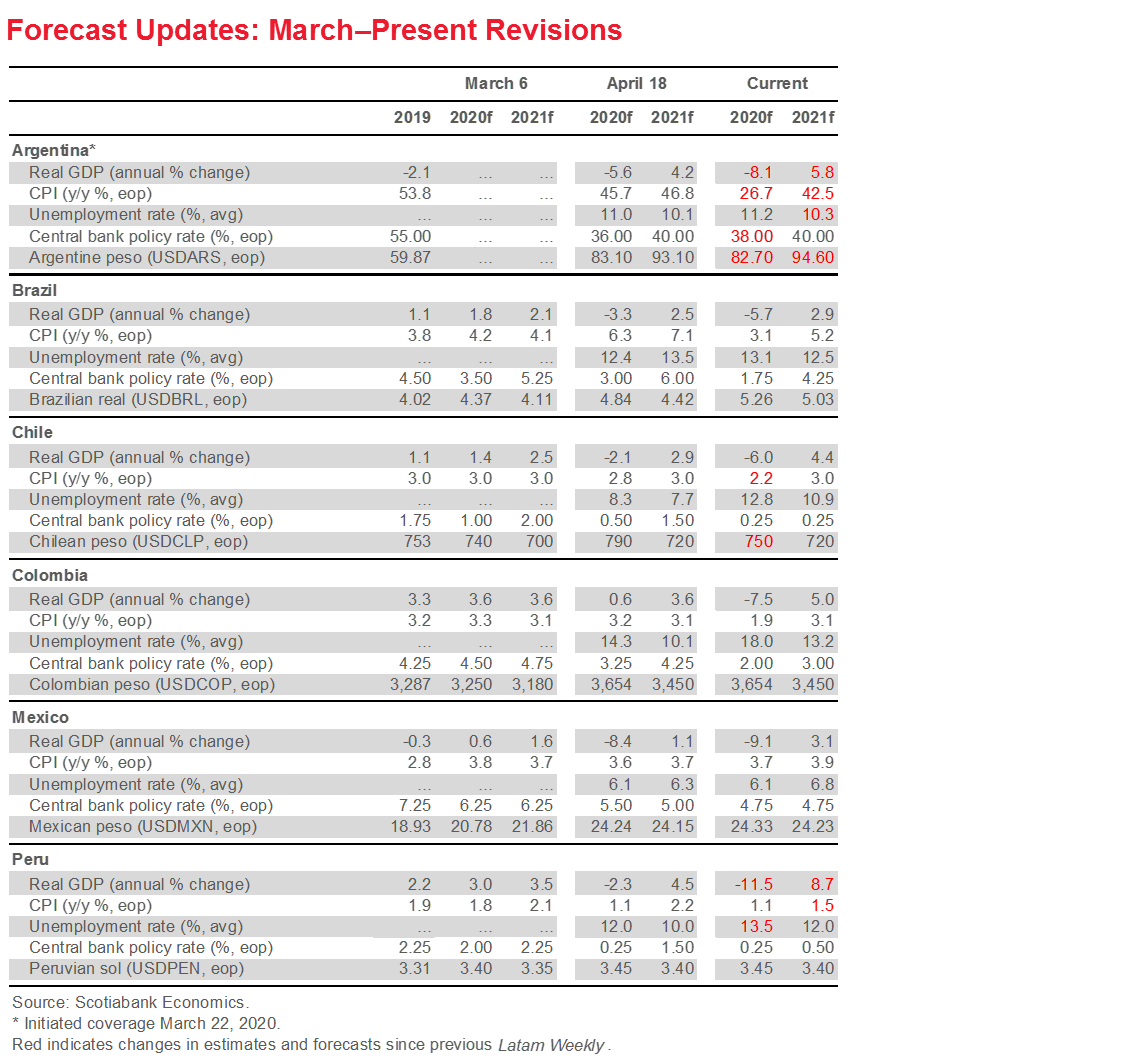
Scotiabank Economics’ August 6 update to our Global Outlook and Forecast Tables featured some limited revisions to our Latam projections, with the most substantial change reflected in a further downgrade to Peru’s 2020 growth outlook (see Forecast Updates, pp. 2 and 3).
Argentina. Growth in 2020 has been pared marginally, from a contraction of -7.9% y/y to a new forecast of -8.1% y/y, with a milder rebound in 2021 at 5.8% y/y versus our previous forecast of 6.5% y/y.
Chile. Inflation at end-2020 has been brought down from 2.4% y/y to 2.2% y/y with a stronger peso, up from USDCLP 790 to 750 in December 2020.
Peru. Although our forecast for real growth in 2020 has expected for some time a contraction of -9.0% y/y, our team in Lima has also signalled that the uncertainties around the impact of the lockdown and the phased re-opening process mean that the pullback in 2020 could be as deep as -14% y/y. With recent data, we have firmed up our projection for 2020 at -11.5% y/y and boosted the expected rebound in 2021 from 7.0% y/y to 8.7% y/y.
With many indicators across the region having turned stronger during the May–June period as re-opening progressed, these forecast changes could mark an end to further moves to soften our outlook. Yet, with the pandemic still rampant in many parts of Latam, economic prospects remain subject to wider confidence intervals than would normally be the case.
DISINFLATION: MORE TO COME
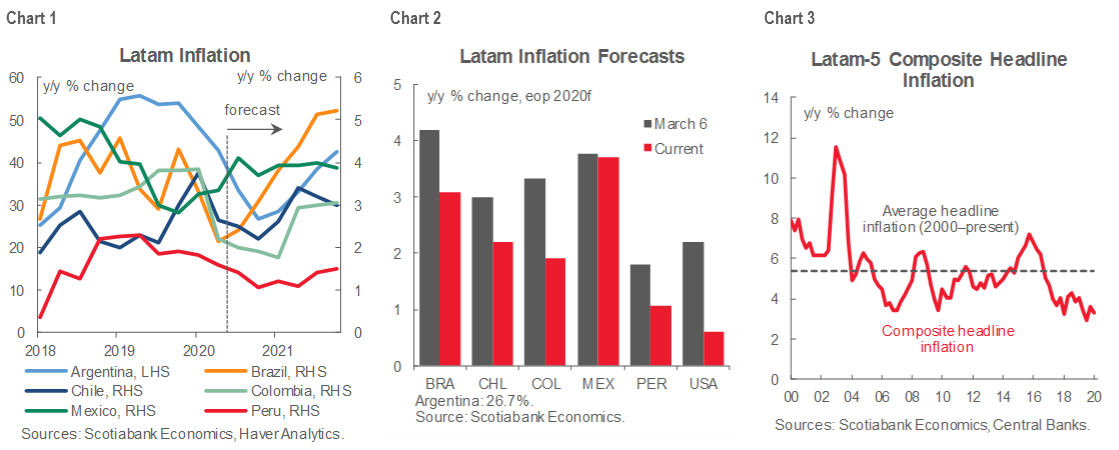
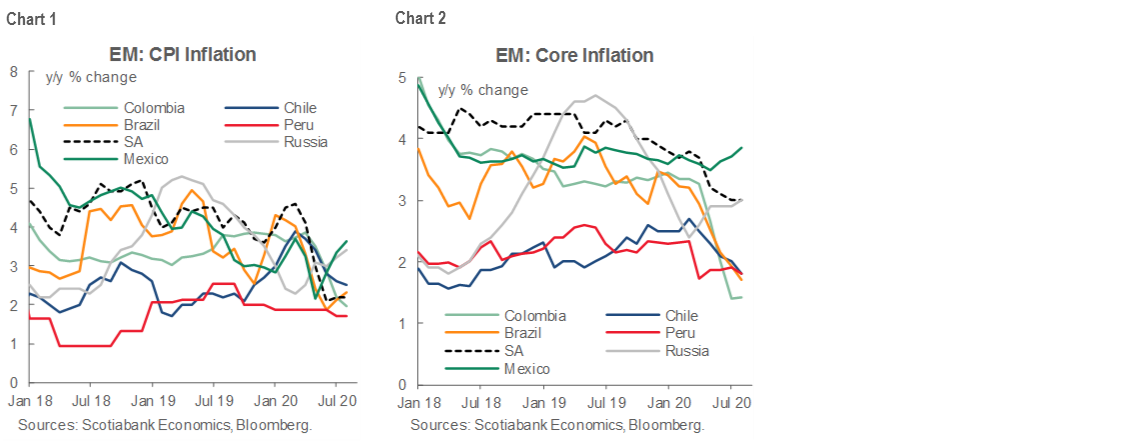
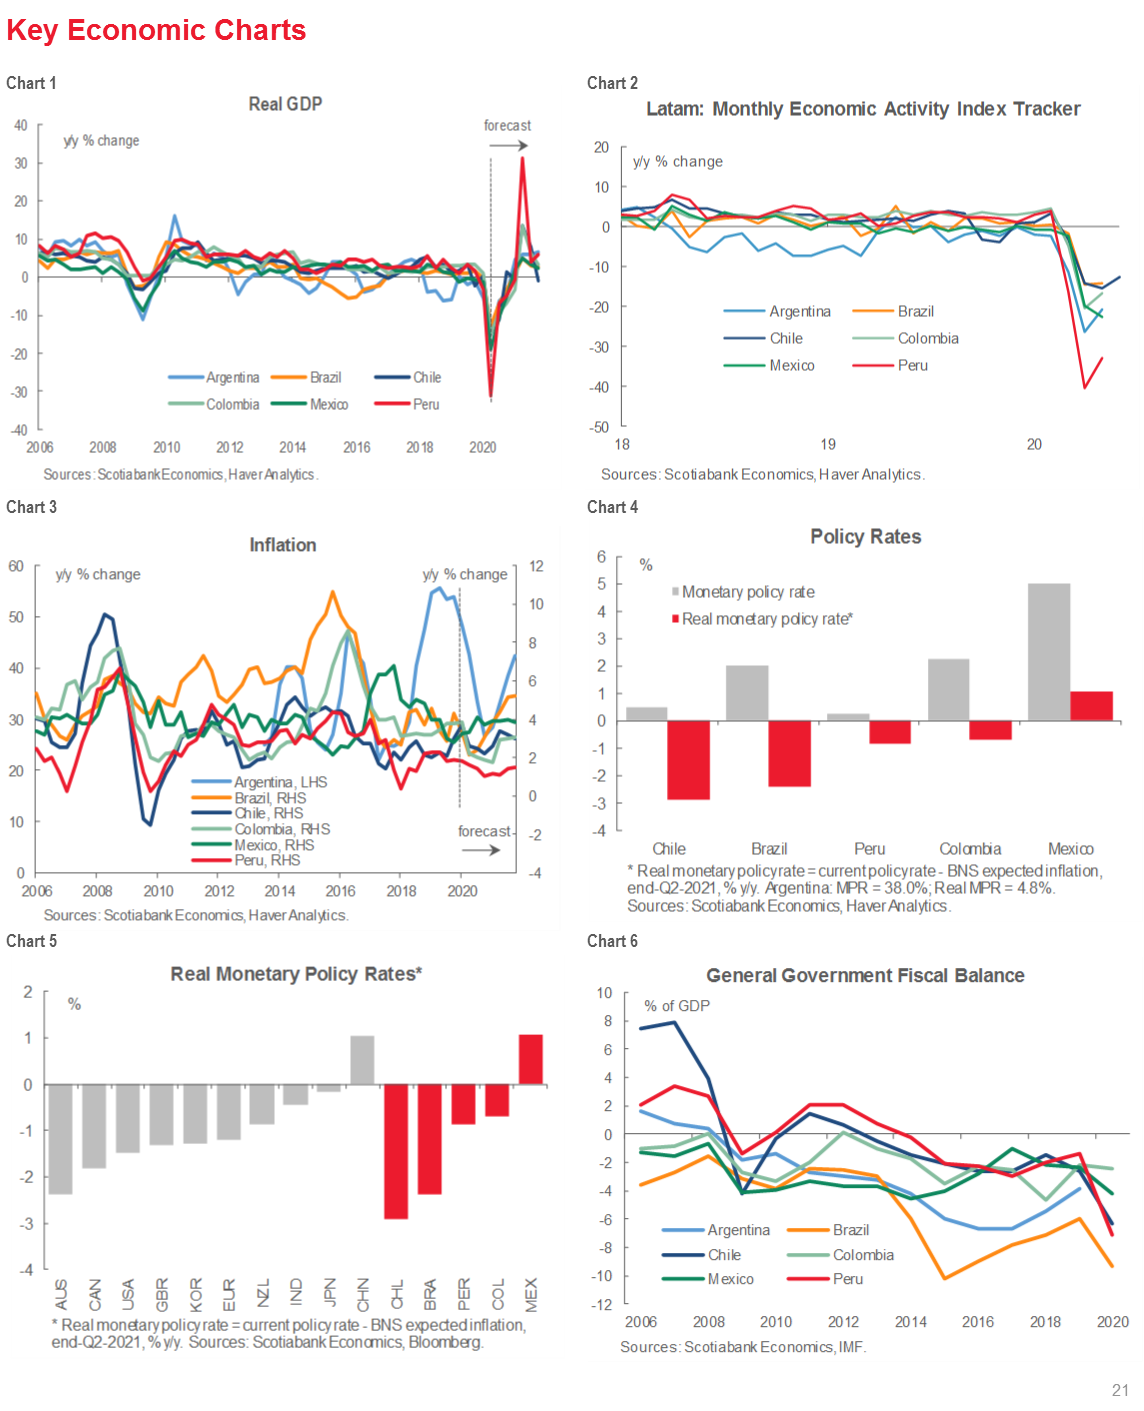
Although macroeconomic indicators imply that economic activity in Latam hit its bottom in April–May and has since turned a corner, prices typically lag output declines and we expect headline annual inflation numbers to continue to trend downward to end-2020 (see Forecast Updates, pp. 2 and 3). Mexico stands out as the only member of the Latam-6 where we forecast annual inflation at year-end to be higher in 2020 than in 2019 (chart 1); our Mexico inflation forecasts are relatively little changed from earlier this year (chart 2), which accounts for the caution from our team in CDMX on further cuts from Banxico compared with market pricing (see What’s Priced in, p. 4). Inflation-targeting regimes across five of the Latam-6—Argentina is the obvious exception—have delivered record-low inflation to the region (chart 3), which leaves room for the further rate cuts we expect in Brazil, Colombia, and Mexico, and an ongoing dovish stance from the central banks in Chile and Peru.
FORTNIGHT AHEAD
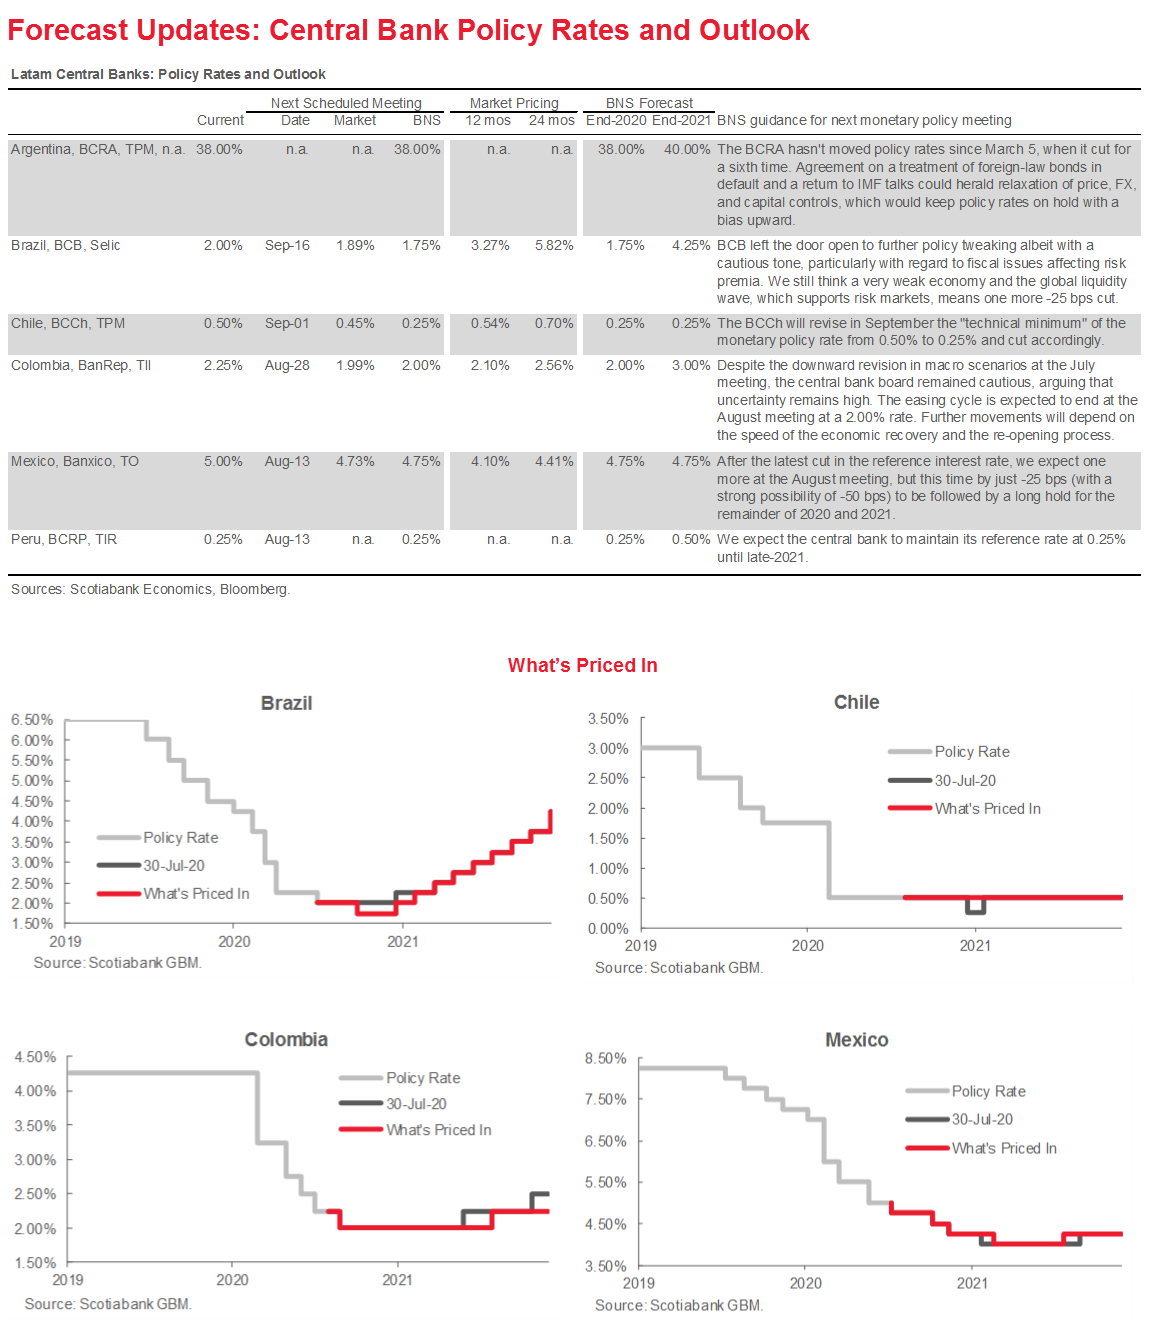
I. Central banks: tipped toward the doves
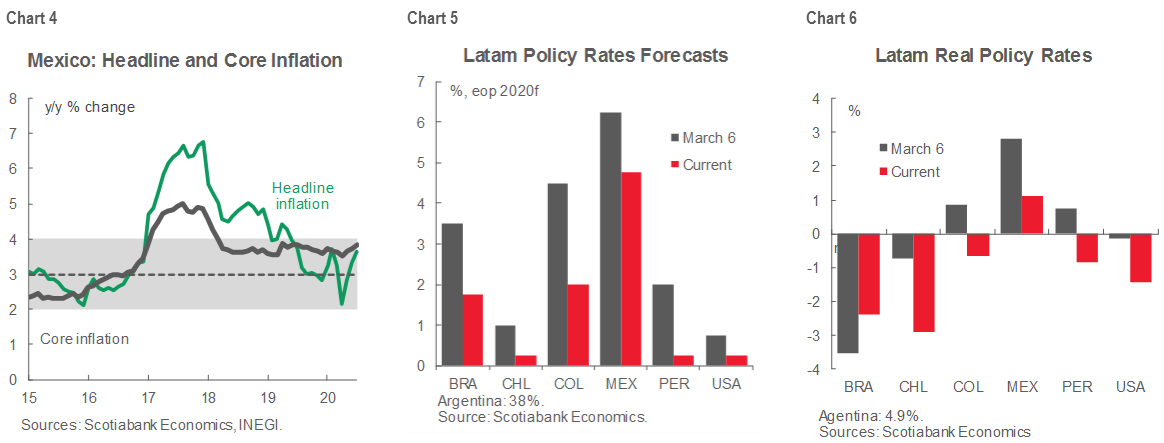
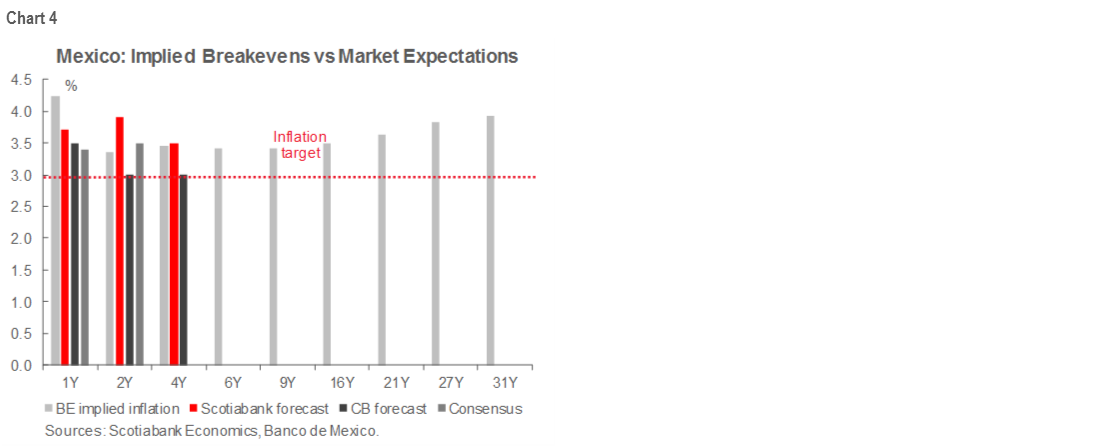
Mexico. Banxico’s Governing Board meets on Thursday, August 13 and our team in CDMX expects it to bring forward a -25 bps cut to a terminal rate of 4.75% for this easing cycle, but our colleagues acknowledge a decent possibility that the Board could deliver on some calls for a -50 bps move, which would repeat the half-point cut they made to the interbank rate target on June 25. The Banxico Board is faced with balancing the benefits of further easing against the risks posed by persistent and rising headline inflation (chart 4) that could move above the 4% ceiling of Bank’s inflation target tolerance range in the coming months. Markets are pricing further cuts beyond next week’s meeting (see What’s Priced In, p. 4) in the expectation that a massive contraction in the Mexican economy in 2020 will pull prices down as the output gap widens. Although our forecasts for Mexico’s policy rates have come down the least compared with other countries in the region (chart 5), the highest real policy rates in Latam (chart 6) imply that the Banco de Mexico has room to ease further if it assesses that potential risks to the MXN and inflation can be managed. Whatever the size of the cut, look to the statement for indications on whether the easing cycle is done.
Peru. The BCRP’s Monetary Policy Committee meets on Thursday, August 13 and is expected to hold its headline policy rate at 0.25%, an all-time low, just as it did at its last meeting on July 9. The MPC skewed dovish in its July statement where it indicated that inflation is now expected to come in below the 1% floor of the target band not only in 2020, but also in 2021. On monetary policy, the MPC reiterated that it would “maintain a strong expansionary monetary stance”, but it shifted from promising to do so “for an extended period” in its June statement to “for as long as the negative effects of the pandemic on inflation and its determinants persist.” It also repeated that it stood ready to “extend monetary stimulus using a range of instruments”, a signal that it would eschew further rate cuts in favour of enhanced liquidity and credit measures to support Peru’s economy. Our team in Lima expects the BCRP to stay on hold until Q4-2021, when it could introduce a first 25 bps increase to begin normalizing its policy rates.
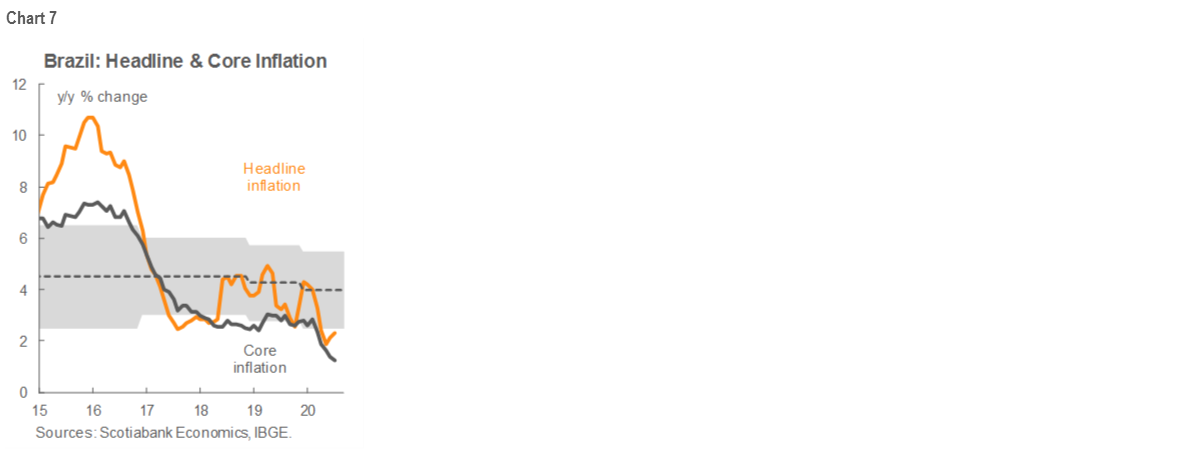
Brazil. The Minutes from the Wednesday, August 5 Copom meeting will be published by the BCB on Tuesday, August 11. At the August 5 meeting, the Copom’s members voted unanimously to make a so-called “residual” -25 bps cut to the Selic to take it to a record-low 2.00%. The Copom’s August 5 statement laid out the two-sided risks with which it is grappling and did not shut the door on further easing. On the on the downside, the Copom noted that the output gap provides a dampener on prices with inflation already below target (chart 7), but on the upside, the country’s weakening fiscal stance and increasing risk premium are generating upward pressures on prices. The policy reform process, particularly around fiscal issues, was mentioned several times in the statement and risk premia considerations appear to be driving the BCB’s move to a more cautious stance on rates after the -75 bps cut at its June meeting. In this context, the statement indicated that room for additional easing is likely small and that further moves would be marginal. The Minutes may shed some light on just how large this room for additional easing is. Our Brazil economist continues to expect a final -25 bps cut at the September Copom meeting to take the Selic to 1.75% and markets are now pricing this move (see What’s Priced In, p. 4).
II. Macro data: June GDP data dominate macro releases
In macroeconomic data, Q2 GDP numbers for Colombia Q2 (Friday, August 14) and Chile (Tuesday, August 18) are likely to confirm what we already know from higher-frequency monthly data on a dismal quarter. We expect a -15.2 y/y contraction in Colombia and a -14.9% y/y decline in Chile.
Monthly real GDP proxies for June also arrive during the next two weeks for Brazil (Friday, August 14), Colombia (Friday, August 14), Peru (Monday, August 17), and Argentina (Thursday, August 20). Colombia’s print is a non-event since it arrives at the same time as Q2 GDP, but the others are expected to register continued increases in economic activity from the worst of the lockdowns. Brazil is expected to see real GDP lift from -14% y/y in May to -9.0% in June, while our team in Lima is much more constructive than market consensus and projects a -20% y/y contraction in June (versus -33% y/y consensus), up from -32.85 y/y in May. Despite the re-intensification of lockdown measures in June, we estimate that Argentine economic activity nearly returned to its levels of a year ago, but with two years of recession already under the country’s belt in 2019 this isn’t saying much.
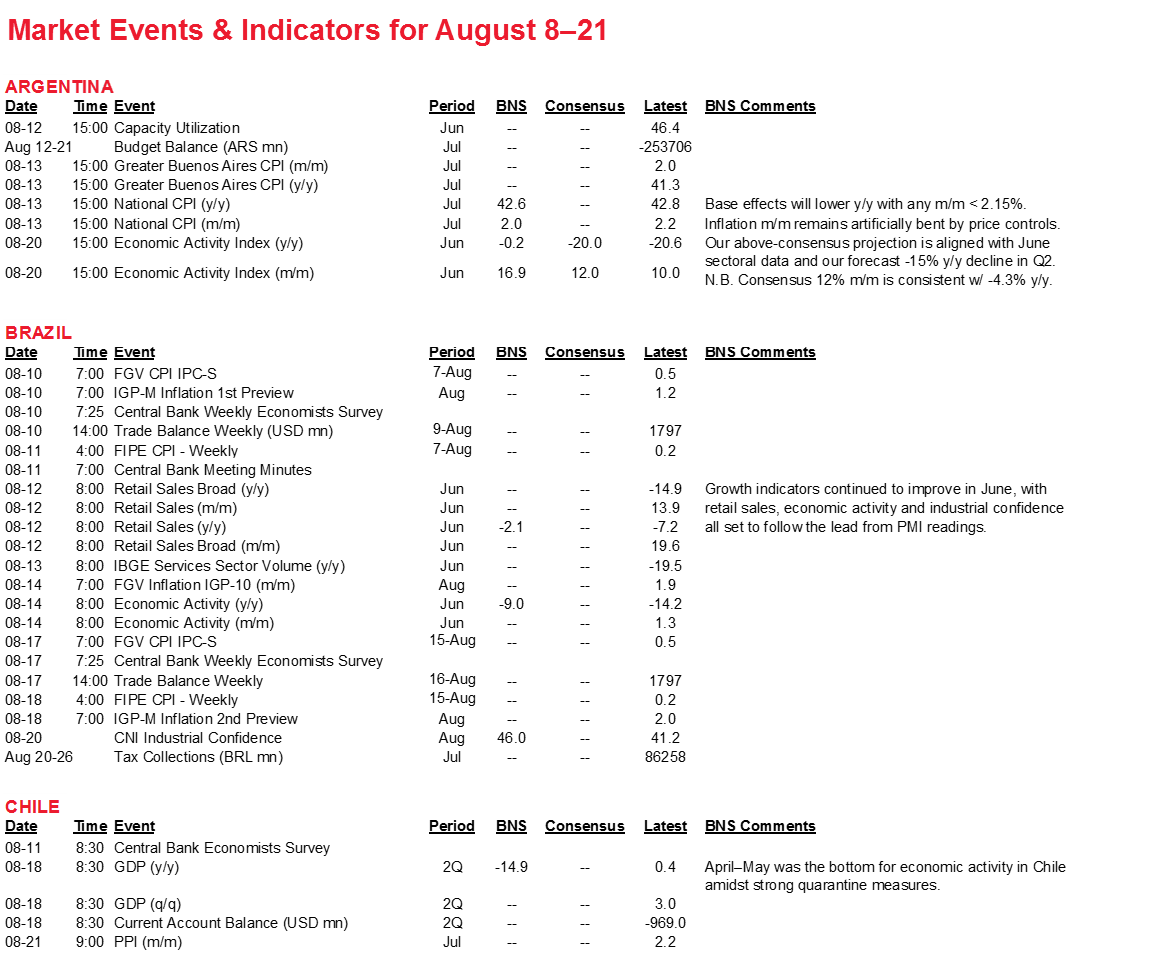
Argentina rounds out our July inflation prints on Thursday, August 13 where our best guess anticipates a 2.00% m/m increase in prices. We say “guess” rather than “projection” given the dampening effect of controls and official monitoring on price pressures. Anything less than 2.15% m/m would ensure level effects keep annual inflation falling from its current low-40% y/y range to our projection of 26.7% y/y at end-2020. With the conclusion of negotiations on a swap of external-law bonds in default and IMF talks set to re-commence in earnest in the coming weeks, an eventual loosening in price, FX, and capital controls would see inflation accelerate again into 2021.
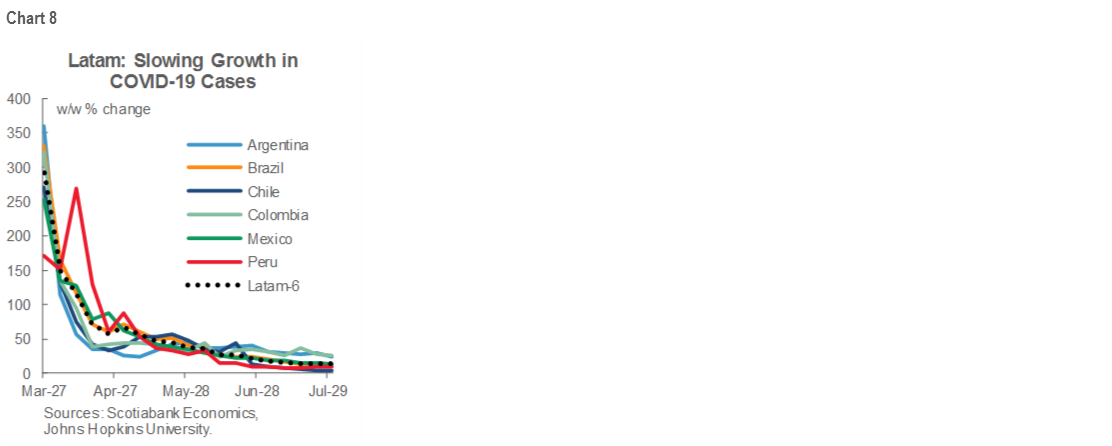
COVID-19: NEW RECORDS
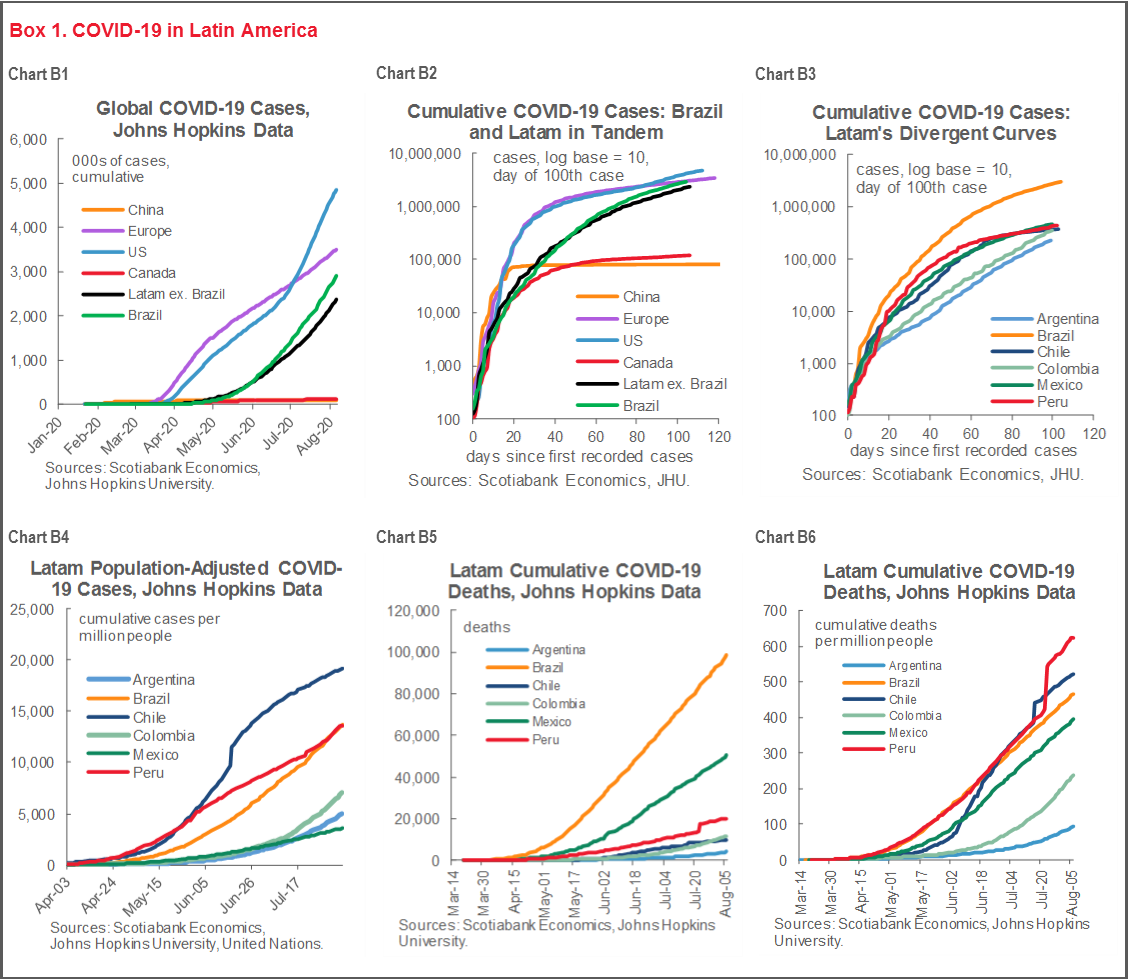
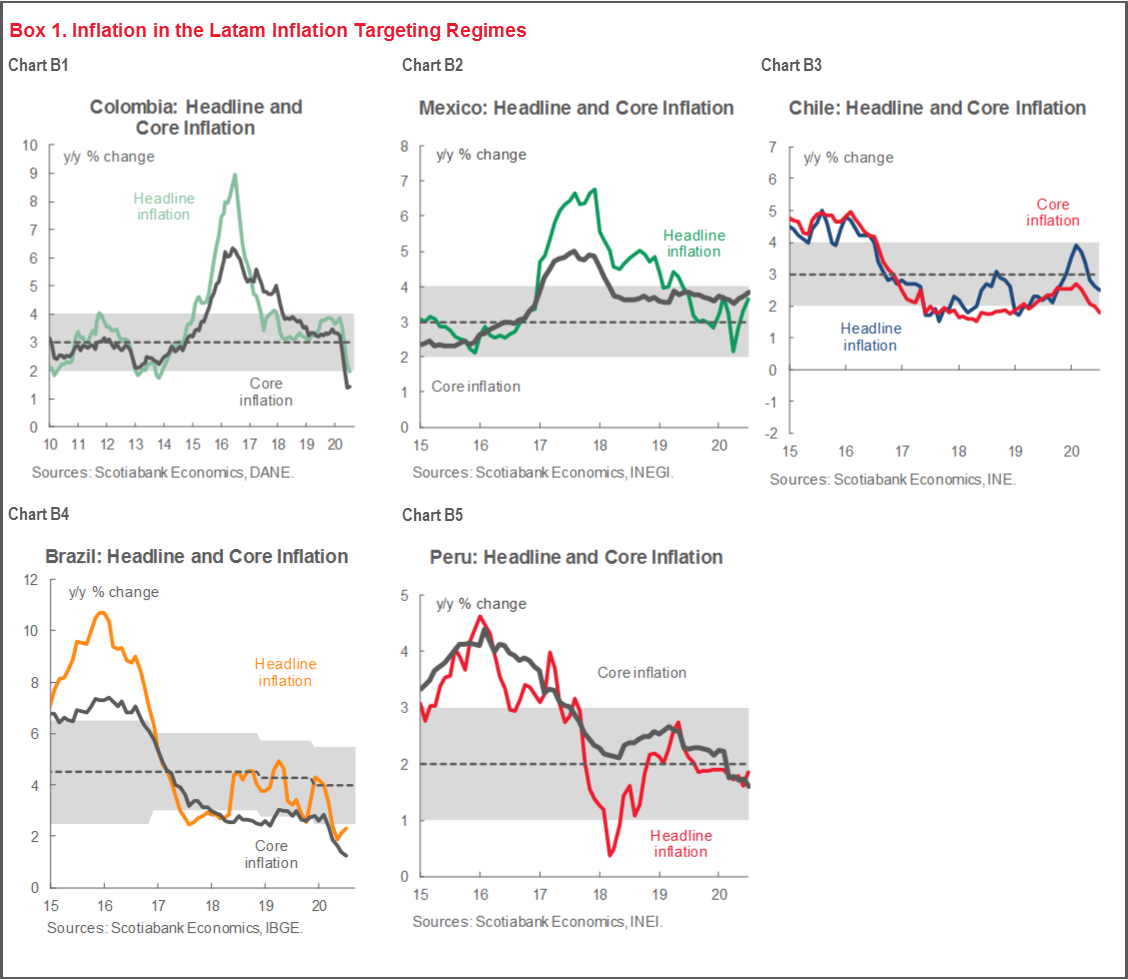
Latam has now recorded more COVID-19 related deaths than the US as contagion rolls on broadly unchanged across most of the region (see box 1) even as growth rates in new cases remain lower than in the early days of the pandemic (chart 8). The US and Latam continue to follow similar COVID-19 trajectories (charts B1 and B2), with Peru exhibiting the only instance of a notably flatter curve in recent weeks (chart B3). Chile’s per capita case numbers still run well above the rest of Latam (chart B4). In the past week, Mexico passed the UK to become the third hardest-hit country in terms of total COVID-19-related deaths (still second-hardest hit in Latam, chart B5) even as Mexico’s President, much like US President Trump, argued over which per capita death metric (chart B6) was the best reference point.
COVID-19 contagion control measures continue to evolve across Latam.
Argentina. Mobility restrictions were tightened in the Buenos Aires region on June 26 in the face of rising COVID-19 cases. Some measures were loosened from July 17 in and around BsAs, with a reassessment due on August 2; in the event, a concentrated increase in new infections in the capital region saw isolation measures extended on July 31 to August 16. The country’s borders remain closed to travel by foreigners until at least September 1.
Brazil. Major cities started easing lockdown measures in June. The country remains a patchwork of state-level moves to re-open, while restrictions have been re-tightened recently in some locations where new positive cases and hospital admissions have risen. Two states (Amazonas and Maranhão) have allowed private schools to re-open; eight additional states and the capital have announced plans to re-open some schools in August and September. Brazil’s borders were opened at the beginning of August for 30 days to foreign visitors arriving by air, but not by land or sea.
Chile. Quarantine and curfew measures continue to be alternately relaxed and tightened across the country’s regions to control local COVID-19 outbreaks. The strictest lockdown measures in Greater Santiago began to be lifted from end-July. A nationwide curfew remains in place and the international borders remain closed to foreigners. The government published its “Paso a Paso” plan for workplace re-opening on August 5.
Colombia. Quarantine measures have been in place since March 25 and are set to last until August 31, with a relaxation of controls in some areas and, more recently, some re-tightening in a few major cities to control new outbreaks. Business re-opening has proceeded gradually since April 27. The country’s borders were closed in May and are set to remain shut until at least end-August.
Mexico. Mexico’s phased re-opening began on June 1 under its “stoplight” system. For August 3 to 16, a total of 16 states are designated red, which allows only essential activities; 16 states, including Mexico City, are in orange status, which limits capacity in public places. Although the land border with the US remains closed, air travel into Mexico remains open to foreigners without any testing or quarantine requirements.
Peru. Peru reached the fourth and final phase of its re-opening plan a month ahead of schedule in early-July. Although there have been some fresh increases in COVID-19 cases in the south of the country, the new Prime Minister Walter Matos on August 7 ruled out a return to extensive lockdowns to control contagion.
As of August 7, the US State Department had issued advisories against travel to all of the Latam-6 except for Chile, where a weaker directive to re-consider travel is in place.
PENSIONS REMAIN IN FOCUS
Changes to pension systems remain a focus of lawmakers seeking to complement fiscal aid with immediate liquidity support to households. Peru’s Congress voted at end-April to allow withdrawals by individuals of up to 25%, up to a maximum of PEN 12,900 (around USD 3,600), of their funds in individual retirement accounts in the private pension system, the AFPs. Opposition lawmakers in Chile’s Congress followed Peru’s lead at end-July with the passage of their more modest “10% law” that allows a maximum withdrawal of about USD 5,400. Mexico’s government brought forward its own pension reforms in late-July, but they were designed to increase retirement savings and extend pension eligibility and coverage, not provide immediate cash-flow relief to households.
Lawmakers in Peru are mounting another charge on the country’s pension system with a move on Thursday, August 6 to bring forward a new initiative that would allow the unemployed to tap all or part of their individual retirement accounts at the AFPs. In contrast with the earlier 25% withdrawal window, people who have retained their jobs would not be able take advantage of this new opening. Our team in Lima sees a solid chance that the initiative will win Congressional approval, but a cap on withdrawals could be added in negotiations, as was the case with the finalization of the earlier 25% law. Peru’s Banking Superintendent (SBS) estimates that withdrawals from the AFPs under the 25% law have amounted to approximately PEN 25 bn or 16.5% of AUM, while the new initiative could facilitate another outflow of up to PEN 20.7 bn or 13.7% of AUM, for a total reduction in AFPs’ AUM of PEN 45.7 bn or 30.2%. The BCRP has a swap line in place to assist the AFPs with withdrawal-induced liquidity needs.
Brazil is also discussing a proposal that would free up roughly 14% of private pension fund assets for immediate household liquidity. Private pension funds are a much small share of the retirement system in Brazil than in other Latam countries and the potential disruption to local financial markets would be much more limited if this proposal were to go ahead.
IMF BALANCE OF PAYMENTS ASSESSMENTS: A MIXED BAG FOR LATAM
In its 2020 External Sector Report (ESR), released on July 28, the IMF estimated that about 40% of countries had current account balances in 2019 that were either in excess deficit or surplus compared with fundamentals. Excess surpluses were broadly concentrated in the Eurozone, while Canada, the UK, and the US were noted as notching up external balances in 2019 that were smaller than fundamentals implied. Notwithstanding trade tensions with the US, China’s external surplus was assessed to be in line with fundamentals.
Three Latam economies—Argentina, Brazil, and Mexico—were deemed systemically important based on their GDPs, trade flows, and international financial integration and received individual assessments of their external positions. While Mexico’s 2019 external position was assessed as broadly in line with medium-term fundamentals, Argentina’s (unsurprisingly) and Brazil’s 2019 external positions were seen as weak against underlying balance-of-payments drivers. The ESR pointed to policy prescriptions—fiscal consolidation, orthodox monetary policies, and structural reforms—that are likely to feature in any new IMF-supported program for Argentina. The ESR discussion on Brazil focused on the need for fiscal consolidation, anchored by the federal spending cap, to boost national and net public saving.
USEFUL REFERENCES
IMF, 2020 External Sector Report: Global Imbalances and the COVID-19 Crisis, July 28, 2020: https://www.imf.org/en/Publications/ESR/Issues/2020/07/28/2020-external-sector-report
IMF, “Policy Responses to COVID-19”, July 31, 2020: https://www.imf.org/en/Topics/imf-and-covid19/Policy-Responses-to-COVID-19
Markets Report: Latam Inflation Monitor
Brett House, VP & Deputy Chief Economist
416.863.7463
Scotiabank Economics
brett.house@scotiabank.com
Tania Escobedo Jacob, Associate Director
212.225.6256 (New York)
Latam Macro Strategy
tania.escobedojacob@scotiabank.com
Inflation data for July in the Pacific Alliance countries were a mixed bag: some prints came with small upside surprises, but downward pressures from widening output gaps should keep prices contained.
Headline inflation numbers in Chile and Brazil have stabilized well below the mid-point of their inflation targets while we attribute recent blips in Colombia and Peru to temporary factors in a softening trend. In Mexico, however, the rise in inflation has been more persistent and driven by higher core prices, which is likely a source of concern for the central bank.
Given the low levels of realized inflation and the widening output gaps in the region, breakeven inflation expectations have continued their downward trend and are, in most cases, below the forecasts of the central bank and the consensus of analysts.
We look at the latest inflation readings and contrast them with market-based inflation expectations, our forecasts, central bank projections, and analysts’ consensus.
BREAKEVENS GENERALLY PRICING WEAKER INFLATION THAN SCOTIABANK ECONOMICS, CENTRAL BANKS, & CONSENSUS
In this report we look at the extent to which market-based expectations of further disinflation in Latam are aligned with or distinct from Scotiabank Economics’ forecasts, central bank projections, and the consensus of analysts’ views. Headline and core annual inflation rates are trending downward across emerging markets (charts 1 and 2, plus box 1). In Latam, breakevens are generally pricing even stronger disinflation than Scotiabank Economics currently forecasts (see Forecast Updates, pp. 2 and 3).
COLOMBIA: BREAKEVENS GIVE BANREP 15 YEARS TO HIT TARGET
Colombia’s July inflation surprised to the upside, coming in at 0% m/m, above market expectations of -0.15% m/m (BBG median) and Scotia’s projection of -0.17% m/m. The annual reading for July was 1.97% y/y while consensus was for a 1.82% y/y print; still, this was a deceleration from the 2.19% y/y observed in June (chart B1). Some of July’s upside surprise was explained by the expiration of subsidies that the government put in place to reduce utility prices during the worst of the pandemic. The withdrawal of these subsidies was localized in two small regions of the country, but this was enough to drive utility prices higher. Other contributors to the increase in inflation were transportation and restaurants. The pressures to the upside were offset by another decrease in food prices, which might remain low for the rest of the year.
Even with the slight surprise in July, Scotiabank Economics anticipates that annual inflation will remain around 1.9% y/y to December 2020, a bit above the central bank forecast of 1.5% y/y, but in line with the median of the consensus of analysts. Twelve months ahead, we think inflation will be at
2.9% y/y, close to the consensus call of 2.83% y/y and a bit higher than the 2.5% y/y that BanRep is anticipating.
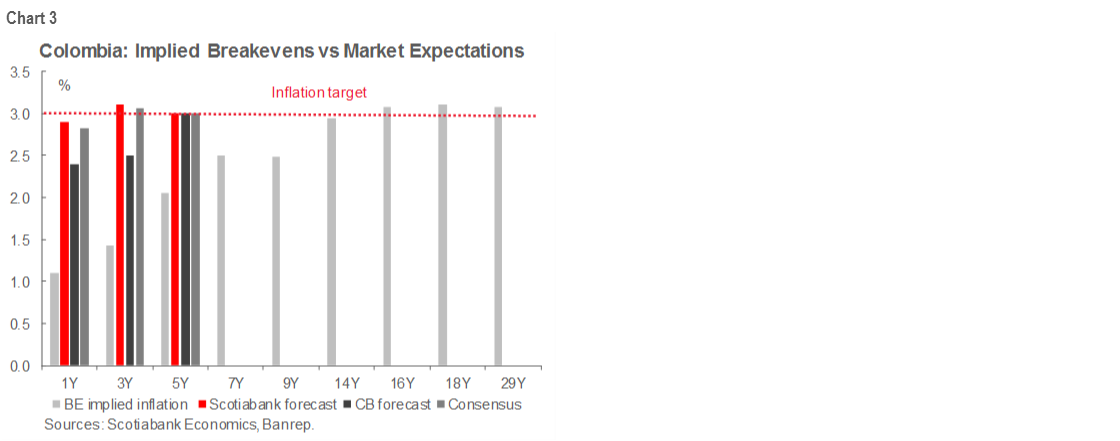
The whole spectrum of forecasts, however, looks high when compared with what is implied in the breakevens, where one-year inflation is at 1.1% y/y and the three-year is at 1.3% y/y (chart 3). Even in the longer tenors, the breakevens do not price a convergence to the 3% target until 2033, which we think is a distortion that should correct as it becomes more evident that inflation is bottoming out.
MEXICO: THE EXCEPTION
In Mexico, the July CPI data validate the view that inflation is firmer here than in other Latin American economies. The annual print was 3.62% y/y, right at consensus, but up from the previous reading of 3.3% y/y (chart B2). Core inflation came in at 3.85% y/y and continues to be the main driver of the rise in the headline reading. In July, food and merchandise prices advanced 6.89% y/y, thereby adding the biggest contribution in the basket, which might start to become a greater concern to the central bank. Meanwhile, the prices of goods (excl. food) increased 3.38% y/y, followed by services which were up 2.4% y/y. The fact that the trend higher is being fueled increases in the core components (which are usually more persistent than non-core prices) underpins the view from Scotia Economics’ CDMX team that Banxico will take a break from monetary easing after a -25 bps August cut. In contrast, our strategy desk expects a -50 bps cut at the August meeting, but sees a high probability of a dissenter voting for a smaller cut of -25 bps. A tweak in the Banxico Board’s communications could signal that the easing cycle may slow or even pause, depending on the evolution of inflation and financial variables (MXN).
For December 2020, Scotia Economics is expecting annual inflation to hit 3.7% y/y, above analysts’ consensus of 3.4% y/y and Banxico’s forecast of 3.5% y/y (chart 4). For the same period, the breakeven inflation rate is 4.24% y/y, which looks too high on the basis of our macro modelling. From there, the pace of inflation implied by market-determined real rates is stable around 3.4%–3.5% y/y for the belly of the curve and up to 15 years; beyond that, it goes closer to 4% y/y in the longer maturities (i.e., Mudi46, Mudi50). Pricing, excluding the distortion in the one-year node which is too high for us, seems fair along the curve at this point and we think that most market activity might concentrate in relative value trades.
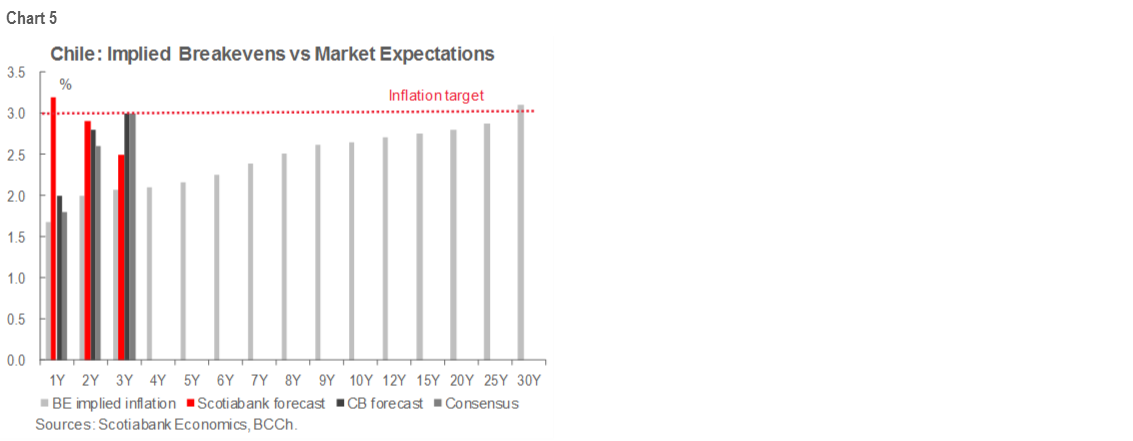
CHILE: BREAKEVENS IMPLY DE-ANCHORED INFLATION EXPECTATIONS ACROSS THE CURVE
Chile’s CPI inflation was 2.5% y/y in July, in line with expectations and stable relative to the previous reading of 2.6% y/y (chart B3). As in June, the food component was the largest contributor to the headline print, which points to pressure coming from the change in consumption patterns during the pandemic.
Our Scotiabank Economics expects headline inflation to come down to 2.2% y/y by end-2020, before rising gradually through 2021 as higher fuel prices and increased demand fueled by pension withdrawals give some lift to prices. There is a chance that the economy might contract less than our current expectation of -6% y/y in 2020 and that market and central bank are underestimating the possible boost from the “10% law”.
Even with Scotiabank Economics’ expected slowing in annual headline inflation into end-2020, our house forecasts are above analysts’ consensus (chart 5). Where our economics team in Santiago expects 2.2% y/y inflation at year-end, breakevens imply 1.6% y/y. Twelve months ahead, Scotia Economics forecasts headline inflation at 3.2% y/y, above the analysts’ consensus of 1.8% y/y and the central bank forecast of 2% y/y. For the same period, breakeven inflation is at 1.68% y/y. 18-months from now, our economics team anticipates stable inflation near 3% y/y, while the central bank has pencilled in a pickup to 2.8% y/y and the consensus of analysts converges to 2.6% y/y; breakeven inflation for 18 months out is 2% y/y, which looks overly pessimistic to us at this stage. In fact, breakeven pricing is so pessimistic that it implies that inflation expectations have become de-anchored across nearly the entire curve. There is value in long positions in the short end of the breakevens.
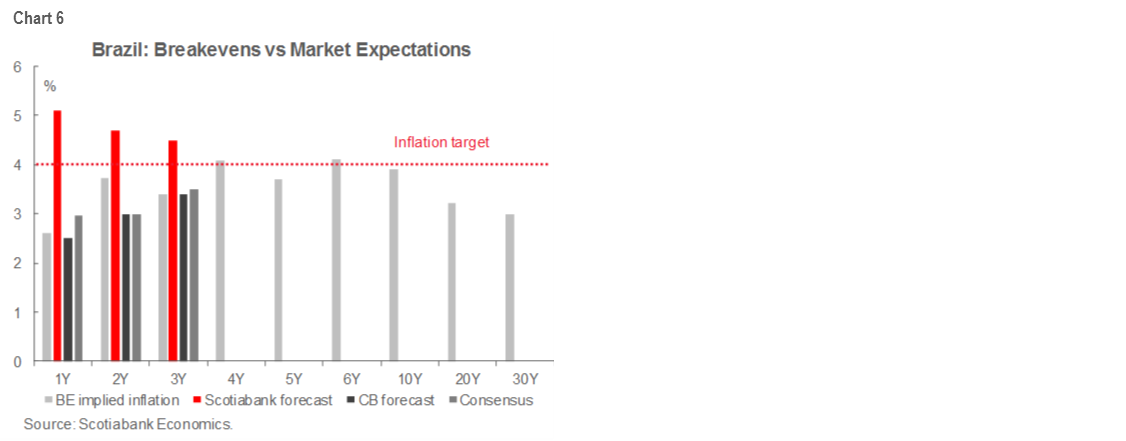
BRAZIL: WE’RE THE HAWKS
Inflation in Brazil was 2.31% y/y in July, right at expectations and up a little from the 2.13% y/y recorded in June (chart B4). The monthly increase of 0.4% m/m was explained mainly by higher transportation, housing, utilities and healthcare prices. Those pressures were offset by weakness in sectors such as clothing as department stores tried to get rid of inventory. We expect increases in fuel and utilities prices to be counterbalanced by weakness in consumer demand, which might persist for longer if the labour market does not start to show more signs of recovery soon.
For year-end, however, our hawkish Brazil economist anticipates inflation at 4.5% y/y, well above the central bank forecast of 2.5% y/y, analysts’ consensus of 2.97% y/y, and breakeven expectations of 2.55% y/y. The rationale for Scotia Economics’ forecasts rests on what has been in the past a high degree of pass-through from moves in the BRL (20%–30%); a public finance outlook that is deteriorating, which has sparked inflation in the past; extremely easy monetary conditions; and an expectation that prices will remain sticky despite the widening output gap. Relative to our Brazil economist’s forecasts, there are good opportunities to add exposure to breakevens in the short end of the curve.
PERU: MOST DOWNBEAT CENTRAL BANK
In Peru, July inflation was on the higher end of expectations at 0.46% m/m versus consensus of -0.08% m/m and June’s -0.27% m/m. This brought yearly inflation up to 1.9% y/y (chart B5), higher than the 1.6% y/y seen in June, which contrasted with the decline to 1.4% that we expected. Despite the surprise, our economics team in Lima thinks inflation should return to its downward trajectory in the coming months given that the price increases seen in July are well identified as one-offs (chicken prices, for example, increased as restaurants re-opened). Scotia Economics expects inflation to close the year near 1.1% y/y rather than the BCRP’s expectation of 0% y/y for 2020.
COUNTRY UPDATES
Argentina—Next Stop, Foggy Bottom
Brett House, VP & Deputy Chief Economist
416.863.7463
brett.house@scotiabank.com
With the Ministry of Economy’s announcement on August 4 that it had reached agreement with three major creditor groups on the terms for a swap of up to USD 65 bn of external-law bonds in default, Argentina turned a major corner by closing a nearly four-month negotiation process. The terms agreed are very similar to those of the government’s fourth and “final” proposal circulated on July 5, with the only major difference being a somewhat more accelerated payment schedule. The new debt-service profile for the bonds that will come out of the pending swap permits a win-win outcome: the authorities and creditors met at the halfway point of the gap between their negotiating positions, which gave the bondholders a win in NPV terms without increasing the authorities’ nominal payments. The swap is due to be executed on September 3 and, with Tuesday’s statement of support from large creditors, the authorities should have no trouble reaching the minimum participation thresholds they have set for themselves. Informal discussions on a new IMF-supported adjustment program are likely to begin imminently. Negotiations won’t be easy as Argentina navigates through the pandemic and faces the need for major structural reforms.
Taking stock of recent economic developments, we saw more signs over the last two weeks that Argentina’s economy has passed its pandemic bottom, but remains impaired. Industrial production and construction, which together account for a quarter of GDP, continued to recover from the nadir of the lockdown in April–May. IP was down “only” -6.6% y/y in June, while construction was off -14.8% y/y. But comparisons with 2019 set a low bar as it was the second year of Argentina’s three-year recession. Early July data, however, point to more gains, with vehicle production down only -1.5 y/y from June 2019. July also saw a fifth straight month of nominal increases in central government tax collections, but tax revenue as a share of GDP remains on a downward trend (chart), which presents a challenge for fiscal consolidation under an eventual IMF program.
The next fortnight in macro indicators is dominated by two main prints: the July inflation numbers and the June real GDP proxy.
· July inflation. Projecting monthly inflation remains a bit of a crap shoot as price controls continue to dampen a range of price increases. The government continues to dictate utility price changes and is monitoring thousands of other prices in an effort to discourage increases. At the same time, external capital and exchange controls are still artificially limiting pass-through effects from depreciations in the ARS to local prices. Both sets of controls are likely to be lifted after the external debt swap goes through and agreement on an IMF program is reached, which should see a release of a lot of pent-up price pressure. But, for now, we have pencilled in an estimate of a 2% m/m increase in prices in July, midway between the heavily controlled 1.5% m/m increases in April–May and the more realistic 2.5% m/m notched up in June. Given some strong base effects from last year’s price surge, any monthly print below 2.15% m/m would see the year-on-year increase continue its decline from the 57.3% y/y cycle high in May 2019. Our 2.00% m/m projection translates into 42.8% y/y. We continue to expect headline annual inflation to fall to 26.7% y/y even with a pick-up later in the year in sequential monthly prints.
· June real economic activity. Based on the hand-off from May and June data received so far, we expect a roughly 17% m/m gain in real economic activity in June, which would put the month’s level of activity only -0.2% y/y below real GDP in June 2019. If this comes to fruition, it shouldn’t be cause for much celebration as real economic activity would still be on par with levels seen a decade ago. Bloomberg’s consensus numbers, based on a sample of three analysts, anticipate a 12% m/m gain, which would translate into a level -4.3% y/y below that of June 2019, but the consensus is showing an inconsistent -20% y/y decline.

Brazil—Global Liquidity Wave Should Allow BCB to Deliver Final -25 bps Cut to End Cycle
Eduardo Suárez, VP, Latin America Economics
52.55.9179.5174 (Mexico)
esuarezm@scotiabank.com.mx
At its August 5 meeting, the BCB’s Copom decided to cut the Selic by -25 bps to 2.00% and left the window open for additional marginal tweaking of policy settings, but with a cautious tone. The odds of the easing cycle being over are heavily dependent on fiscal risks and, as the BCB has repeatedly stressed, rising risk premia could limit their capacity to cut rates. With this in mind, we think the tidal wave of liquidity that has been pumped into global markets will keep risk premia in check and facilitate a further cut.
Looking at the spread between 10yr BRL government bonds versus the 10yr UST, the difference between the two yields should primarily be explained by perceived FX/inflation risk and Brazilian credit risks given that these bonds are both the same term, USTs are risk-free, and the liquidity premium tends to be smaller than those two other components. As the chart shows, the Brazil-US spread has been consistently falling and does not seem to be responding to the BCB’s cuts in an adverse way—at least for now. Hence, expectations about Brazilian credit risk and FX/inflation premiums seem to be anchored for the moment. With this in mind, we are sticking with our call that the BCB will deliver one final -25 bps cut to the Selic in its next meeting before calling it quits on this easing cycle.
Brazil seems to have fallen into the regional trend of allowing individuals to tap into their pension savings to face the COVID-19 pandemic’s costs. The Brazilian proposal under discussion would free up roughly 14% of private pension fund assets. Assets under management by the affected funds total around USD 25 bn, in contrast with the nearly USD 200 bn in the pension system as a whole. Those who have contributed for at least 3 years would be permitted to tap 20% of their savings once every two years. Given the small size of the Brazilian funds relative to Chile’s or Peru’s the potential disruption of local financial markets is much smaller.

Chile—June Economic Activity Surprised on the Upside
Jorge Selaive, Chief Economist, Chile
56.2.2939.1092 (Chile)
jorge.selaive@scotiabank.cl
Carlos Muñoz, Senior Economist
56.2.2619.6848 (Chile)
carlos.munoz@scotiabank.cl
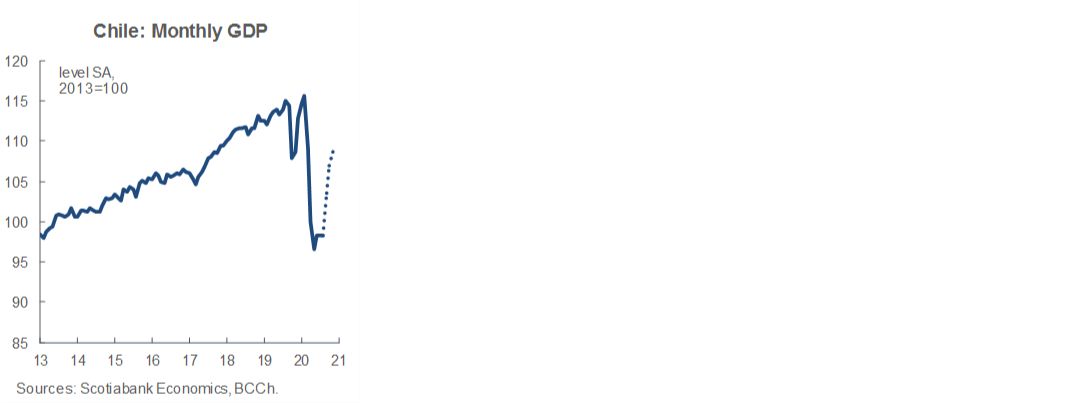
After a string of disappointing data, finally some good news. June’s IMACEC GDP proxy, published on August 3, showed a contraction of -12.4% y/y (consensus: -15% y/y), with a seasonally adjusted expansion of 1.7% m/m from May. The June economic activity numbers mean that Q2 GDP likely saw a contraction of -14.9% y/y, or -43% q/q saar. This implies that April–May was the bottom for economic activity in Chile amidst strong quarantine measures. Due to some short-term transitory factors and better-than-expected monthly activity numbers, the contraction in aggregated GDP in 2020 should be at the better end of the -5.5% y/y to -7.5% y/y range forecast by the central bank. In fact, we see 2020 growth coming in very close to our existing baseline projection of a -6% y/y contraction, which we maintain with a positive bias.
Chile’s central bank announced on July 30 that it would implement specific measures to mitigate market volatility that could develop as the country’s pension funds liquidate assets in response to early withdrawals from individual retirement accounts under the new “10% law”. These actions include:
1. Repos for bank bonds under a total program of up to USD 10 bn on one- to three-month terms;
2. Continuation of the bank bond purchase window for the remaining USD 4.1 bn from the March program, to contain volatility; and
3. Adding a term deposit purchase window for up to USD 8 bn.
On Friday, August 7, CPI data for July was released, showing a monthly inflation of 0.1% m/m. This print surprised market forwards and supports our forecasts for the second half of 2020. Annual inflation reached 2.5% y/y in July, with goods increasing 2.4% y/y and services up 1.4% y/y. As in June, the food and non-alcoholic beverages segment contributed the most to inflation for the month, adding 0.12 ppts. Within this segment, the rise of bread, beef, and bananas prices stand out, reflecting pressures on basic necessities, which is consistent with our high-frequency transactions data that show dynamism in supermarket sales. For December, we maintain our annual inflation forecast of 2.2% y/y as the economy starts to re-open and people start spending the withdrawal of their pension funds.
There are no tier-1 indicators coming out in the next two weeks beside the national accounts for Q2-2020 on Tuesday, August 18. We anticipate a contraction of GDP of -14.9% y/y during the second quarter, as most of the economy was under confinement during that period. We expect the government to provide more details about the re-opening process in the coming days. During the last week of July, some parts of Gran Santiago, including the financial district, started the transition phase (2nd phase out of five phases of re-opening). Next week, more municipalities will be added to the transition phase, as parts of the country start to catch up with some regions in the south of Chile that are currently in the initial opening phase (4th phase), with cafes, restaurants and cinemas operating under capacity restrictions. In addition, next week the withdrawal of pension funds will materialize as pension fund managers start to transfer money to their fund participants. Early estimates indicate that around 80% of participants have requested their possible 10% withdrawal. For July, we anticipate a drop in monthly GDP of between -11% y/y and -13% y/y. If this is realized, it would confirm that aggregate GDP in 2020 is on the way to an even better performance than the -6% y/y contraction forecast in our baseline scenario.
Colombia—The Central Bank Downgrades Its Macro Scenario
Sergio Olarte, Head Economist, Colombia
57.1.745.6300 (Colombia)
sergio.olarte@co.scotiabank.com
Jackeline Piraján, Economist
57.1.745.6300 (Colombia)
jackeline.pirajan@co.scotiabank.com
The macroeconomic outlook has worsened in Colombia as lockdown measures have been strengthened again by some local governments owing to concerns regarding health system capacity. New local lockdown measures impose greater uncertainty regarding what’s next for the re-opening process as permanent economic activity losses increase over time. In this environment, BanRep updated its macroeconomic scenario for 2020 and 2021, emphasizing that uncertainty remains high and that risks are biased to the negative side.
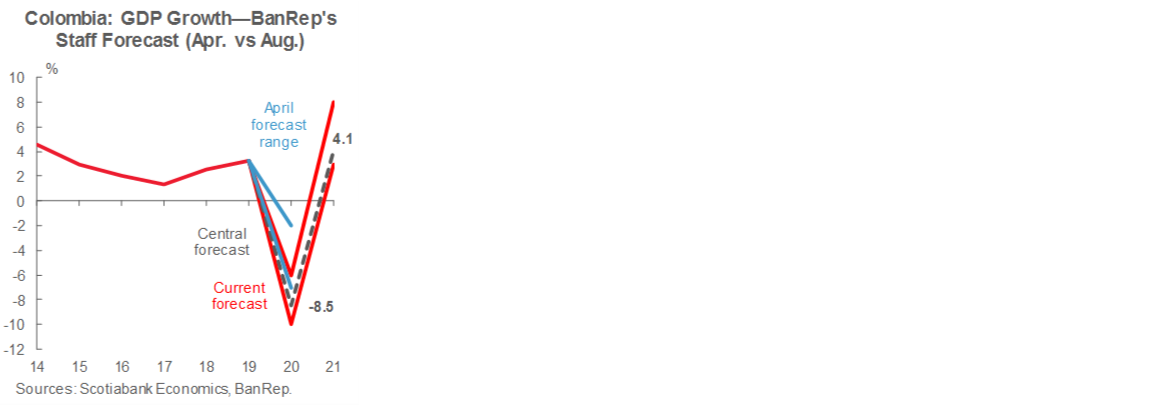
The central bank expects a record GDP contraction in 2020 of around -8.5% y/y contained in a range between -10% y/y and -6% y/y, much worse than the previously expected range of -2% y/y to 7% y/y. The negative revision came as the second COVID-19 wave imposes a challenging scenario for trade partners and the huge deterioration in the labour market implies a drag on domestic demand. What is even more concerning is that the GDP recovery for 2021 would be relatively weak at 4.1% y/y (in a range between 3% y/y and 8% y/y), which means that Colombia would end 2021 with economic activity equivalent to 2017’s GDP. In fact, potential GDP is expected to contract -2.6% y/y in 2020 and expand 1.6% y/y in 2021. Although the output gap will narrow in 2021, it will take a long time before Colombia can recover the economic losses from the pandemic.
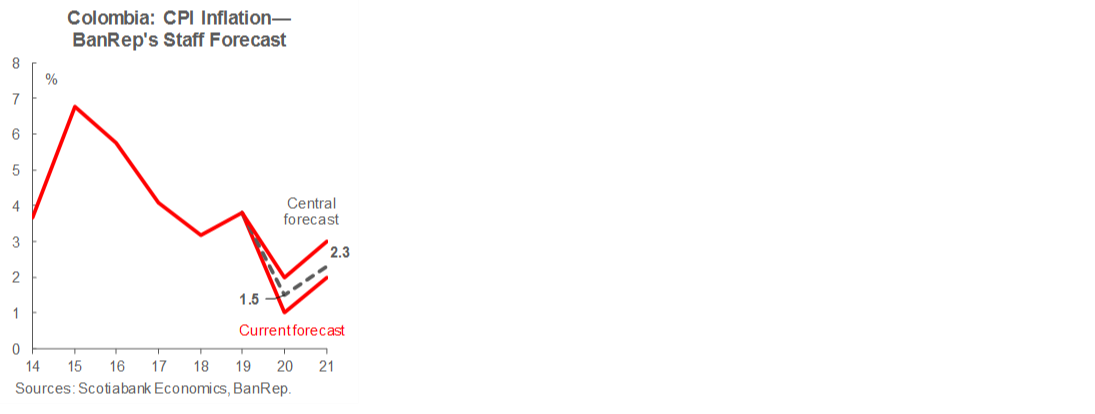
On the inflation side, BanRep’s staff emphasized that the deceleration in inflation is partially explained by governmental aid in some regulated prices. For 2020, inflation is expected to close between 1% y/y and 2% y/y with a specific forecast at 1.5% y/y, but in 2021 it would rebound to 2.3% y/y (2%–3% y/y range) as government aid expires, although it would remain below the central bank 3% target on the back of weak economic activity. It is worth noting that this week’s July CPI inflation surprised market consensus to the upside and stood at a flat figure (0% m/m), taking the headline rate to 1.97% y/y. July’s CPI inflation showed the effects of the end of government aid for utilities in some small cities. In August, we expect a more robust rebound in monthly inflation, but the yearly figure is expected to start rising only in 2021.
BanRep’s real rate forecast remained at 1.4% in 2020 and 1.5% for 2021, as increased credit risks in Colombia offset the reduction in international interest rates. Having said that, current monetary policy is expansive and will remain so in 2021. In nominal terms, we expect the easing cycle to end at 2% at the August 31 meeting, although further cuts are not discounted if the macro scenario worsens.
All in all, the central bank staff has a macro scenario with moderate inflation pick-up in 2021, which would limit the easing cycle to rates comparable with other Pacific Alliance countries, although the BanRep is clear that risks remain tilted to the downside.
In macro data, Colombia will have a heavy calendar in the next two weeks. DANE will release June’s coincident indicators, but Q2-2020 GDP will be in the spotlight: we expect a historic -15.2% y/y contraction with service sectors hit the hardest. However, we think that the worst has passed in the Q2 and now the key questions are about the speed of the recovery.
Mexico—Have We Passed the Bottom?
Mario Correa, Economic Research Director
52.55.5123.2683 (Mexico)
mcorrea@scotiacb.com.mx
This past week, a combination of economic indicators revealed both the depth of the economic disruption produced by the health crisis due to COVID-19, but also some signs of improvement in some June and July figures that suggest that April and May were the bottom of the fall and the Mexican economy could be on its way to recovery. We should note, however, that the pace and strength of this recovery is highly uncertain and subject to many relevant risks.
Starting with the positive news, the production of light vehicles rebounded 23.4% m/m between June and July, reaching a positive y/y real growth rate in July of 0.7%. Vehicle exports grew 30.6% m/m in July but remain -5.5% y/y down from the level of a year ago. Retail sales increased 16% on a monthly basis but were 31% lower than in July of 2019.
Perhaps one of the brightest spots of green in the economy is the rapid recovery of non-oil exports that surged 85.6% m/m in June after a dismal result in May, totaling USD 31.8 bn (versus 17.1 bn in May), recovering a large share of the ground lost in the lockdowns. There is still some climbing to do, but as long as the US economy keeps up its current pace of growth, exports will be one of the key engines for the Mexican economy. The trade balance presented a strong and unusual surplus of USD 5.5 bn in June, with total exports contracting -12.8% y/y and total imports plummeting -22.2% y/y.
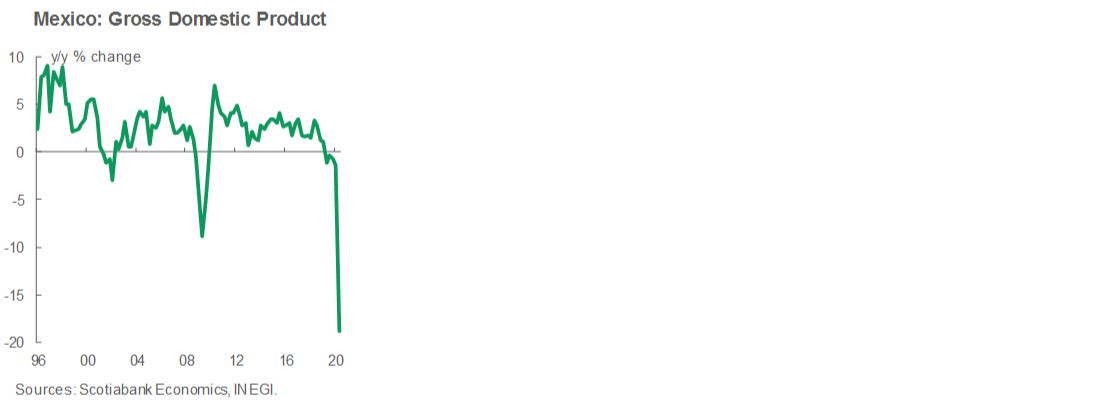
On the other side of the coin, the real gross domestic product (GDP) presented the sharpest contraction on record in Q2, falling -18.9% y/y, as the most intense impact from health measures was felt. Primary activities were the least affected, contracting -0.7% y/y; while industrial activity was the most impacted, falling -26.0% y/y; and finally, the services sector, which sank -15.6% y/y.
The main components of aggregate demand showed dramatic results in May. Private internal consumption fell -24.8% y/y, the deepest drop on record by far; while investment nosedived -39.7% y/y. In sharp contrast with non-oil exports, private consumption and investment are expected to struggle much more in the months to come.
The unemployment rate jumped to 5.5% in June from 4.2% in May, as people returned to the labour market after isolation measures were eased. The participation rate climbed to 53.1% from 47.4% in May, while labour informality rose to 53.0% from 51.8%.
Public finances posted a deficit of MXN 293 bn in the first half of 2020, 137% higher than a year ago, as a consequence of a significant contraction in total revenues (-3.7% y/y) and a mild increase in total net spending
(2.1% y/y). Consequently, the primary surplus was significantly lower, falling -73.9% y/y in real terms. Weaker numbers are expected in the second half of the year as revenues are set suffer as a result of slower economic activity.
Financial activity slowed in June, with deposits growing 8.6% real y/y (versus 10.6% in May) and credit to the private sector increasing 2.8% real y/y (versus 5.2% in May). It seems precautionary efforts to draw on existing and new credit facilities at the outset of the crisis have run their course.
In the latest survey conducted by Banco de Mexico among private sector economists, the GDP forecast for 2020 worsened once again: the average projection for the 2020 GDP growth rate dropped from -8.97% y/y to -10.02% y/y. In contrast, the average forecast for 2021 changed only slightly from 2.79% y/y to 2.88% y/y. Average forecasts for headline and core inflation at end-2020 rose from 3.31% y/y to 3.64% y/y and from 3.50% y/y to 3.72% y/y, respectively. For end-2021, the average headline inflation forecast remained almost unchanged, ticking up slightly from 3.55% y/y to 3.56% y/y, but core inflation moved from 3.42% y/y to 3.38% y/y. The average USDMXN projection for end-2020 improved from 22.78 to 22.69; for end-2021, the average exchange-rate projection strengthened slightly from USDMXN 22.78 to 22.68.
June remittances data printed a new record for any month of June at USD 3.5 bn, totaling 19.1 bn in the first half of the year. These prints represented year-on-year increases of 11.1% in June and 10.6% in H1-2020. Remittances have remained high following their surge at the beginning of the pandemic-induced lockdowns. This may reflect both job gains in the US as the economy begins to recover as well as precautionary moves by Mexican expats who may be transferring both some savings and larger fractions of their incomes in anticipation of a possible worsening in the Mexican economy.
Inflation came in as expected in July, at 0.66% for the general index and 0.40% for the core component, producing y/y increases of 3.62% and 3.85%, respectively—in both cases up from the previous month of June, but with the core at its highest in the last 13 months despite the huge widening of the output gap. It is worth noting that monthly inflation was the highest against any other July since 1999.
Over the next weeks, we have a scant calendar for economic indicators and events, starting with industrial activity figures for the month of June on August 11, which will let us know how the re-opening transpired in the different branches of industry. On August 21st, retail sales for the month of June will be released.
On August 13th, Banco de Mexico will make the next monetary policy decision, which we anticipate will be a further cut in its reference interest rate, but of only -25 bps. The key question for the central bank’s board would be whether the benefits of easing outweigh the risks, especially now that inflation is going up despite the huge widening of the output gap. In this framework, a more prudent approach should prevail. Nevertheless, a cut of -50 bps is also possible.
Peru—Our new GDP Forecast for 2020 is -11.5% y/y, Amidst Mixed Rebound Data
Guillermo Arbe, Head of Economic Research
51.1.211.6052 (Peru)
guillermo.arbe@scotiabank.com.pe
A lot has taken place in the past two weeks. A new Cabinet was appointed only to be then sent packing by Congress and replaced by another, very similar one—all in three weeks. A second wave of COVID-19 has also appeared after the quarantine was lifted across much of the country.
We have also made moderate changes to our forecasts. For 2020 we now forecast an -11.5% y/y contraction in real GDP. We had previously maintained a forecast range from -9% y/y (when seen from the demand components) to -14% y/y (when viewed from the supply side). Two things have happened to narrow our outlook to a point forecast. First, the release of GDP results for April (-40.5% y/y) and May (-32.8% y/y) imply that demand is weaker than we were expecting. Much of the blame, in terms of demand, is the sharp contraction in public-sector investment, down over -70% y/y in April–May, and still disappointing at nearly -50% y/y in June. Low fiscal spending explains the reduction in our fiscal deficit forecast for 2020 from -9.0% to -8.6% of GDP. On the other hand, the government accelerated the unlocking of the economy, improving the picture from the supply side. Our new -11.5% y/y real GDP growth forecast takes into account a convergence of both sides of the equation.
Barring an improbable new lockdown, there are promising signs that the worst may be over for the economy. Electricity demand is currently trending at only 4% below 2019 levels in early August. June witnessed a healthy rebound in mining output. While output was still lower in y/y terms for most metals, it was sharply higher in m/m terms. Compared to May, all metals output was up in June by at least double-digit, and frequently triple-digit, figures. A key case in point was copper, down -9% y/y in June, but up 40.8% m/m versus May. Zinc and molybdenum rose on y/y terms, as well as on m/m terms, with zinc more than quadrupling output in June over May. We expect GDP in Q3-2020 to be 35% greater than in Q2-2020 as most of the economy has already been unlocked, although activities will return gradually, in line with the demand of each individual market.
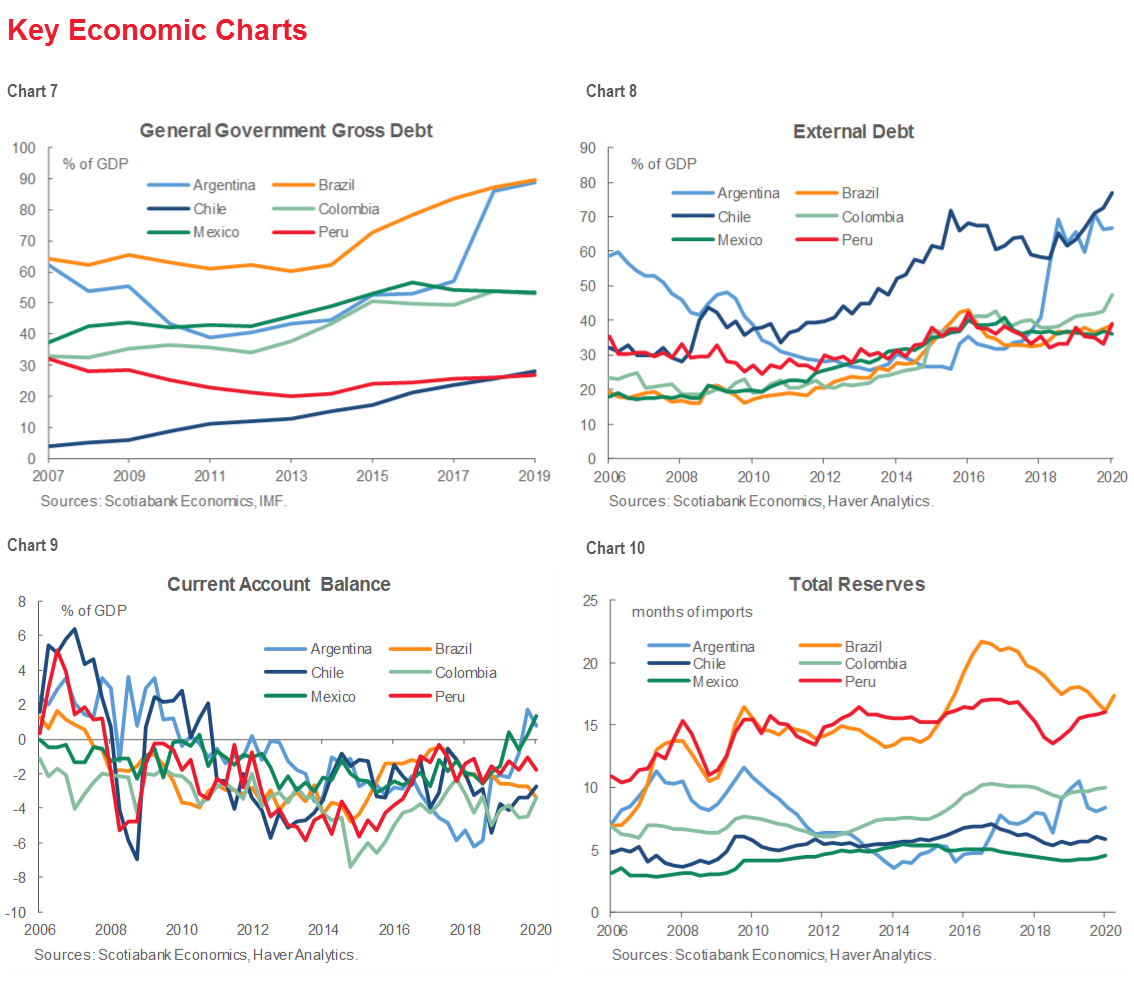
For 2021 we are forecasting 8.7% y/y GDP growth. This is, of course, mostly just rebound, and is fraught with uncertainty. Much will depend on when and how a vaccine is made available, and how the Presidential and Congressional elections evolve. One important, and unexpected, positive is the strong improvement in terms of trade. Precious metals prices have soared, and industrial metals have remained robust. Hopefully, this will provide the business community with a boost in confidence while also giving the government more breathing room in terms of fiscal policy in 2021. Furthermore, our forecast of a USD 5.3 bn trade surplus for 2020 along with a record USD 75 bn in net international reserves at present provide medium-term fundamental support to the PEN.

| LOCAL MARKET COVERAGE | |
| CHILE | |
| Website: | Click here to be redirected |
| Subscribe: | carlos.munoz@scotiabank.cl |
| Coverage: | Spanish and English |
| COLOMBIA | |
| Website: | Forthcoming |
| Subscribe: | pirajaj@colptria.com |
| Coverage: | Spanish and English |
| MEXICO | |
| Website: | Click here to be redirected |
| Subscribe: | estudeco@scotiacb.com.mx |
| Coverage: | Spanish |
| PERU | |
| Website: | Click here to be redirected |
| Subscribe: | siee@scotiabank.com.pe |
| Coverage: | Spanish |
| COSTA RICA | |
| Website: | Click here to be redirected |
| Subscribe: | estudios.economicos@scotiabank.com |
| Coverage: | Spanish |
DISCLAIMER
This report has been prepared by Scotiabank Economics as a resource for the clients of Scotiabank. Opinions, estimates and projections contained herein are our own as of the date hereof and are subject to change without notice. The information and opinions contained herein have been compiled or arrived at from sources believed reliable but no representation or warranty, express or implied, is made as to their accuracy or completeness. Neither Scotiabank nor any of its officers, directors, partners, employees or affiliates accepts any liability whatsoever for any direct or consequential loss arising from any use of this report or its contents.
These reports are provided to you for informational purposes only. This report is not, and is not constructed as, an offer to sell or solicitation of any offer to buy any financial instrument, nor shall this report be construed as an opinion as to whether you should enter into any swap or trading strategy involving a swap or any other transaction. The information contained in this report is not intended to be, and does not constitute, a recommendation of a swap or trading strategy involving a swap within the meaning of U.S. Commodity Futures Trading Commission Regulation 23.434 and Appendix A thereto. This material is not intended to be individually tailored to your needs or characteristics and should not be viewed as a “call to action” or suggestion that you enter into a swap or trading strategy involving a swap or any other transaction. Scotiabank may engage in transactions in a manner inconsistent with the views discussed this report and may have positions, or be in the process of acquiring or disposing of positions, referred to in this report.
Scotiabank, its affiliates and any of their respective officers, directors and employees may from time to time take positions in currencies, act as managers, co-managers or underwriters of a public offering or act as principals or agents, deal in, own or act as market makers or advisors, brokers or commercial and/or investment bankers in relation to securities or related derivatives. As a result of these actions, Scotiabank may receive remuneration. All Scotiabank products and services are subject to the terms of applicable agreements and local regulations. Officers, directors and employees of Scotiabank and its affiliates may serve as directors of corporations.
Any securities discussed in this report may not be suitable for all investors. Scotiabank recommends that investors independently evaluate any issuer and security discussed in this report, and consult with any advisors they deem necessary prior to making any investment.
This report and all information, opinions and conclusions contained in it are protected by copyright. This information may not be reproduced without the prior express written consent of Scotiabank.
™ Trademark of The Bank of Nova Scotia. Used under license, where applicable.
Scotiabank, together with “Global Banking and Markets”, is a marketing name for the global corporate and investment banking and capital markets businesses of The Bank of Nova Scotia and certain of its affiliates in the countries where they operate, including, Scotiabanc Inc.; Citadel Hill Advisors L.L.C.; The Bank of Nova Scotia Trust Company of New York; Scotiabank Europe plc; Scotiabank (Ireland) Limited; Scotiabank Inverlat S.A., Institución de Banca Múltiple, Scotia Inverlat Casa de Bolsa S.A. de C.V., Scotia Inverlat Derivados S.A. de C.V. – all members of the Scotiabank group and authorized users of the Scotiabank mark. The Bank of Nova Scotia is incorporated in Canada with limited liability and is authorised and regulated by the Office of the Superintendent of Financial Institutions Canada. The Bank of Nova Scotia is authorised by the UK Prudential Regulation Authority and is subject to regulation by the UK Financial Conduct Authority and limited regulation by the UK Prudential Regulation Authority. Details about the extent of The Bank of Nova Scotia's regulation by the UK Prudential Regulation Authority are available from us on request. Scotiabank Europe plc is authorised by the UK Prudential Regulation Authority and regulated by the UK Financial Conduct Authority and the UK Prudential Regulation Authority.
Scotiabank Inverlat, S.A., Scotia Inverlat Casa de Bolsa, S.A. de C.V., and Scotia Derivados, S.A. de C.V., are each authorized and regulated by the Mexican financial authorities.
Not all products and services are offered in all jurisdictions. Services described are available in jurisdictions where permitted by law.