

HIGHLIGHTS
- It’s a quieter week in Latam and the globe on the economic front, as markets look liable to maintain their focus on AI/tech-related sentiment.
- Mid-month Mexican and Brazilian CPI, Q3 GDP details out of Mexico and Peru, and Banxico’s quarterly report are the data highlights in Latam, while global markets will focus on U.S. PCE inflation data and PMIs from around the world.
- In today’s report, our economists in Mexico cover the latest industry-level data ahead of INEGI’s revision to Q3 GDP figures that will provide greater sectoral details.
- The team in Chile dig into the third quarter’s 1.1% y/y contraction, with an expectation that growth will significantly recover next year on the back of strong investment growth.
Chart of the Week
MEXICO AND BRAZIL CPI, BANXICO QUARTERLY REPORT
Juan Manuel Herrera, Director
+52.55.2299.6675
juanmanuel.herrera@scotiabank.com
- It’s a quieter week in Latam and the globe on the economic front, as markets look liable to maintain their focus on AI/tech-related sentiment.
- Mid-month Mexican and Brazilian CPI, Q3 GDP details out of Mexico and Peru, and Banxico’s quarterly report are the data highlights in Latam, while global markets will focus on U.S. PCE inflation data and PMIs from around the world.
- In today’s report, our economists in Mexico cover the latest industry-level data ahead of INEGI’s revision to Q3 GDP figures that will provide greater sectoral details.
- The team in Chile dig into the third quarter’s 1.1% y/y contraction, with an expectation that growth will significantly recover next year on the back of strong investment growth.
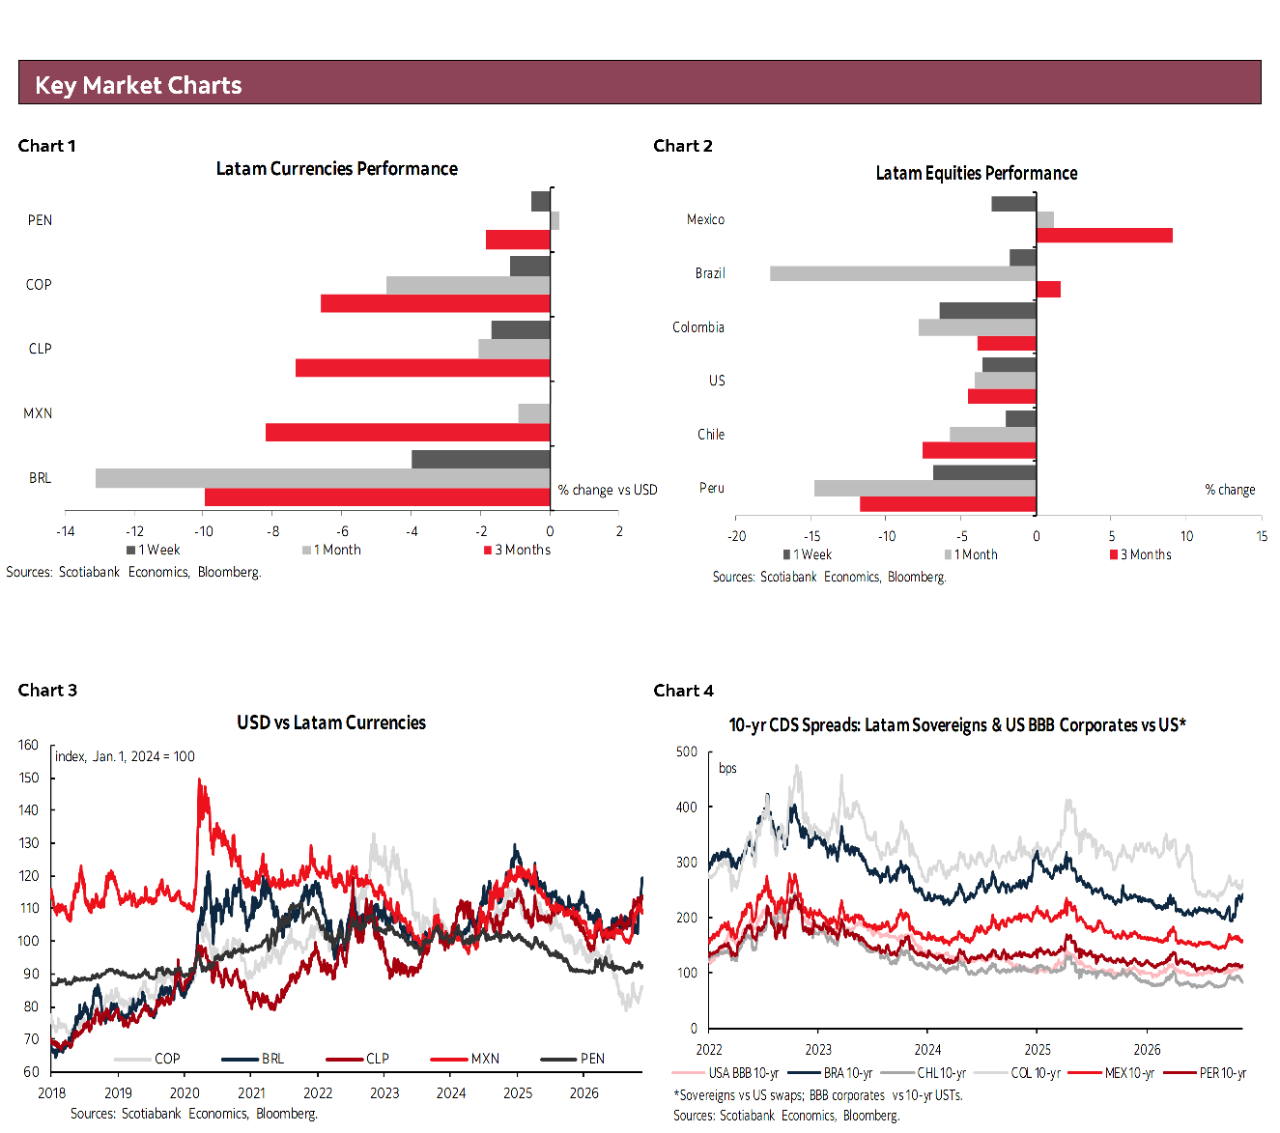
It’s a quieter week in Latam and the globe on the economic front. With markets largely trading on AI/tech-related sentiment it’s difficult to see next week’s global release calendar drawing enough attention to significantly impact the broad trading mood. From tracking 10-15% year-to-date gains between August and October, the S&P 500 is now sitting only about ~2.5% higher since end-2025, while the Nasdaq today slipped into a small drop for the year.
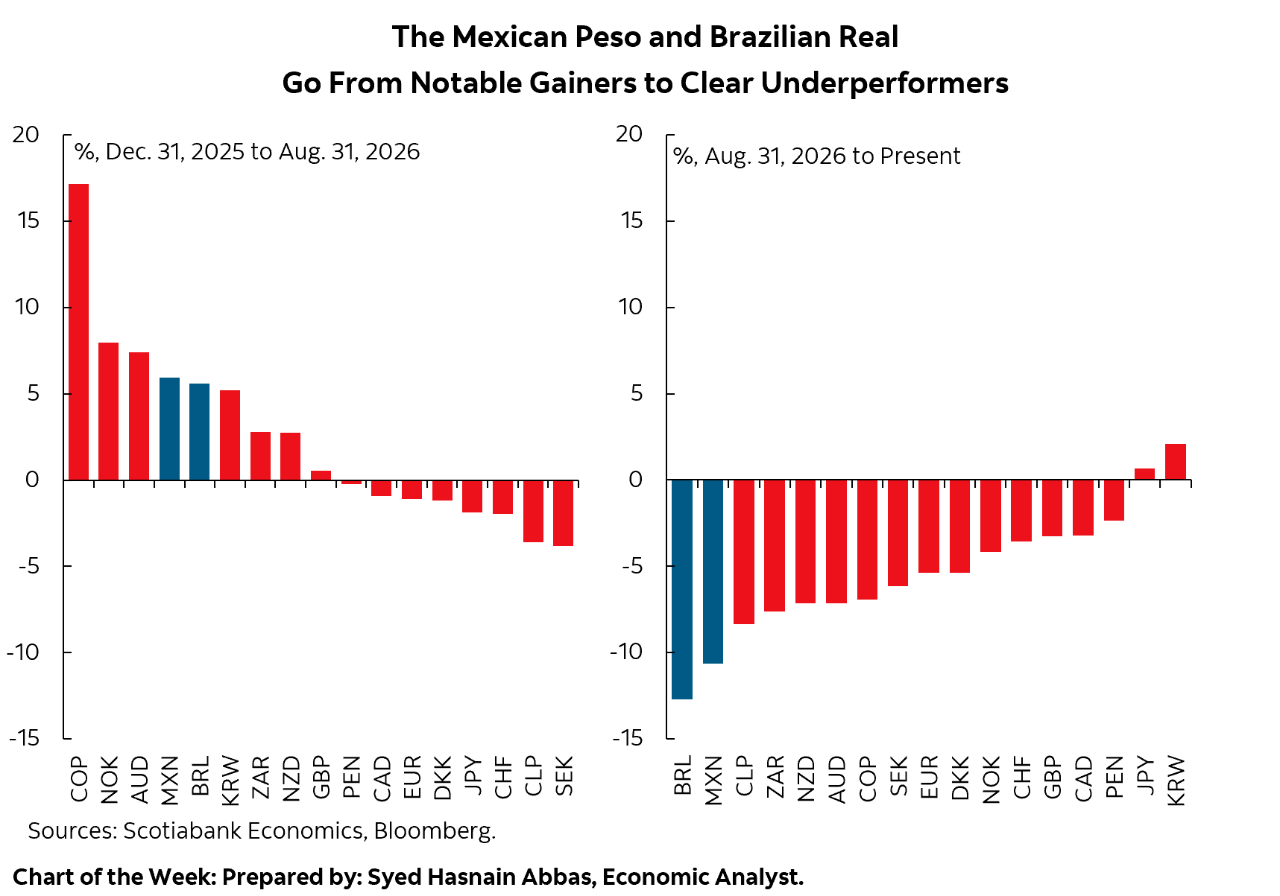
Mexico’s IPC built up a solid cushion from October through last week that helps it stay up around 7% ytd, but Brazil’s Ibovespa 3% ytd gain is well off its pre-second round election highs of +30%, and Chile’s IPSA is down ~2% ytd (from ~10% gains as recently as September). Latam currencies have also underperformed amid market anxiety, weakening by around 7% against the USD in the case of the BRL and COP compared to two Fridays ago, followed by -4% for the CLP, and -2.5% for the MXN, while the PEN’s 1% loss is fairly moderate amid broad safety/Fed bets-driven USD gains.
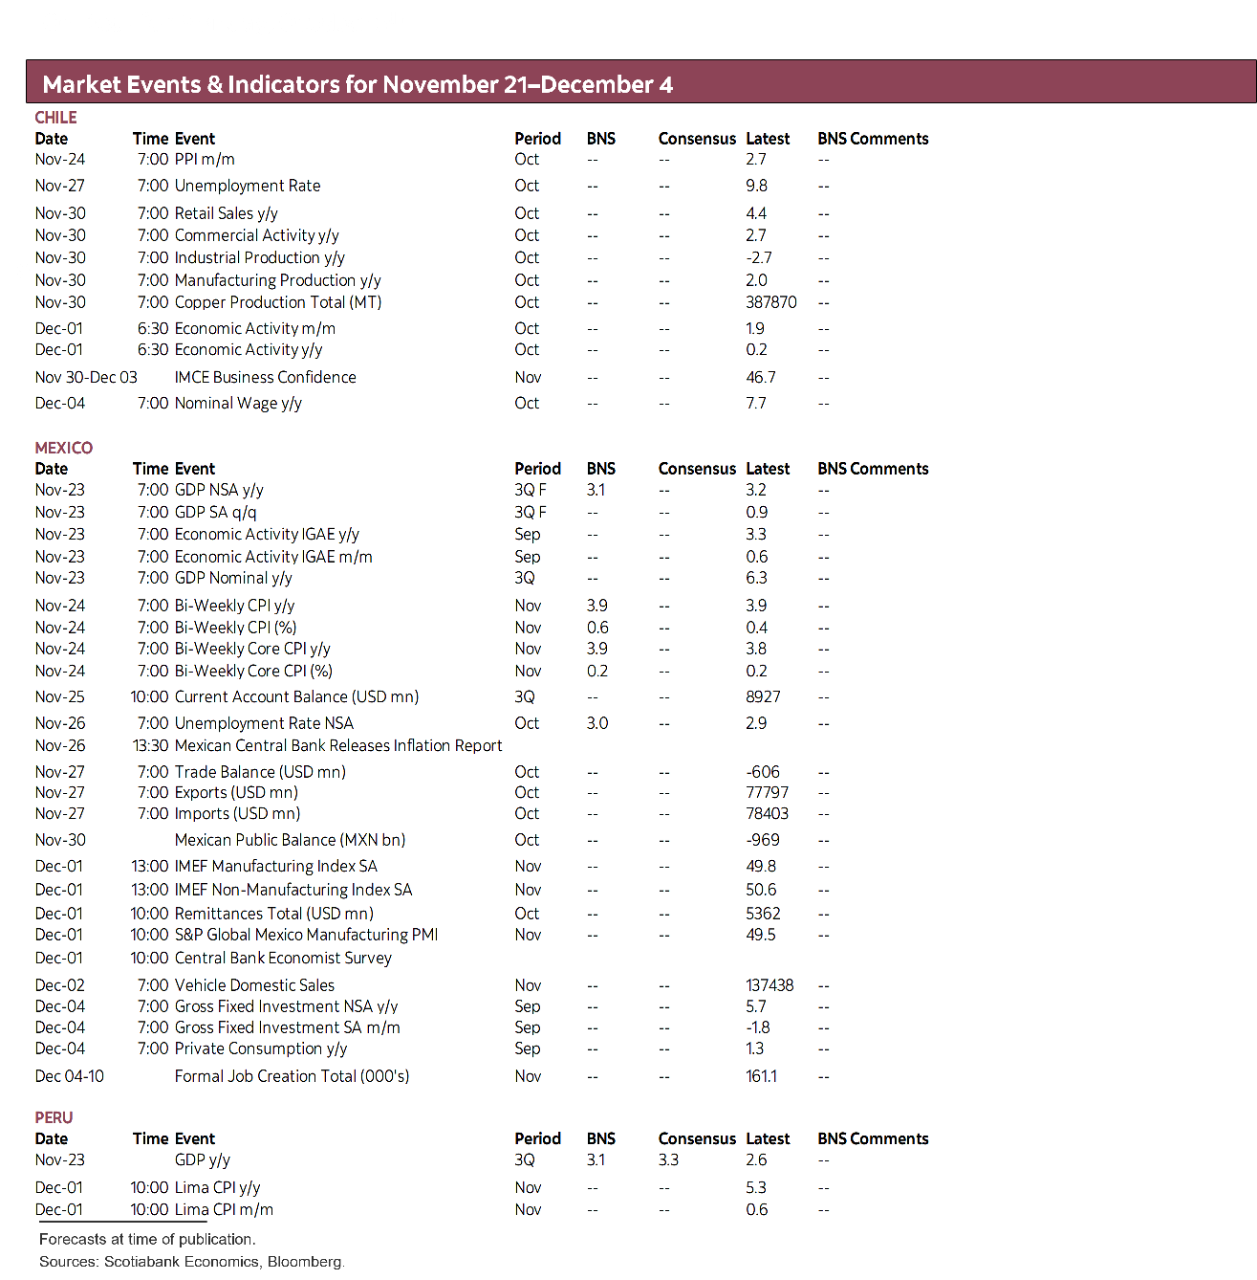
Mid-month CPI data out of Mexico and Brazil are the regional data standouts, with Mexico’s Q3 GDP second release telling us things that we mostly already know (though with more detail), and while we know that Peru’s Q3 GDP grew by 3.1%, we’ll get expenditure components in Monday’s report that should show strong private investment and consumption gains. Finally, Banxico’s quarterly report out on Thursday may shed some on light on just what the bank is seeing (and we’re not) that is green-lighting rate cuts. Global S&P PMIs kick off the week, and mid-week U.S. PCE data will refine Fed hike bets, as will Friday’s French and Spanish HICP in the case of the ECB. Dell and HP quarterly results, while not top-top tier in the space, may influence tech sentiment.
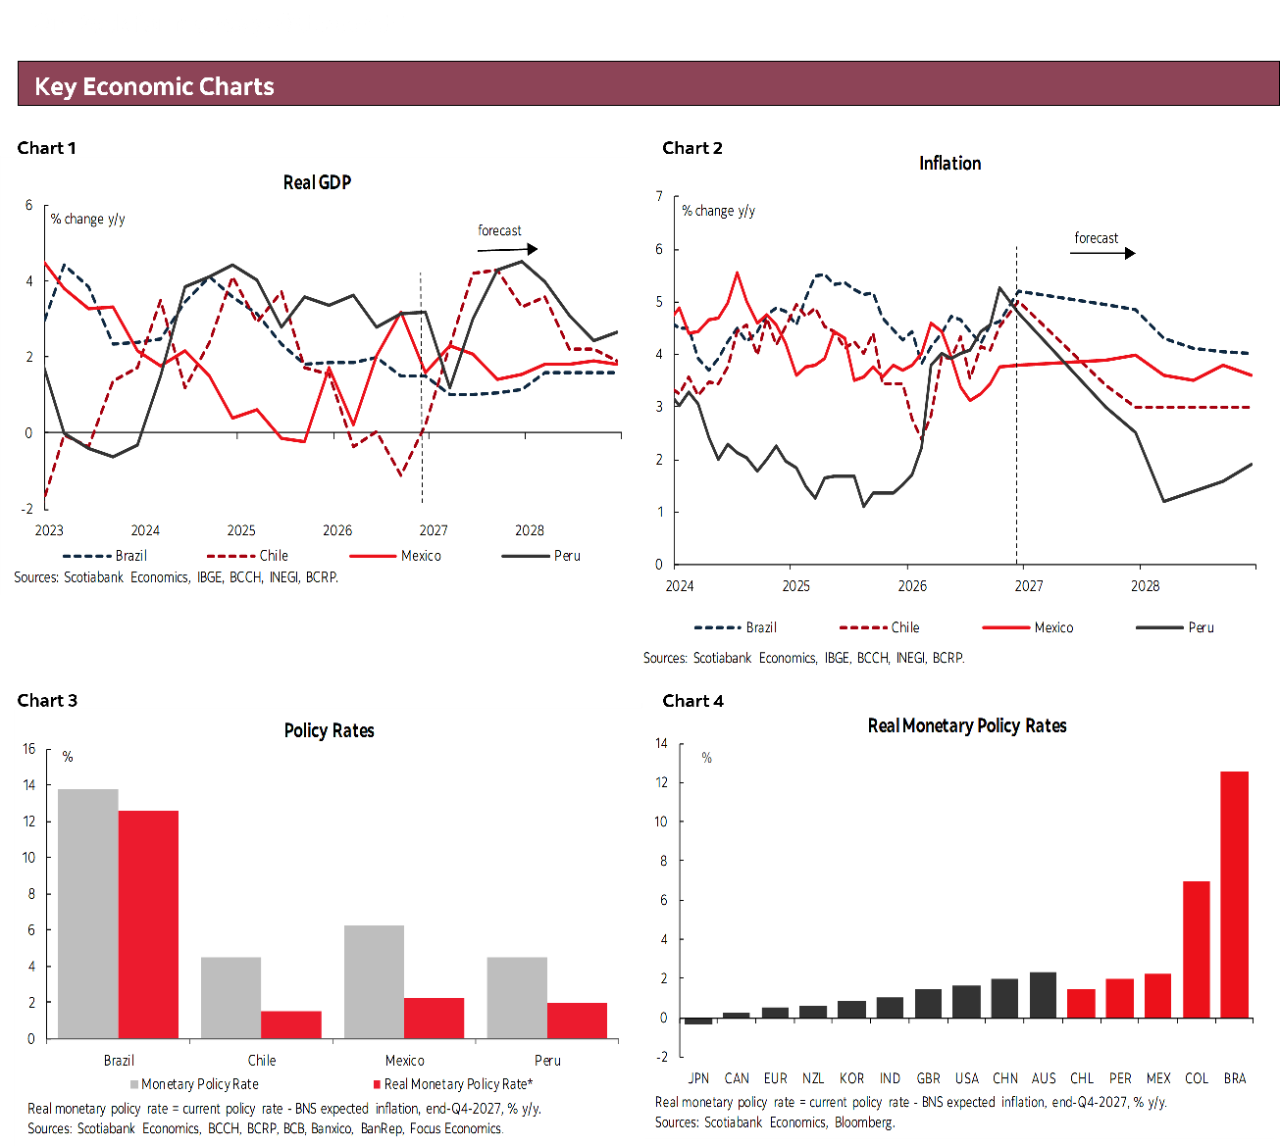
For Tuesday’s H1-Nov Mexican CPI, we estimate that headline inflation held at 3.9% y/y but core inflation picked up 0.1pts to 3.9%. Thus, both readings will be only marginally inside Banxico’s 2–4% tolerance band, and the bank expects that both will quickly fall to the low 3s around mid-2027 and touch the 3% goal from Q4 of next year. Under these forecasts it’s no surprise that the majority of the board was motivated to lower the overnight rate by 25bps a couple of weeks ago, as outlined in the minutes published earlier this week (see here).
In contrast to Banxico, economists expect practically no movement in headline and core inflation between now and end-2027, with results to the Citi survey of economists published today showing the median projecting 3.9% and 3.8% respective levels next December.
Inflation consistently sitting above the 3% midpoint of the 2–4% target band and often near its upper limit and expected to remain around there over the medium-term points to over-accommodative monetary policy that would not require additional easing (instead, the opposite). A tolerance band allows for some volatility and discretion in policymaking, but with the expectation that inflation oscillates around the 3% midpoint, not that it often knocks against the ceiling and sometimes surpasses it—in a way, it looks more like a 3–4% target band with allowance for overshoots.
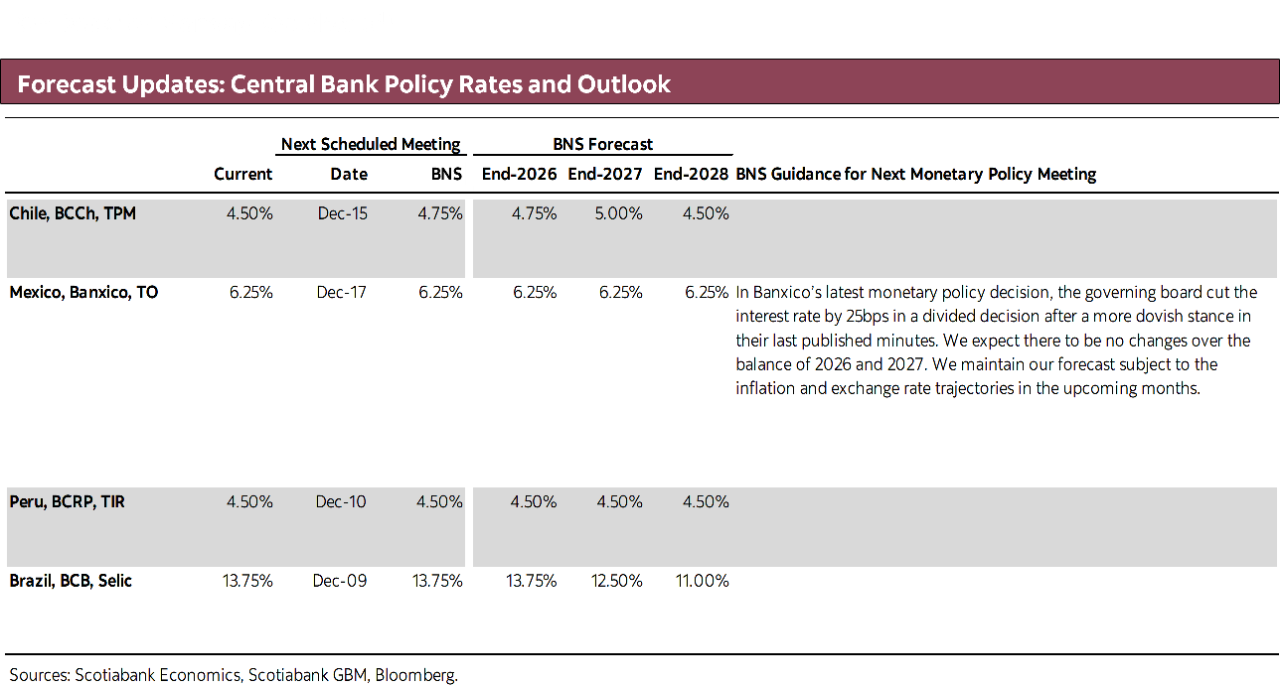
Given the dovish stance of Banxico’s governing board and the fact that Heath—whose view in the minutes was that the discussion should have been to hike or hold and not to hold or cut—leaves the bank at the end of the year (and will likely be replaced by someone more open to cuts), we are not expecting policy rate hikes in the near term and forecast that Banxico will stay true to its word that the policy rate should be kept unchanged at 6.25% for a prolonged period.
We certainly understand the view of markets that are betting on multiple Banxico rate hikes over the coming quarters, in light of off-target inflation and expectations, the Fed’s own hiking cycle and MXN risks, and some better-than-expected domestic economic trends of late. But, in recent quarters, Banxico has been more inclined to take advantage of opportunities that allow some downward tweaks to the policy rate (e.g. suppose inflation comes in lower than expected in Q1-27), or it would likely strongly resist data or market pressure to tighten policy. Thursday’s Banxico quarterly report may elaborate somewhat on the balance of risks to the inflation goal, but we’re generally more interested in the special discussion topics that are included in the document.
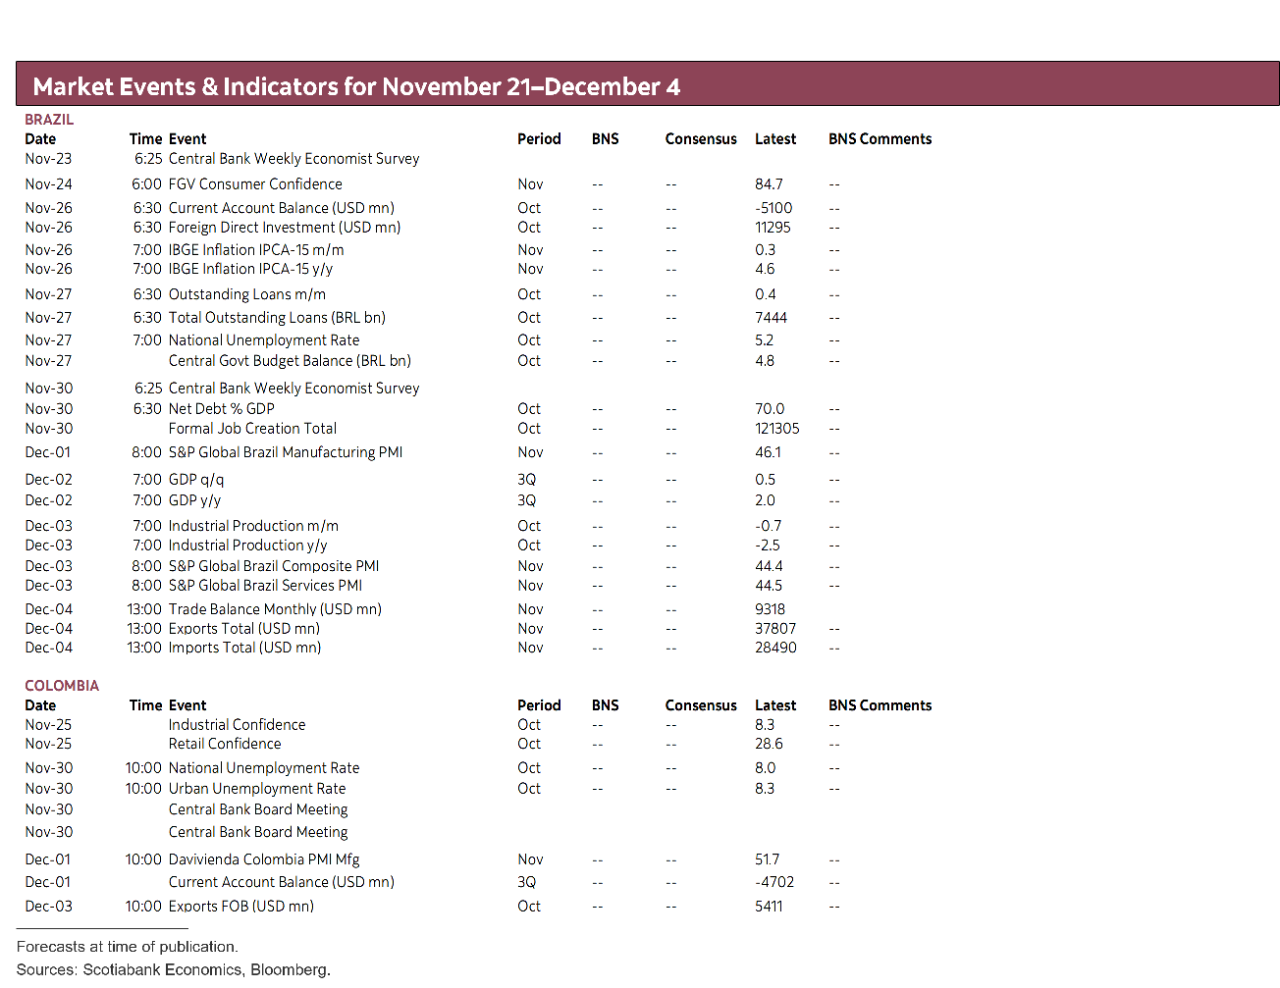
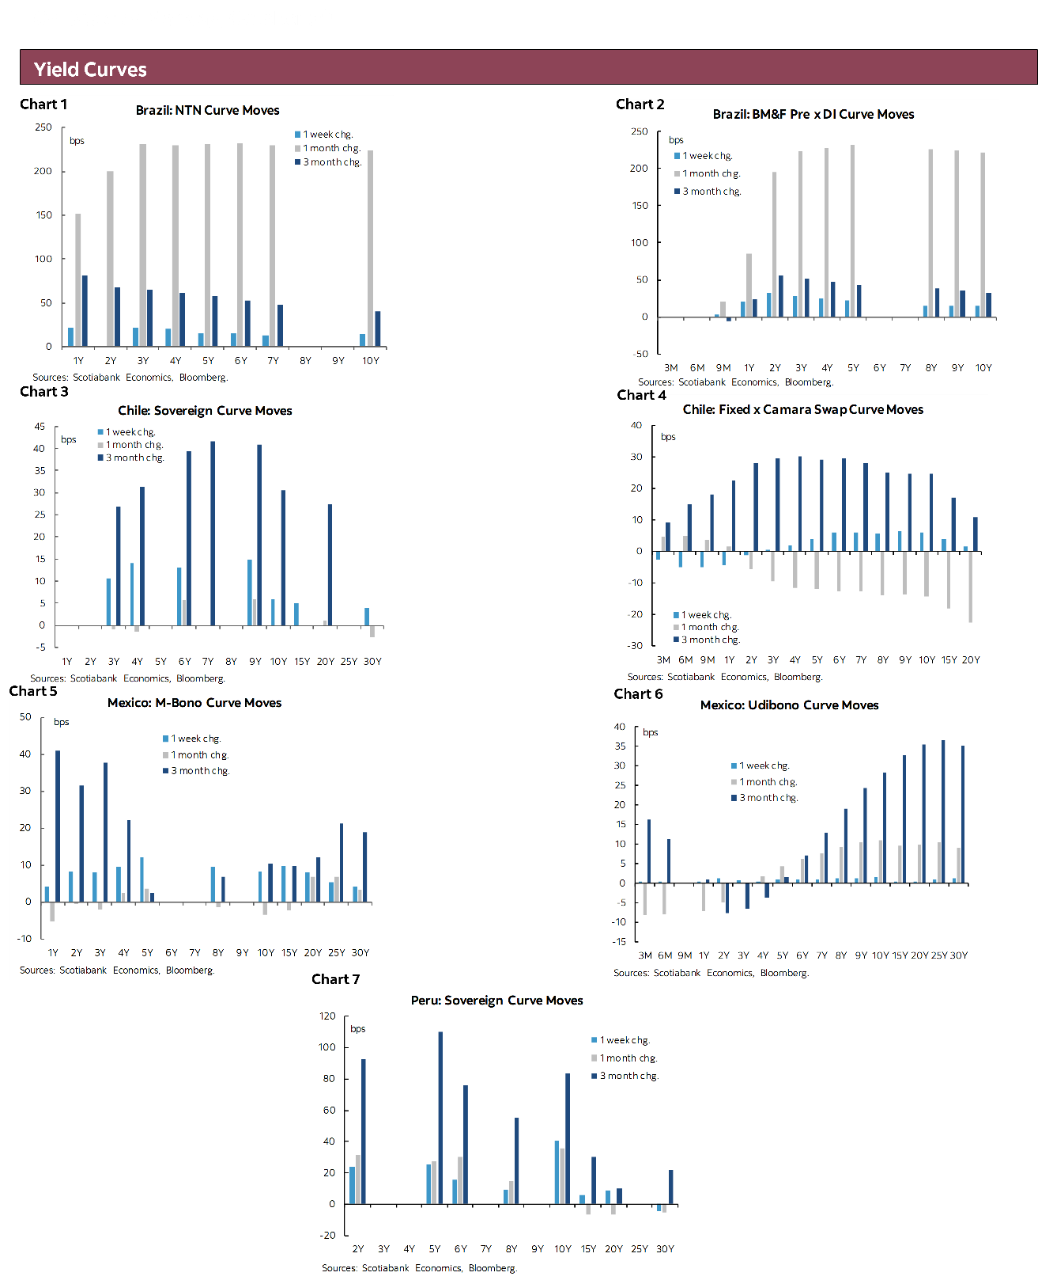
In the case of Brazil, inflation is seen rising from 4.6% to 4.8% y/y in November’s IPCA-15, and thus its highest level since June (possibly October 2025 if above 4.8%), as food inflation continues to accelerate while downward progress in underlying inflation has somewhat stalled. For Brazilian markets, fiscal developments and expectations remain the leading domestic shot-caller. On Thursday, Reuters reported that President Lula is nearing a decision on who will lead the Finance Ministry in his next term beginning on January 5th. VP Alckmin and Piaui governor Fonteles are floated as the leading candidates to replace Durigan; with the former representing the market’s likely preferred option among the two.
COUNTRY UPDATES
Chile—Q3 GDP Contraction Shapes a Recession Year, Though Revisions Erase the Technical Recession
Anibal Alarcón, Senior Economist
+56.2.2619.5465 (Chile)
anibal.alarcon@scotiabank.cl
- We project a 0.3% contraction in GDP in 2026
National Accounts figures for the third quarter, released by the Central Bank, showed a sharp contraction in economic activity: GDP fell 1.1% y/y and 1.8% q/q in seasonally adjusted terms, the steepest sequential decline since the pandemic. With these figures, a recession year is taking shape. GDP contracted 0.5% y/y through the first nine months, and our estimate for 2026 is now a 0.3% contraction, the first annual decline since 2020. However, the same release revised second-quarter GDP up to a marginal 0.1% q/q SA expansion (previously a contraction). As a result, the economy no longer met the definition of a technical recession (two consecutive quarters of seasonally adjusted contraction): the declines in Q1 (-0.5% q/q) and Q3 (-1.8% q/q) are separated by a quarter of slightly positive growth. The distinction is technical rather than economic, since activity has stagnated or fallen for three quarters in a row.
Mining explains most of the third-quarter contraction. Mining GDP plunged 14.7% y/y (copper: -17.5% y/y) and 12.9% q/q SA, subtracting about 1 pp from annual growth. Non-mining GDP grew 1.0% y/y but fell 0.2% q/q SA, so weakness is not confined to copper. Construction contracted again (-5.0% y/y; -1.8% q/q SA), its fifth consecutive seasonally adjusted decline, consistent with a residential segment still waiting for the incentives of the National Reconstruction Act. Positive contributions came from commerce (+1.5% y/y), utilities (+6.0% y/y), agriculture (+10.2% y/y) and personal services (+0.8% y/y). These partly offset the drag from mining and construction. However, non-mining GDP remained resilient, highlighting the economy's ability to absorb multiple adverse shocks.
Domestic demand fell 0.9% q/q SA, with private consumption and investment both declining in seasonally adjusted terms. Household consumption contracted 0.3% q/q SA. The decline was concentrated in durable goods (-0.7% q/q) and services (-1.3% q/q), while non-durables rebounded (+0.9% q/q). This composition shows households postponing discretionary spending amid a weak labour market and high fuel costs. In annual terms, household consumption slowed to 0.7% y/y, from 2.8% a year ago. Government consumption fell 0.3% q/q SA, in line with the ongoing fiscal consolidation.
Investment declined across all its components. Gross fixed capital formation fell 3.6% q/q SA (-6.7% y/y). Machinery and equipment dropped 6.9% q/q SA (-10.1% y/y), and construction and other works fell 1.5% q/q SA (-4.1% y/y), the fourth consecutive quarterly decline of this component. Investment subtracted 1.7 pp from annual GDP growth, the largest drag among expenditure components. It reverses the capex cycle that supported growth in 2025. On the external side, exports fell 2.1% q/q SA, dragged by mining shipments (-6.6% q/q SA), while imports rose 0.8% q/q SA, so net exports also weighed on the quarter.
Q4 will need a strong rebound for the year to close at -0.3%. Our forecast implies Q4 GDP growth of around 0.2% y/y. Because the Q4-2025 base is demanding, this requires a significant sequential recovery, mainly from a normalization of mining output after an exceptionally weak third quarter. The balance of risks remains tilted to the downside: if mining does not recover, or if construction and machinery investment keep contracting, the annual decline could be deeper.
Investment should rebound strongly in 2027, and we expect gross fixed capital formation to grow 6%. The latest report of the Capital Goods Corporation (CBC) supports this view. As of Q3-26, its registry includes 989 projects with defined schedules, totaling USD 96.9 bn for 2026–2030. This is up 1.8% from the previous quarter, led by public works and real estate. For 2027, the CBC's preliminary estimate is USD 24.5 bn, broadly unchanged from 2026 (USD 24.7 bn), which is itself about 14% above the average of the last decade. The composition matters more for the cycle. Spending on equipment would peak in 2027 at USD 8.8 bn (+10% vs. 2026), as large energy and mining projects move from civil works to equipment installation. This is precisely the component that fell 10.1% y/y in Q3. Moreover, the 2027 figure only includes projects that already have defined schedules, and the CBC itself sees potential for it to reach the levels of 2025–2026. Together with the low comparison base left by this year's contraction and the incentives of the Reconstruction Act, these figures support our forecast of 6% investment growth. Investment would thus be the main driver of the 3.5% GDP growth we project for 2027. The main risk is a slower materialization of projects: new entries to the CBC registry fell in Q3, and some large mining decisions have been postponed.
Mexico—Q3 GDP Gain Backed by Construction and Commerce
Rodolfo Mitchell, Director of Economic and Sectoral Analysis
+52.55.3977.4556 (Mexico)
mitchell.cervera@scotiabank.com.mx
Miguel Saldaña, Economist
+52.55.5123.1718 (Mexico)
msaldanab@scotiabank.com.mx
Martha Cordova, Economic Research Specialist
+52.55.5435.4824 (Mexico)
martha.cordovamendez@scotiabank.com.mx
Next week, Mexico’s revised GDP estimate for the third quarter will be released. We expect a downward revision from the preliminary INEG’s estimate, as recent indicators point to somewhat weaker-than-initially-estimated momentum in both industry and services. In its preliminary number, INEGI reported annual real GDP growth of 3.2% y/y in 3Q, supported by gains of 3.3% in tertiary activities and 3.1% in secondary activities. However, monthly indicators released since then, which incorporate more complete information for September, suggest that both components may have performed somewhat more moderately.
On the industrial side, industrial production averaged 2.7% annual growth during the third quarter, below the 3.1% initially estimated for secondary activities. Momentum weakened toward the end of the quarter, with output increasing by just 1.3% y/y in September, after growth above 3.0% in each of the previous two months. While construction remained the main driver of industrial activity, manufacturing continued to underperform, contracting 0.3% y/y in 3Q, slightly more than the 0.2% decline recorded in the previous quarter. Year to date, industrial production has expanded by only 1.0%, driven mainly by a 3.8% increase in construction, while manufacturing output has remained broadly stagnant. Although some manufacturing industries have benefited from stronger external demand, particularly those related to computer equipment and petroleum products, this has not been enough to generate a broad-based recovery across the sector.
The signals from services are more mixed. According to the IGAE, tertiary activities averaged 3.8% annual growth in July and August, supported primarily by a recovery in wholesale trade and resilient retail activity. Trade indicators released this week reinforced this trend: in September, wholesale sales rose 9.0% y/y and retail sales increased 2.2%, bringing their average growth rates for 3Q to 7.0% and 2.5%, respectively. However, the strength in trade contrasts with more moderate performance across other service activities. In September, total revenues from non-financial private services increased by just 1.7% y/y, suggesting that momentum across tertiary activities may have been less broad-based than the trade figures alone would imply.
Despite these signs of moderation in 3Q, private-sector analysts have revised their growth expectations higher, to 1.5% for the current year and 1.83% for the following year, compared with the 1.1% estimate for 2026 at mid-year.
Overall, the latest monthly data suggest that the 3.2% annual growth reported in the preliminary estimate may have marginally overstated the strength of economic activity in 3Q. In particular, industrial data point to a weaker expansion than initially expected, while in services, robust trade activity contrasts with signs of moderation elsewhere. We see limited scope for strength in services to fully offset the moderation observed in industry. As a result, the balance of risks is clearly tilted toward a downward revision to GDP in next week’s release.
| LOCAL MARKET COVERAGE | ||
| CHILE | ||
| Website: | Click here to be redirected | |
| Subscribe: | anibal.alarcon@scotiabank.cl | |
| Coverage: | Spanish and English | |
| MEXICO | ||
| Website: | Click here to be redirected | |
| Subscribe: | estudeco@scotiacb.com.mx | |
| Coverage: | Spanish | |
| PERU | ||
| Website: | Click here to be redirected | |
| Subscribe: | siee@scotiabank.com.pe | |
| Coverage: | Spanish | |
DISCLAIMER
This report has been prepared by Scotiabank Economics as a resource for the clients of Scotiabank. Opinions, estimates and projections contained herein are our own as of the date hereof and are subject to change without notice. The information and opinions contained herein have been compiled or arrived at from sources believed reliable but no representation or warranty, express or implied, is made as to their accuracy or completeness. Neither Scotiabank nor any of its officers, directors, partners, employees or affiliates accepts any liability whatsoever for any direct or consequential loss arising from any use of this report or its contents.
These reports are provided to you for informational purposes only. This report is not, and is not constructed as, an offer to sell or solicitation of any offer to buy any financial instrument, nor shall this report be construed as an opinion as to whether you should enter into any swap or trading strategy involving a swap or any other transaction. The information contained in this report is not intended to be, and does not constitute, a recommendation of a swap or trading strategy involving a swap within the meaning of U.S. Commodity Futures Trading Commission Regulation 23.434 and Appendix A thereto. This material is not intended to be individually tailored to your needs or characteristics and should not be viewed as a “call to action” or suggestion that you enter into a swap or trading strategy involving a swap or any other transaction. Scotiabank may engage in transactions in a manner inconsistent with the views discussed this report and may have positions, or be in the process of acquiring or disposing of positions, referred to in this report.
Scotiabank, its affiliates and any of their respective officers, directors and employees may from time to time take positions in currencies, act as managers, co-managers or underwriters of a public offering or act as principals or agents, deal in, own or act as market makers or advisors, brokers or commercial and/or investment bankers in relation to securities or related derivatives. As a result of these actions, Scotiabank may receive remuneration. All Scotiabank products and services are subject to the terms of applicable agreements and local regulations. Officers, directors and employees of Scotiabank and its affiliates may serve as directors of corporations.
Any securities discussed in this report may not be suitable for all investors. Scotiabank recommends that investors independently evaluate any issuer and security discussed in this report, and consult with any advisors they deem necessary prior to making any investment.
This report and all information, opinions and conclusions contained in it are protected by copyright. This information may not be reproduced without the prior express written consent of Scotiabank.
™ Trademark of The Bank of Nova Scotia. Used under license, where applicable.
Scotiabank, together with “Global Banking and Markets”, is a marketing name for the global corporate and investment banking and capital markets businesses of The Bank of Nova Scotia and certain of its affiliates in the countries where they operate, including; Scotiabank Europe plc; Scotiabank (Ireland) Designated Activity Company; Scotiabank Inverlat S.A., Institución de Banca Múltiple, Grupo Financiero Scotiabank Inverlat, Scotia Inverlat Casa de Bolsa, S.A. de C.V., Grupo Financiero Scotiabank Inverlat, Scotia Inverlat Derivados S.A. de C.V. – all members of the Scotiabank group and authorized users of the Scotiabank mark. The Bank of Nova Scotia is incorporated in Canada with limited liability and is authorised and regulated by the Office of the Superintendent of Financial Institutions Canada. The Bank of Nova Scotia is authorized by the UK Prudential Regulation Authority and is subject to regulation by the UK Financial Conduct Authority and limited regulation by the UK Prudential Regulation Authority. Details about the extent of The Bank of Nova Scotia's regulation by the UK Prudential Regulation Authority are available from us on request. Scotiabank Europe plc is authorized by the UK Prudential Regulation Authority and regulated by the UK Financial Conduct Authority and the UK Prudential Regulation Authority.
Scotiabank Inverlat, S.A., Scotia Inverlat Casa de Bolsa, S.A. de C.V, Grupo Financiero Scotiabank Inverlat, and Scotia Inverlat Derivados, S.A. de C.V., are each authorized and regulated by the Mexican financial authorities.
Not all products and services are offered in all jurisdictions. Services described are available in jurisdictions where permitted by law.