Fiscal developments have been in the spotlight all around the globe. However, in Colombia, the government’s financing strategy has drawn attention because, far from focusing solely on issuance tasks, it has had a deeper background and purpose that deserves a closer look. This report provides a recap of the financing strategy, not only what was implemented but also the macroeconomic rationale gleaned from various interactions and communications with the Ministry of Finance (MoF). In parallel, we examine how markets have behaved during the implementation of the strategy.
2024 MACRO AND MARKET BACKGROUND
Since mid-2024, Colombia’s yield curve began to show movements reflecting a widening of yield curve premiums—first by widening the spread between average yields and the monetary policy rate, and second by fueling a significant steepening of the curve (chart 1). This behaviour coincided with a backdrop where expectations of a smooth easing cycle in Colombia vanished, coupled with a worse-than-expected performance in fiscal accounts.
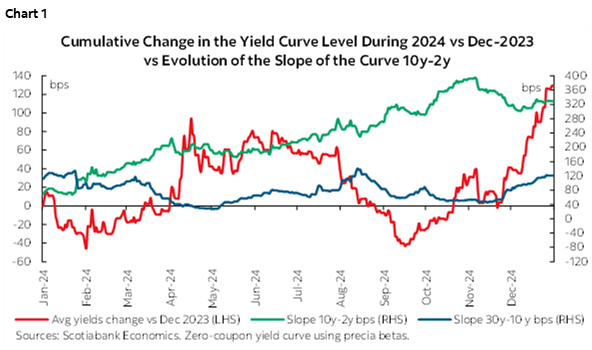
However, something new happened with the country’s financing strategy via a significant increase in outstanding debt, especially in long-term tenors, with issuances outside of the traditional auction plan used to pay relevant liabilities such as the FEPC (Gasoline Price Stabilization Fund), among others. All in all, in December 2024 compared to the end of 2023, the COLTES curve rose by 120 bps, while the 2y10y slope jumped from 70 bps to 328 bps, with a similar shift seen in the very long end vs 10y tenor that also saw a widening in spreads that closed 2024 at 120 bps.
In the case of Colombian global bonds, the urgency to secure funding by the end of 2024 led to increased premiums in the late-2024 global bond issuance round. Despite demand exceeding USD 11 bn, a coupon rate above 8% in the 2054 issue highlighted higher required fiscal premiums, with the added consideration of anxious international markets regarding November U.S. elections.
CHARACTERISTICS OF THE 2025 FINANCING STRATEGY AND MARKET EFFECTS
Following the 2024 backdrop, we group the purpose of the 2025 financing strategy into two objectives: first, reducing the cost of current outstanding debt, and second, reducing the cost of new issuances. Both objectives apply to debt in local and foreign currencies. We summarize our assessment about recent operations in table 1.
1. Cost Reduction of Existing Local Currency Debt
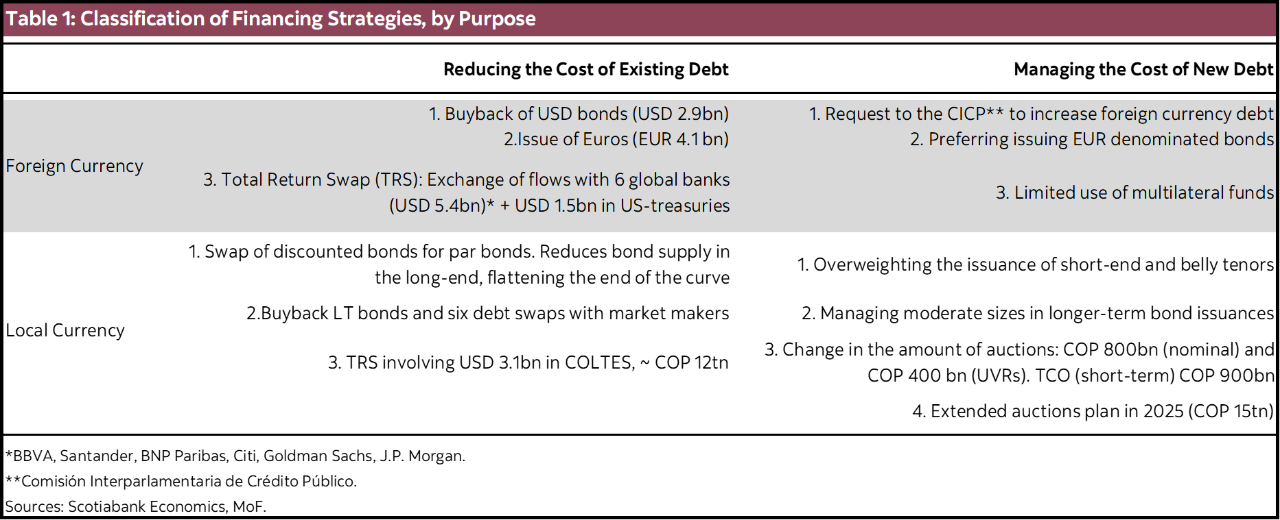
Six debt management operations have been carried out, reducing the outstanding amount of discounted bonds by exchanging them for par bonds. This has reduced the nominal value of debt by ~COP 8 trillion in COLTES pesos and UVRs (~0.44% of GDP) (chart 2). Additionally, there has been an exchange of references within the MoF’s own portfolio and the FONPET (Territorial Pension Fund) portfolio, the former one helped to reduce the nominal value of the dent by COP 5 tn (~0.28% of GDP).
It is worth noting that on October 7th, the MoF announced the seventh liability management operation (LMO) in which the novelty is that the Government now is exchanging debt with less than one year maturity (short-term TES, or TCOs) for longer tenors. This is an operation that is probably not related to reducing the nominal value of outstanding debt. Instead, we associate this with the need to manage liquidity requirements ahead of 2026.
Furthermore, a prior step involved the purchase of a portfolio worth approximately COP 12 billion by the MoF after the publication of the Medium-Term Fiscal Framework. This countered the outflow of investors from indexed funds who sold their COLTES positions following S&P’s country rating downgrade in July. This purchase helped to reduce long-term interest rates, translating into a reduced curve steepness, erasing the slope premium that formed in 2024. We believe this portfolio was also used in the construction of the total return swaps (TRS) operation with six international banks (more on this later). According to the latest COLTES holders report, the MoF’s portfolio sat at COP 9.93 tn.
2. Cost Reduction on New Issuances
Amid the reduction of the excess outstanding in discounted references—especially in long-term debt—and the purchase of COLTES for the MoF portfolio, the flattening in the very long end of the curve gave the MoF a signal to issue the 33-year bond. The COLTES 2058 was issued with a 12% coupon. From a macroeconomic standpoint, anchoring long-term rates around 12% helps to establish a benchmark for long-term credit costs for the broader economy, such as in mortgage markets and investment projects, which, over the medium-term, could promote a better environment for economic growth.
Going forward, we expect the MoF to maintain long-term bond supply at necessary levels and avoid triggering another episode of excess supply similar to the one seen in 2024. In contrast, short- and medium-term issuances will be favoured, as these segments have better absorption among a more diverse base of investors.
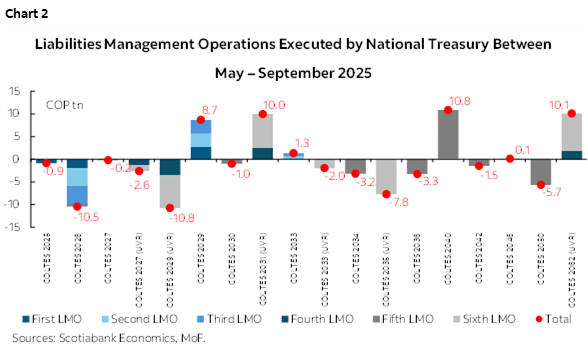
The result of previous implemented strategies has been reflected in diverse ways in the yield curve. Colombia’s yield curve was under stress across the board after the publication of the Financing Plan in February 2025 given the low credibility of its fiscal projections. However, after the Medium-Term Fiscal Framework (MTFF), when the new financing strategy was released, price action has been more benign. Average yields have tightened by 84 bps, while the 10y30y slope shrunk by 76 bps, to 57 bps currently (chart 3). In the case of the 2y10y slope, we saw some progress where 10y yields have fallen more than 2y yields.
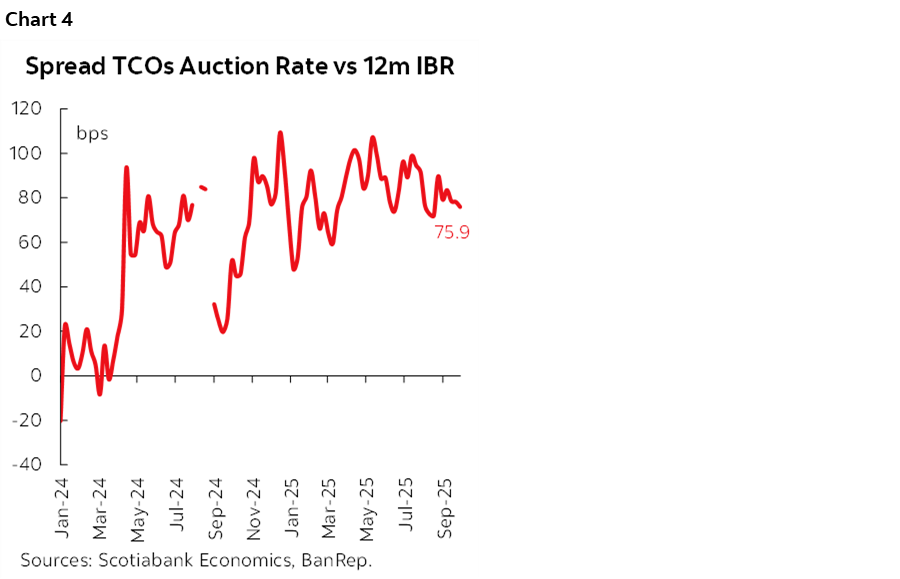
Note that given the government’s seeming preference to issue in the short-end and belly of the curve, we observe some relative cheapening in the short-term bonds space (TCOs) with an increased differential vis-à-vis the 12-month interbank rate (IBR) of around ~75 bps (chart 4), reflecting the trade-off between facing higher funding rates in short-term debt with the hope that refinancing rates next year will improve.
Last but not least, the MoF announced an increase in the 2025 COLTES auction target by COP 15 billion, which will likely extend the auction calendar until December, and provide insight into how the previous strategy’s impact sits on the yield curve.
3. Reduction of Cost of Existing Foreign Currency Debt
Initial actions focused on replacing outstanding dollar-denominated bonds. On August 11th, the MoF repurchased USD 2.96 billion in bonds using its own cash and funding structures involving local currencies and Swiss francs. Around one month later, the government issued EUR 4.1 billion in global markets, with demand reaching EUR 25.43 billion. On October 2nd, the MoF reported that the hedging structure built for the financing part of the global bond repurchase closed with a positive result for the nation—equivalent to ~USD 85 million (~COP 331 billion / 0.02% of GDP), representing a 4% benefit in roughly a month, given the operation’s size.
Amplifying the foreign debt denomination to euros opened access to a broader investor base. Although it requires increased monitoring of currency exposures, the interest rate differential between EUR and USD issuance is expected to reduce long-term borrowing costs.
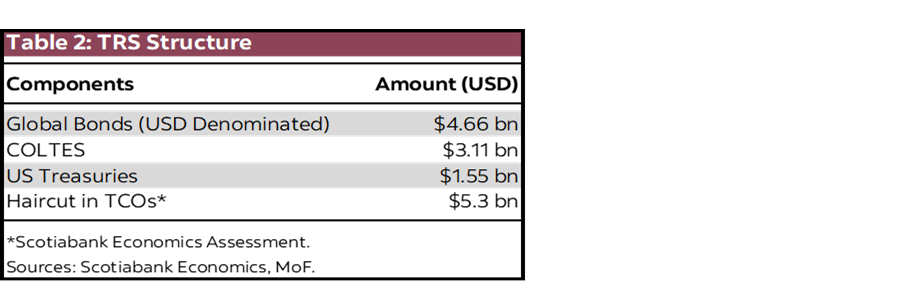
In the same vein, a Total Return Swap (TRS) operation was conducted with six major international banks. The total nominal value of the operation is USD 9.4 billion, with USD 4.66 billion involving dollar-denominated debt. In this structure, the nation receives payments for this bond basket, plus another component composed of COLTES pesos (USD 3.1 billion) and U.S. Treasuries (USD 1.55 billion), in exchange for payments on a liability in Swiss francs. In this structure, we identify the issuance of COP 21.6 tn ( ~USD 5.3 bn) that serves as the ~35% haircut of the operation (table 2).
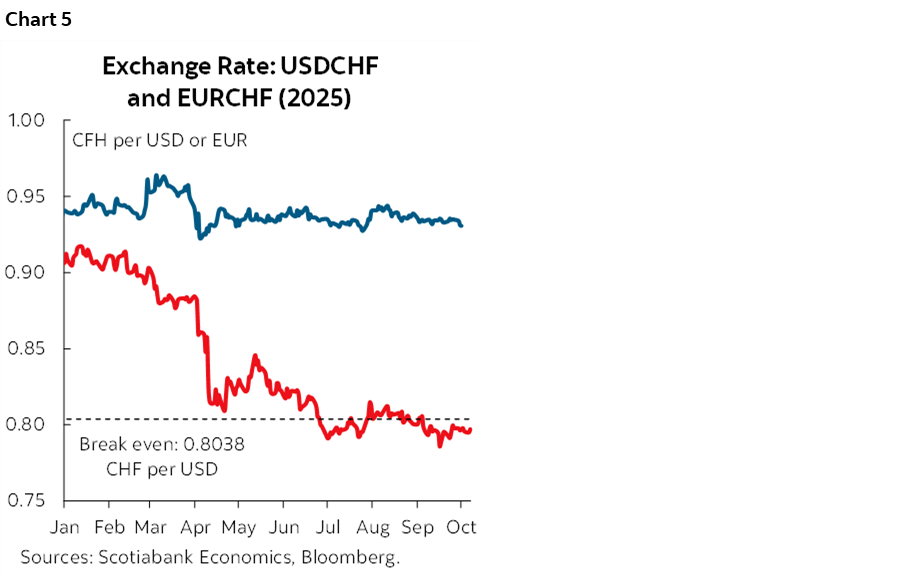
According to the MoF, in the TRS, the nation committed to pay CHF 7.495 billion in exchange for USD 9.324 billion, from which we infer a break-even exchange rate of 0.8038 CHF per USD (chart 5). According to the MoF communique, in this structure, the USD is the operative currency, CFH is the currency of liability exposure, and the EUR is the currency that mitigates the risk of the operation.
4. Reduction of Cost of New Foreign Currency Issuances
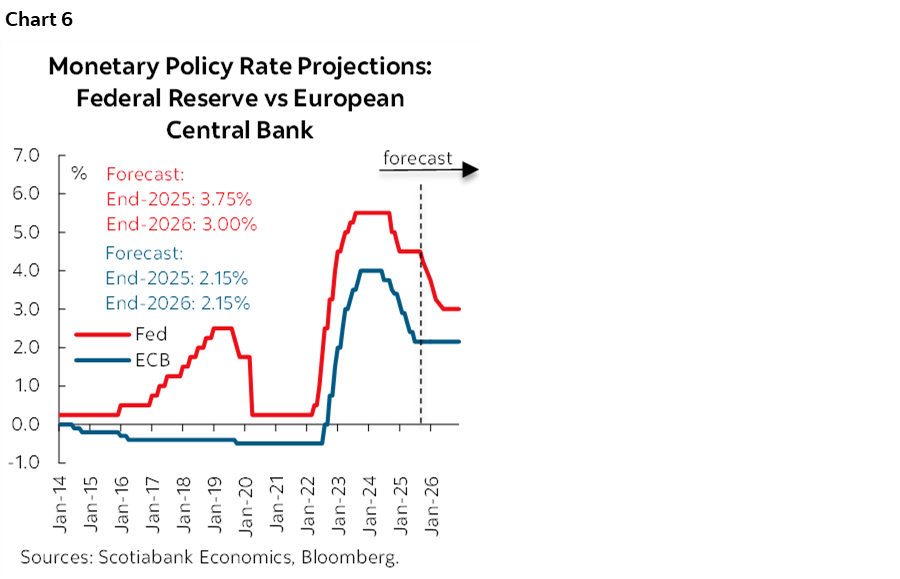
The strategy now focuses on increasing foreign currency liabilities in EUR, leveraging their rate differential versus the USD. The MoF has the capacity to issue up to USD 5 billion in global markets, with an additional USD 2.5 billion pending request. The financing strategy includes increasing recurrence in global markets in 2026, with a planned issuance of up to USD 9 billion. It is worth noting that according to Scotiabank Economics projections, the monetary policy rate differential between the U.S. and the Eurozone could shrink in coming months as the Federal Reserve resumes its easing cycle while the ECB stays put. Expected rate decisions would take the current Fed-ECB policy rate differential from 200–225 bps to only 75–100bps by end-2026 (chart 6).
WHAT ABOUT THE GOAL OF IMPROVING THE LIQUIDITY POSITION?
The MoF aimed to promote better liquidity levels for the nation. While operations in categories 1 and 3 did not generate new cash, they may provide fiscal relief in the nation’s cash flow. In our opinion, the TRS structure provided some temporary cash liquidity through the exchange of the COLTES portfolio worth USD 3 billion (~COP 12 billion) to the six international banks to build the TRS structure; our hypothesis is that this cash was used to build again a positioning in COLTES instruments.
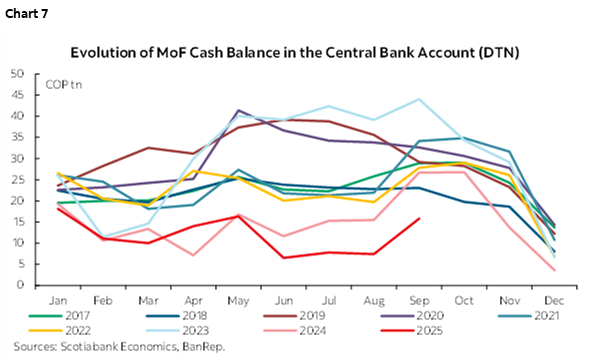
As of September 26th, the nation’s cash availability in the central bank account (DTN) stood at COP 15 trillion (0.8% of GDP, chart 7, note monthly frequency), recovering from a low below COP 2 trillion weeks earlier, part of this attributed to the TRS and the other part is due to the seasonal inflow of tax payments. In 2026, the payments profile suggests that managing maturities of short-term debt (TCOs) will be key to avoiding liquidity pressures.
Note that the MoF is also favouring not only having cash holdings, but also a portfolio to reduce the opportunity cost of liquidity. In fact, according with the recent COLTES holders report, the MoF portfolio is high (~COP 9.93 tn).
FINAL REMARKS
Although time must pass before the fiscal results of the financing strategies become clear, current indicators show that the debt-to-GDP ratio stood at 60.7% as of August—still below the MTFF-2025 projection of 61.3% for the end of 2025.
Regarding interest expenses, these should be compared to projections in the Medium-Term Fiscal Framework, which forecasted 4.7% of GDP for 2025, and 3.8% according to the General National Budget for 2026.
In terms of market effects, risk premiums have compressed, especially in local currency debt, reflected in a less steep yield curve—a shape that can be sustained as the Ministry of Finance is avoiding a significant increase in supply at the very long end.
Finally, it is important to note that while the exposure from the TRS structure of USD 9.4 billion (2.4% of GDP) is relevant, its net result will depend on the Ministry of Finance’s management until maturity.
DISCLAIMER
This report has been prepared by Scotiabank Economics as a resource for the clients of Scotiabank. Opinions, estimates and projections contained herein are our own as of the date hereof and are subject to change without notice. The information and opinions contained herein have been compiled or arrived at from sources believed reliable but no representation or warranty, express or implied, is made as to their accuracy or completeness. Neither Scotiabank nor any of its officers, directors, partners, employees or affiliates accepts any liability whatsoever for any direct or consequential loss arising from any use of this report or its contents.
These reports are provided to you for informational purposes only. This report is not, and is not constructed as, an offer to sell or solicitation of any offer to buy any financial instrument, nor shall this report be construed as an opinion as to whether you should enter into any swap or trading strategy involving a swap or any other transaction. The information contained in this report is not intended to be, and does not constitute, a recommendation of a swap or trading strategy involving a swap within the meaning of U.S. Commodity Futures Trading Commission Regulation 23.434 and Appendix A thereto. This material is not intended to be individually tailored to your needs or characteristics and should not be viewed as a “call to action” or suggestion that you enter into a swap or trading strategy involving a swap or any other transaction. Scotiabank may engage in transactions in a manner inconsistent with the views discussed this report and may have positions, or be in the process of acquiring or disposing of positions, referred to in this report.
Scotiabank, its affiliates and any of their respective officers, directors and employees may from time to time take positions in currencies, act as managers, co-managers or underwriters of a public offering or act as principals or agents, deal in, own or act as market makers or advisors, brokers or commercial and/or investment bankers in relation to securities or related derivatives. As a result of these actions, Scotiabank may receive remuneration. All Scotiabank products and services are subject to the terms of applicable agreements and local regulations. Officers, directors and employees of Scotiabank and its affiliates may serve as directors of corporations.
Any securities discussed in this report may not be suitable for all investors. Scotiabank recommends that investors independently evaluate any issuer and security discussed in this report, and consult with any advisors they deem necessary prior to making any investment.
This report and all information, opinions and conclusions contained in it are protected by copyright. This information may not be reproduced without the prior express written consent of Scotiabank.
™ Trademark of The Bank of Nova Scotia. Used under license, where applicable.
Scotiabank, together with “Global Banking and Markets”, is a marketing name for the global corporate and investment banking and capital markets businesses of The Bank of Nova Scotia and certain of its affiliates in the countries where they operate, including; Scotiabank Europe plc; Scotiabank (Ireland) Designated Activity Company; Scotiabank Inverlat S.A., Institución de Banca Múltiple, Grupo Financiero Scotiabank Inverlat, Scotia Inverlat Casa de Bolsa, S.A. de C.V., Grupo Financiero Scotiabank Inverlat, Scotia Inverlat Derivados S.A. de C.V. – all members of the Scotiabank group and authorized users of the Scotiabank mark. The Bank of Nova Scotia is incorporated in Canada with limited liability and is authorised and regulated by the Office of the Superintendent of Financial Institutions Canada. The Bank of Nova Scotia is authorized by the UK Prudential Regulation Authority and is subject to regulation by the UK Financial Conduct Authority and limited regulation by the UK Prudential Regulation Authority. Details about the extent of The Bank of Nova Scotia's regulation by the UK Prudential Regulation Authority are available from us on request. Scotiabank Europe plc is authorized by the UK Prudential Regulation Authority and regulated by the UK Financial Conduct Authority and the UK Prudential Regulation Authority.
Scotiabank Inverlat, S.A., Scotia Inverlat Casa de Bolsa, S.A. de C.V, Grupo Financiero Scotiabank Inverlat, and Scotia Inverlat Derivados, S.A. de C.V., are each authorized and regulated by the Mexican financial authorities.
Not all products and services are offered in all jurisdictions. Services described are available in jurisdictions where permitted by law.