- Recent uncertainty regarding economic policy has threatened North American supply chain integration, particularly in the automotive sector, which has historically had highly integrated value chains
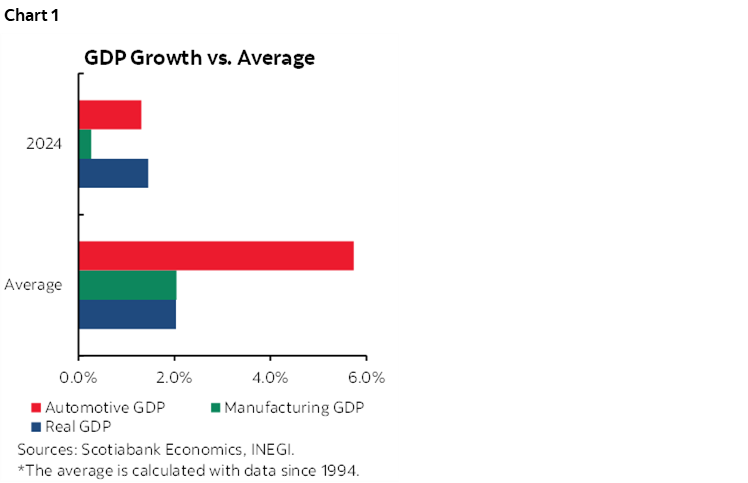
The transportation equipment sector represents approximately 5.0% of Mexico’s GDP, and since the signing of the first North American trade agreement (NAFTA in 1994, later replaced by the USMCA in 2020), this sector has become one of the engines of the Mexican economy, growing 5.7% on average versus the national average of 2.0% (chart 1). The industry’s strength is fundamentally due to the incorporation of global value chains and its highly export-oriented profile.
As we have previously discussed, this sector faces a series of regional challenges that introduce uncertainty. In Mexico, this uncertainty has translated into annual declines in production and export volumes of light and heavy vehicles in the first months of 2025.
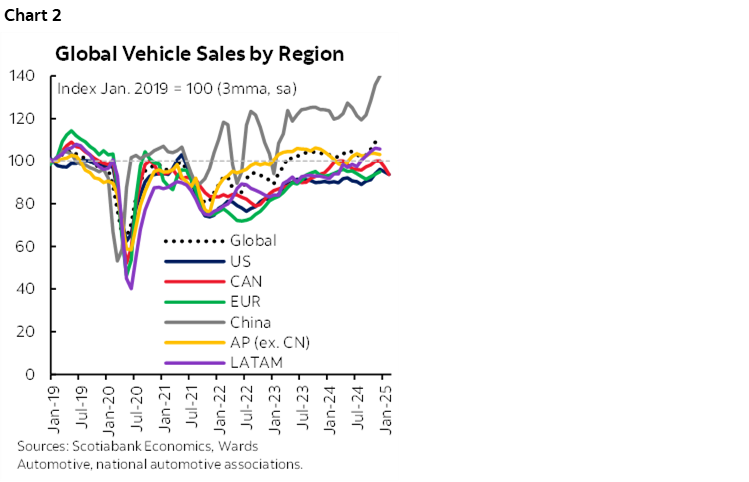
In terms of volume, light and heavy vehicles showed a recovery until 2024, following from COVID-19-related supply chain disruptions (chart 2). On the demand side, solid demand from 2020 to date has allowed the sector to advance. However, uncertainty has affected consumer plans. Even without the imposition of tariffs, the threat of them has resulted in important setbacks in the production and export of light vehicles and, more pronouncedly, heavy vehicles.
The decline in exports in the first months of 2025 has been due to the high percentage of exports destined for the United States, which was the destination of 80% of total light vehicle exports. In 2024 alone, the total value of automotive exports reached $193.907 billion, equivalent to 31.4% of total Mexican exports during the period.
As previously mentioned by our team, in a scenario where the regional market seems to be reaching its equilibrium (having overcome COVID-19 disruptions), the sector’s outlook during the Trump administration will be determined by tariff shocks. The effects of tariffs will depend on their scope in terms of tax rate, covered activities, and duration.
SOME EXEMPTIONS FROM U.S. AUTO TARIFFS
On March 27, 2025, President Trump announced that the U.S. would impose 25% tariffs on car imports from any destination, including Mexico and Canada. However, the announcement had an important detail: U.S. input values would be exempt from tariffs in the case of autos that comply with USMCA regional-value requirements. According to the Peterson Institute, 38% of the content in Mexican vehicles comes from the United States. The situation may change in the short term; however, uncertainty could create a risk-averse environment among economic agents, potentially suspending growth plans in the Mexican sector.
FDI MOMENTUM WAS ALREADY MIDDLING PRIOR TO TRUMP
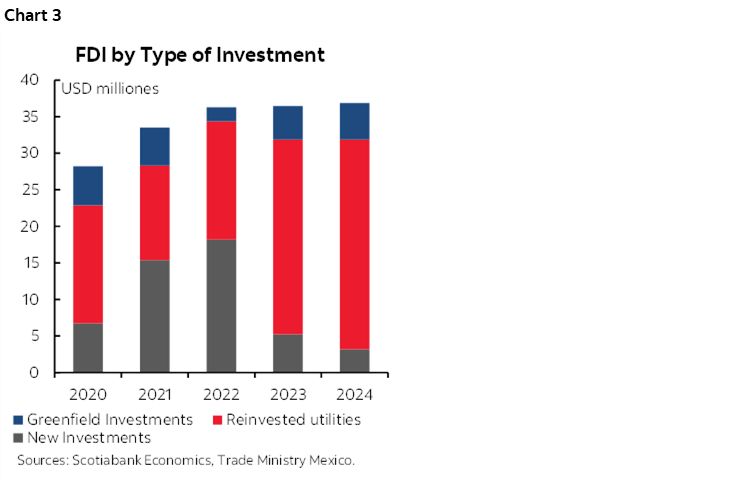
Recent trends in foreign direct investment (FDI, chart 3) in Mexico ($36.7 billion in 2024) suggest that uncertainty has had negative impacts, as expected nearshoring did not occur or undershot expectations. In fact, 77.9% of FDI in 2024 came from reinvested profits of companies already established in Mexico, while new investments made up only 8.6%. Additionally, 53.9% of total FDI was directed toward manufacturing activities, with the transportation equipment manufacturing sector accounting for $9.930 billion, growing by 35% annually and accounting for 50% of total manufacturing FDI. Although the United States is the largest source of FDI in transportation equipment activities (44.8% in 2024), Japan led overall FDI participation at 36% of the total, followed by Germany (24.1%), the Netherlands (14.7%), and only 5.6% from the United States.
CHINESE IMPORTS IN FOCUS
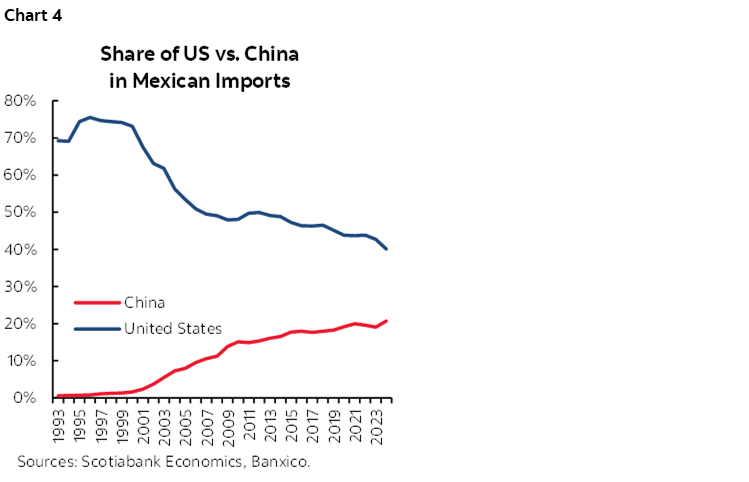
On the other hand, the increase in Chinese products in Mexican imports is a concern for the Trump administration. China’s participation in Mexican imports (chart 4), particularly inputs such as steel and aluminum, has been a focus of the U.S. administration. Additionally, the establishment of Chinese operations in Mexico to benefit from preferential trade schemes has sparked debate about rules of origin. In this sense, part of the USMCA review, in addition to being influenced by the application of tariffs, will likely revolve around mechanisms to ensure compliance with North American rules of origin to block (or heavily reduce) the entry of Chinese components into the production chain.
SLOW MARCH FOR AUTO SALES, HUGE JUMP IN PRODUCTION
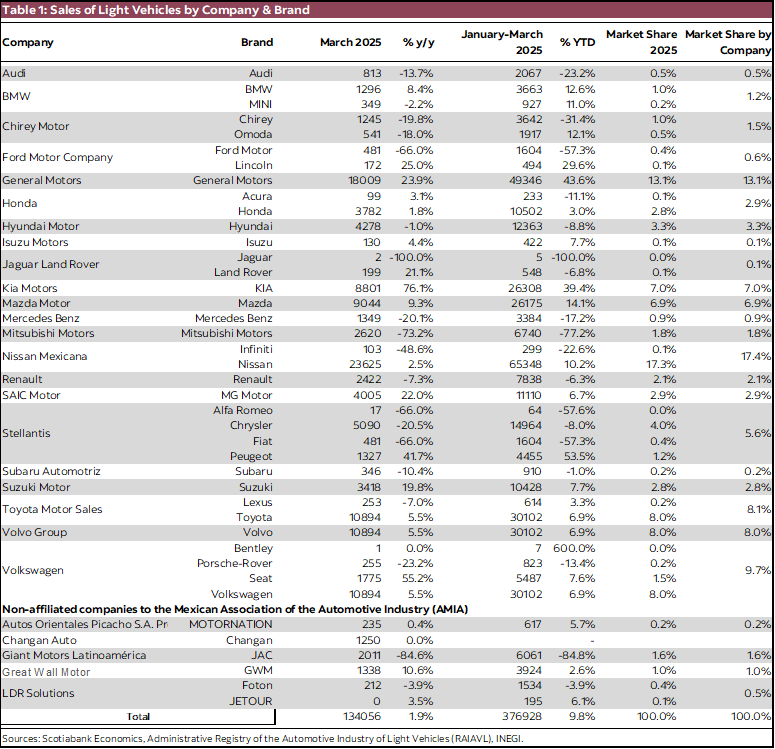
In March 2025, domestic sales of light vehicles in March continued moderating its trend, rising only 1.3% y/y from the previous 2.9% (5.9% in the same month a year earlier), registering 127,360 units in the month. Thus, in the first quarter, domestic sales totaled 365,025 units, equivalent to an accumulated annual increase of 3.3% YTD (vs. 12.1% in Q1 2024).
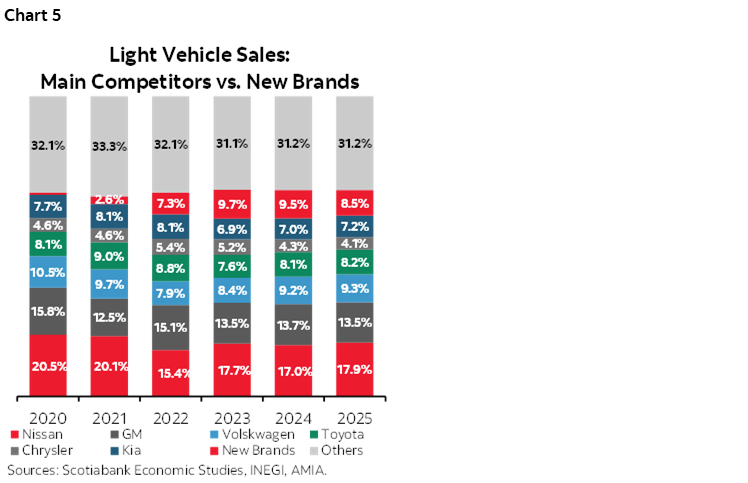
Within sales, we observe that the entry of new players continues, although with a slight loss of share in the first quarter in comparison to the 2024 (chart 5, table 1). At the beginning of this year, Chaguan joined the new competitors of Chinese origin, although in total these (Chirey, JAC, MG Motor, Great Wall, Jetour, and Foton) represented 8.5% of total sales (9.5% in 2024). In contrast, Nissan has regained some market share, rising to 17.9% (17.0% in 2024). Considering the numbers by automotive group, GM (13.5%), Volkswagen (10.8%), Stellantis (5.8%), and Ford (3.5%) lost some presence, which was taken advantage of by Kia (7.2%) and Toyota (8.4%).
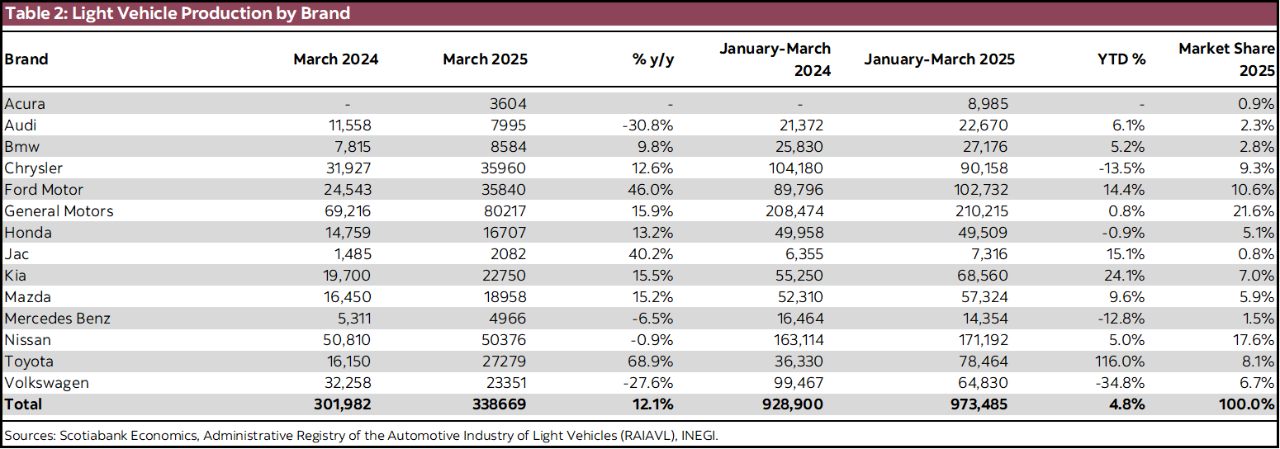
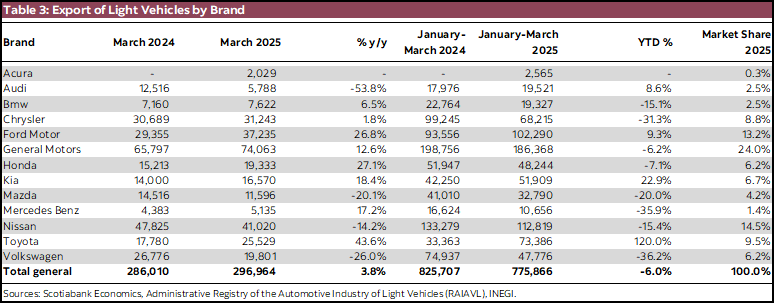
On the supply side (chart 6, tables 2 and 3), we observed a significant rebound in March, accelerating annually from 0.2% to 12.1% y/y (with 296,964 units assembled). Thus, in 2024 Q1, light vehicle production accumulated an annual advance of 4.8% YTD. The behaviour varied significantly across companies, reflecting their different strategies to manage the impact of tariffs. In March, Toyota led the annual advance, growing by 68.9%. Additionally, the rebound of several companies in March is noteworthy; for example, General Motors, which represents 21.6% of Q1 2025 numbers, soared by 15.9% after two negative months. Ford, with 10.6%, also accelerated to 46.0%. In contrast, other companies showed setbacks, such as Nissan, with -0.9%. The most notable drop was Volkswagen, with -27.6%, adding six months of setbacks, all of them in double digits. JAC, which focuses exclusively on the domestic market, saw an 18.0% increase in production during the first quarter. Meanwhile, the commencement of Acura’s operations (a Honda brand) boosted car assembly, accounting for 0.9% of the total production in January–March 2025.

HEAVY VEHICLE INDUSTRY SHOWS TARIFFS HIT
In the heavy vehicle industry (chart 7, tables 4 and 5), the effect of uncertainty in the economic outlook has been considerably more pronounced than in light vehicles. During the first quarter of 2025, all of domestic sales, production, and exports have suffered double-digit setbacks.
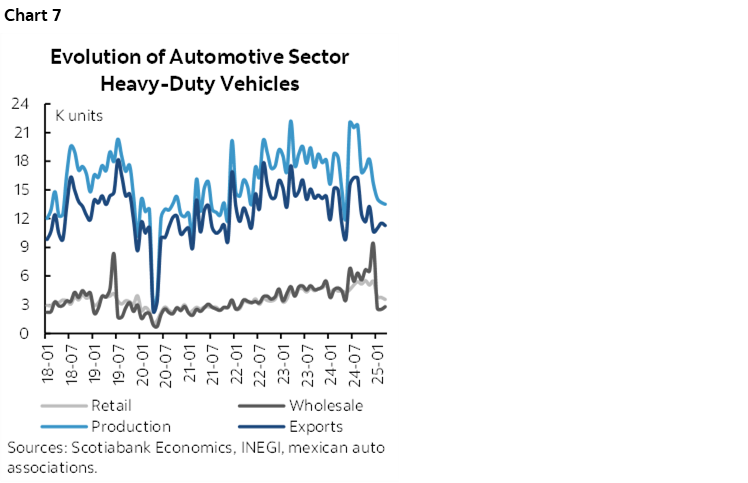
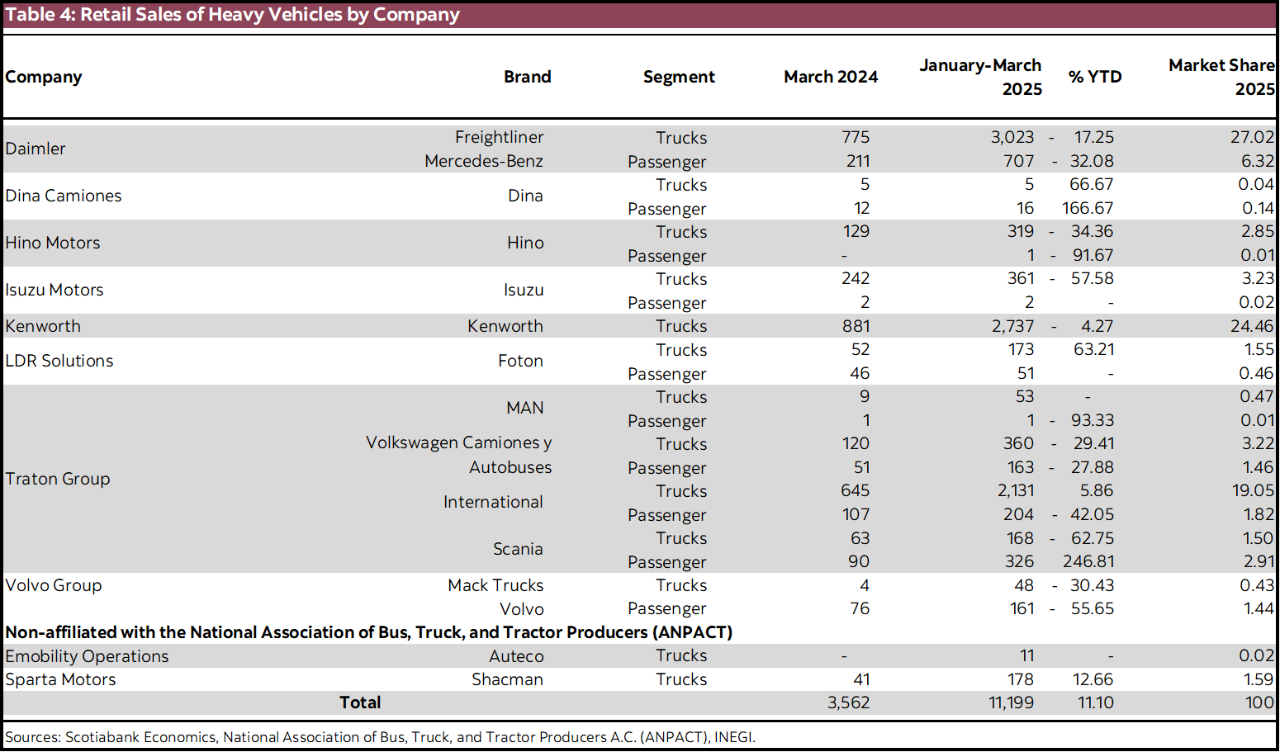
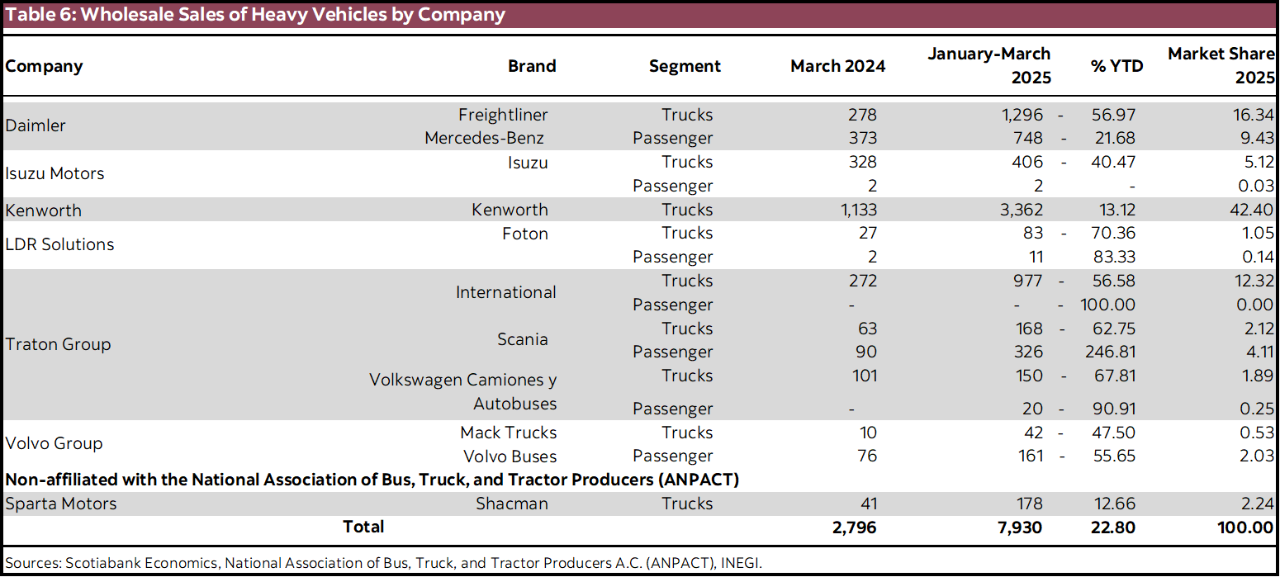
In the January–March period, retail sales of heavy vehicles fell by -16.2% accumulated annually (vs. 15.8% in the same period of 2024), totaling 11,188 units. In March alone, sales fell by -19.7%, stringing three months of setbacks. Meanwhile, wholesale sales of heavy vehicles (table 6) plummeted by -39.33% during the first quarter of the year. More related to investment, the collapse of wholesale sales suggests greater weakness in machinery and equipment investment, fostered by increased uncertainty due to changes in trade policy between Mexico and the United States.
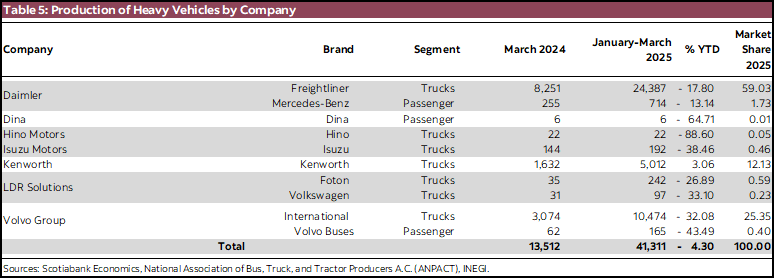
Similarly, both production and exports accentuated their setbacks in the first three months of the year. Production added seven months of setbacks in March, falling by -26.7% annually, while exports fell by -24.9% with the same number of negative months; that is, since September 2024. In year to date number, 41,311 units were produced, while 33,808 were exported, equivalent to contractions of -21.8% and -19.7%, respectively.
In the short term, we believe that some exporting companies could place a proportion of the units affected by the implementation of tariffs in the United States on the domestic market, as a consequence of higher inventory in the domestic market. Additionally, we consider that light vehicle automotive plants will maintain the assembly lines installed in Mexico in previous years, although this may not be the case for heavy vehicles, where the collapse of units has been noticeable since the beginning of the year. Plans for the installation of new plants or production lines—which would drive long-term sector growth—could be suspended until there is greater clarity and confidence in the outlook and regional integration.
DISCLAIMER
This report has been prepared by Scotiabank Economics as a resource for the clients of Scotiabank. Opinions, estimates and projections contained herein are our own as of the date hereof and are subject to change without notice. The information and opinions contained herein have been compiled or arrived at from sources believed reliable but no representation or warranty, express or implied, is made as to their accuracy or completeness. Neither Scotiabank nor any of its officers, directors, partners, employees or affiliates accepts any liability whatsoever for any direct or consequential loss arising from any use of this report or its contents.
These reports are provided to you for informational purposes only. This report is not, and is not constructed as, an offer to sell or solicitation of any offer to buy any financial instrument, nor shall this report be construed as an opinion as to whether you should enter into any swap or trading strategy involving a swap or any other transaction. The information contained in this report is not intended to be, and does not constitute, a recommendation of a swap or trading strategy involving a swap within the meaning of U.S. Commodity Futures Trading Commission Regulation 23.434 and Appendix A thereto. This material is not intended to be individually tailored to your needs or characteristics and should not be viewed as a “call to action” or suggestion that you enter into a swap or trading strategy involving a swap or any other transaction. Scotiabank may engage in transactions in a manner inconsistent with the views discussed this report and may have positions, or be in the process of acquiring or disposing of positions, referred to in this report.
Scotiabank, its affiliates and any of their respective officers, directors and employees may from time to time take positions in currencies, act as managers, co-managers or underwriters of a public offering or act as principals or agents, deal in, own or act as market makers or advisors, brokers or commercial and/or investment bankers in relation to securities or related derivatives. As a result of these actions, Scotiabank may receive remuneration. All Scotiabank products and services are subject to the terms of applicable agreements and local regulations. Officers, directors and employees of Scotiabank and its affiliates may serve as directors of corporations.
Any securities discussed in this report may not be suitable for all investors. Scotiabank recommends that investors independently evaluate any issuer and security discussed in this report, and consult with any advisors they deem necessary prior to making any investment.
This report and all information, opinions and conclusions contained in it are protected by copyright. This information may not be reproduced without the prior express written consent of Scotiabank.
™ Trademark of The Bank of Nova Scotia. Used under license, where applicable.
Scotiabank, together with “Global Banking and Markets”, is a marketing name for the global corporate and investment banking and capital markets businesses of The Bank of Nova Scotia and certain of its affiliates in the countries where they operate, including; Scotiabank Europe plc; Scotiabank (Ireland) Designated Activity Company; Scotiabank Inverlat S.A., Institución de Banca Múltiple, Grupo Financiero Scotiabank Inverlat, Scotia Inverlat Casa de Bolsa, S.A. de C.V., Grupo Financiero Scotiabank Inverlat, Scotia Inverlat Derivados S.A. de C.V. – all members of the Scotiabank group and authorized users of the Scotiabank mark. The Bank of Nova Scotia is incorporated in Canada with limited liability and is authorised and regulated by the Office of the Superintendent of Financial Institutions Canada. The Bank of Nova Scotia is authorized by the UK Prudential Regulation Authority and is subject to regulation by the UK Financial Conduct Authority and limited regulation by the UK Prudential Regulation Authority. Details about the extent of The Bank of Nova Scotia's regulation by the UK Prudential Regulation Authority are available from us on request. Scotiabank Europe plc is authorized by the UK Prudential Regulation Authority and regulated by the UK Financial Conduct Authority and the UK Prudential Regulation Authority.
Scotiabank Inverlat, S.A., Scotia Inverlat Casa de Bolsa, S.A. de C.V, Grupo Financiero Scotiabank Inverlat, and Scotia Inverlat Derivados, S.A. de C.V., are each authorized and regulated by the Mexican financial authorities.
Not all products and services are offered in all jurisdictions. Services described are available in jurisdictions where permitted by law.