- The automotive sector showed a slight improvement in Q1-2026, mainly driven by the better performance of light vehicles, while heavy vehicles continued to weigh on the industry’s overall balance.
- Light vehicles original equipment manufacturers (OEMs) posted moderate gains in domestic sales, production, and exports, suggesting a degree of resilience, although growth remains limited in absolute terms.
- Domestic demand for light vehicles faces persistent risks, associated with stagnant formal employment, slowing private consumption, and reduced momentum in remittance inflows.
- In heavy vehicles, the recent moderation in declines is mainly explained by base effects, with no clear signs of a structural recovery in sales, production, or exports.
- High uncertainty and weak investment, together with external risks linked to the trade relationship with the United States, will continue to constrain a firmer recovery of the automotive sector in the short and medium term.
The performance of Mexico’s OEMs showed a slight improvement during the first quarter of 2026 compared to the previous quarter. This performance was driven primarily by light vehicles, which registered broad-based gains in domestic sales, production, and exports. In contrast, the heavy vehicle segment continued on a downward trajectory, with no clear signs of a structural recovery, weighing on the industry’s overall performance.
LIGHT VEHICLES
Domestic Sales Growth in Q1-2026
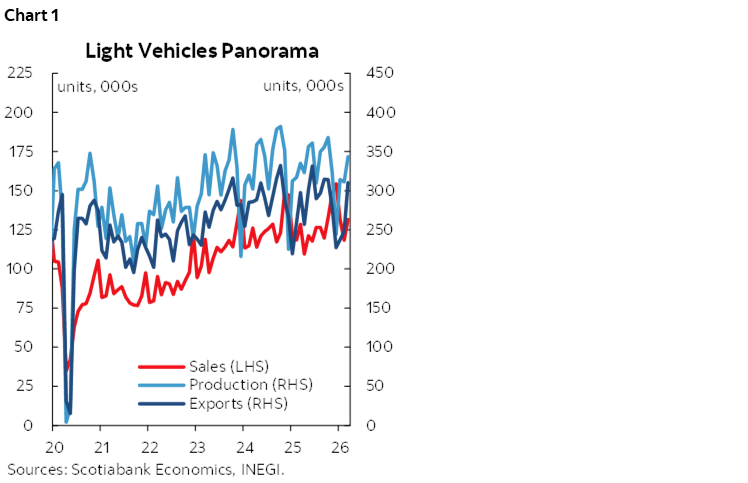
In March, domestic sales of light vehicles reached 131.6k units (chart 1), representing a year-over-year increase of 2.4%, rebounding from the -0.3% recorded in February. In cumulative terms, total sales during the first quarter of 2026 amounted to 381.6k units, equivalent to annual growth of 3.7%, broadly in line with the 3.3% increase observed in the same period of 2025. This performance points to some resilience in the domestic market, albeit in a context of moderating consumption.
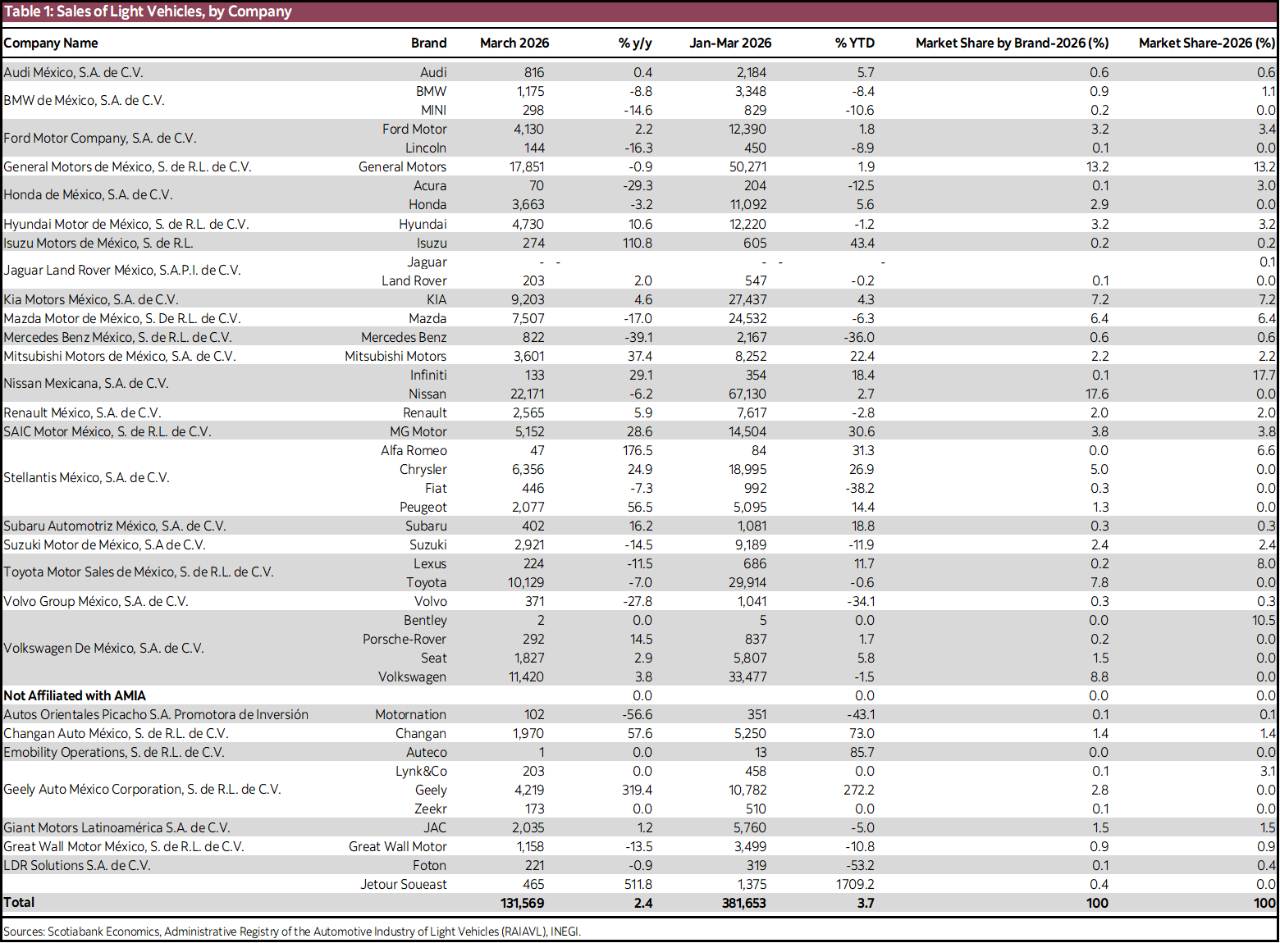
Among brands affiliated with the Mexican Automotive Industry Association (AMIA), Nissan remained the market leader (table 1), with a 17.6% market share and total sales of 67.1k vehicles during the quarter, representing cumulative annual growth of 2.7%. General Motors followed with a 13.2% share, 50.3k units sold, and annual growth of 1.9%. Volkswagen ranked third, with 8.8% of the market, 33.5k vehicles sold, and a year-over-year decline of 1.5%.
At the same time, new competitors (such as Lynk & Co and Zeekr) continued to enter the market. Nevertheless, the combined market share of Chinese brands showed a downtrend. While these brands accounted for 8.5% of the market in the same period last year, their share declined to 7.2% in Q1-2026 (chart 2). This reduction is partly explained by the absence of brands such as Chirey, GAC, Bestune, and BYD from official statistical records, as well as by the recent imposition of tariffs of up to 50% on light vehicle imports, which has significantly affected imports from China.
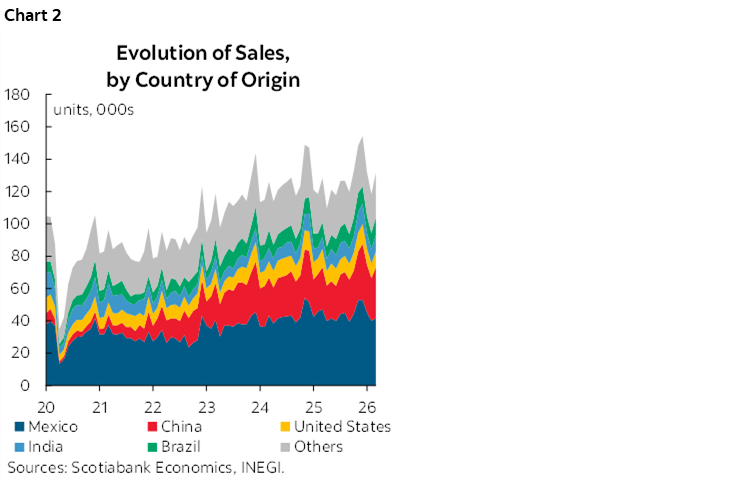
Despite this, according to the Mexican Association of Automotive Dealers (AMDA), when considering both Chinese brands that report to INEGI and those that do not, their total market share could reach as much as 17%. This suggests that the presence of these manufacturers remains significant, albeit with limited statistical visibility, introducing distortions in the interpretation of market performance by country of origin and increasing uncertainty regarding the true competitive structure of the market.
Looking ahead, the performance of light vehicle sales will depend on factors such as stagnant formal job creation, the recent slowdown in private consumption, and more moderate remittance inflows. These elements could constrain a stronger recovery in domestic demand in the coming months, despite recent improvements in headline indicators.
Light Vehicle Production and Exports
Light vehicle OEMs production in March totaled 343.5k units (table 2), representing a year-over-year increase of 2.5%, surpassing the figures recorded in January and February, which showed growth of 0.7% and a contraction of 1.8%, respectively. This marked the strongest production reading since 2023. On a cumulative basis, 969.3k units were produced during the first quarter, implying marginal annual growth of 0.5%, in line with a still-moderate expansion in aggregate terms.
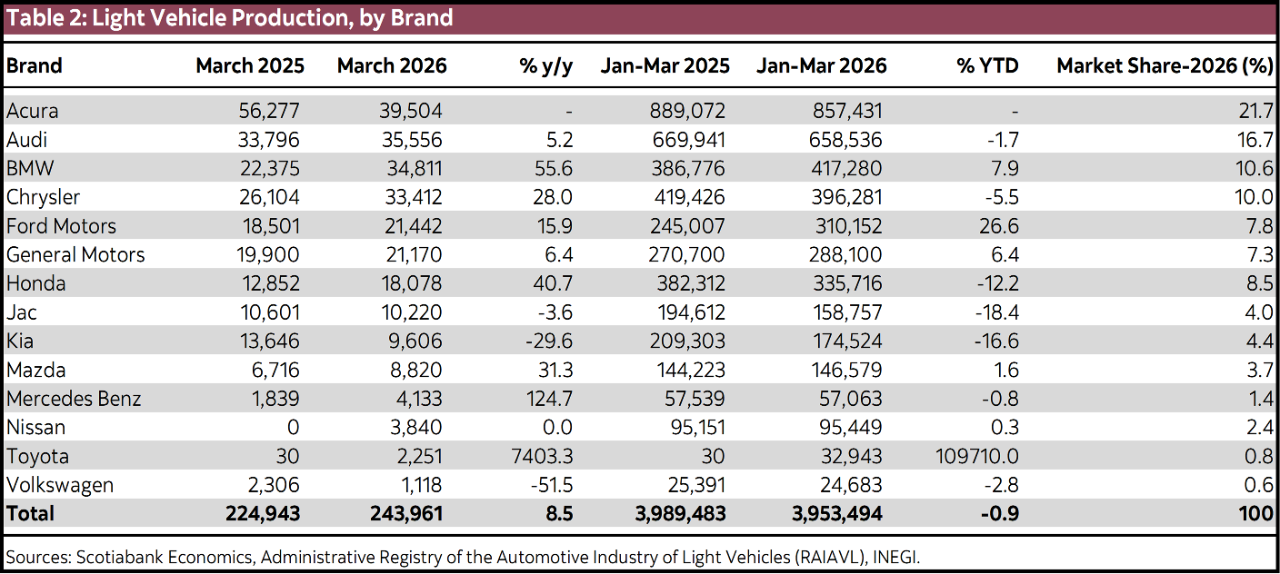
At the brand level, production increases were led by Audi, which posted growth of 60.9% with 36.5k units produced during the quarter; Volkswagen, with an increase of 53.8% and 99.7k units; and Kia, with growth of 11.3% and 76.3k units. In contrast, significant declines were observed in BMW (-35.8%), JAC and Mazda (-31% each), and Nissan (-27.4%), partly reflecting the closure of its CIVAC plant in Morelos and a concentration of production in Aguascalientes. In terms of production market share, General Motors remained the leader with 22.3%, followed by Nissan (12.2%), Chrysler (11.3%), and Ford and Volkswagen (10% each).
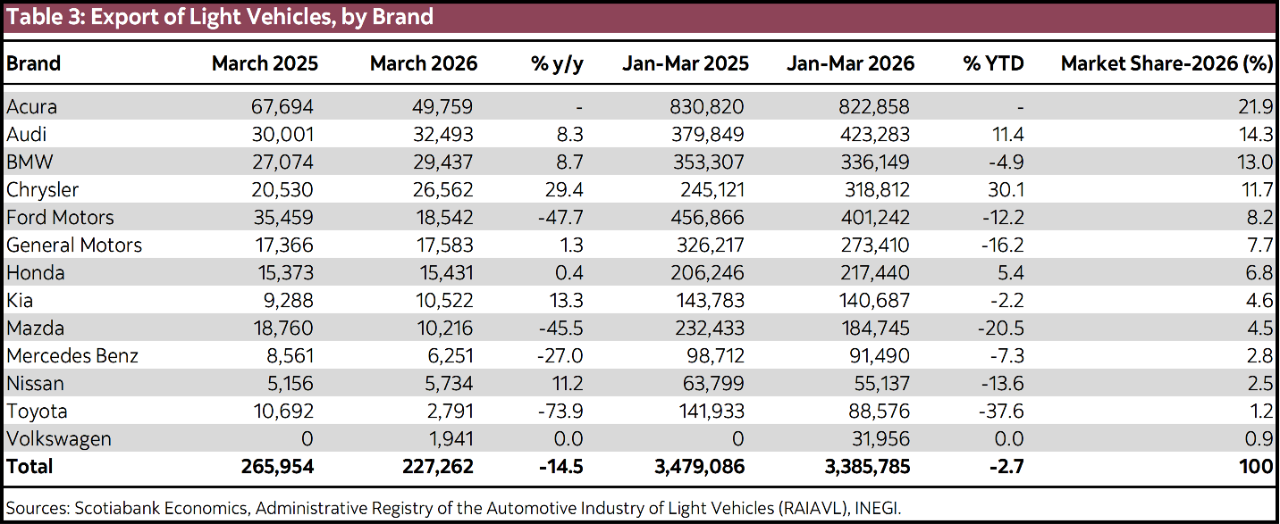
Exports recovered during the quarter (table 3). In March, 310.2k vehicles were exported, representing annual growth of 4.2%. On a cumulative basis, exports totaled 795.6k units in the first quarter, with year-over-year growth of 2.5%, following negative readings in the last quarter of 2025. By brand, Acura stood out with export growth close to 200%, totaling 7.7k units, followed by Audi (76.3% growth and 34.4k units) and Volkswagen (70.7% growth and 81.5k units). In terms of exports market share, General Motors led with 26.5%, followed by Ford (12.0%) and Volkswagen (10.7%).
HEAVY VEHICLES
Heavy Vehicle Industry: Moderation in Declines Driven by Base Effects, Without a Structural Recovery
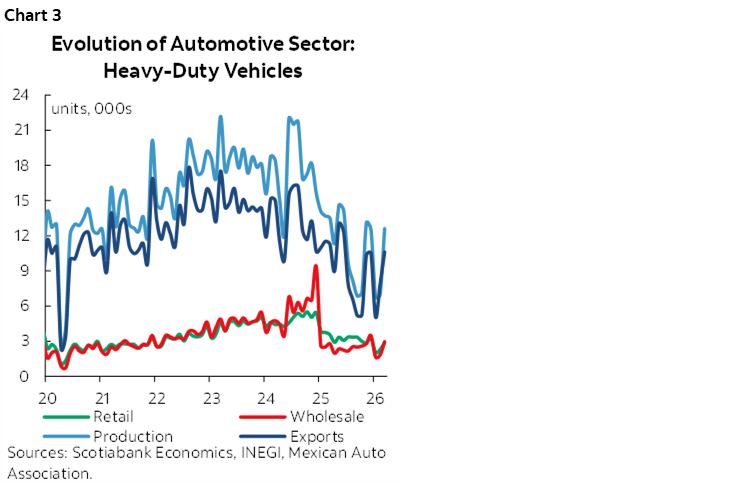
During the quarter, the heavy vehicle industry showed an apparently more favourable outlook than in previous periods (chart 3). In general, declines in sales, production, and exports moderated significantly, particularly in March. However, this improvement mainly reflects an arithmetic base effect stemming from the steep contractions recorded in the first quarter of 2025. When compared against historically low activity levels, year-over-year growth rates tend to appear less negative or even positive, without implying a genuine strengthening of the industry.
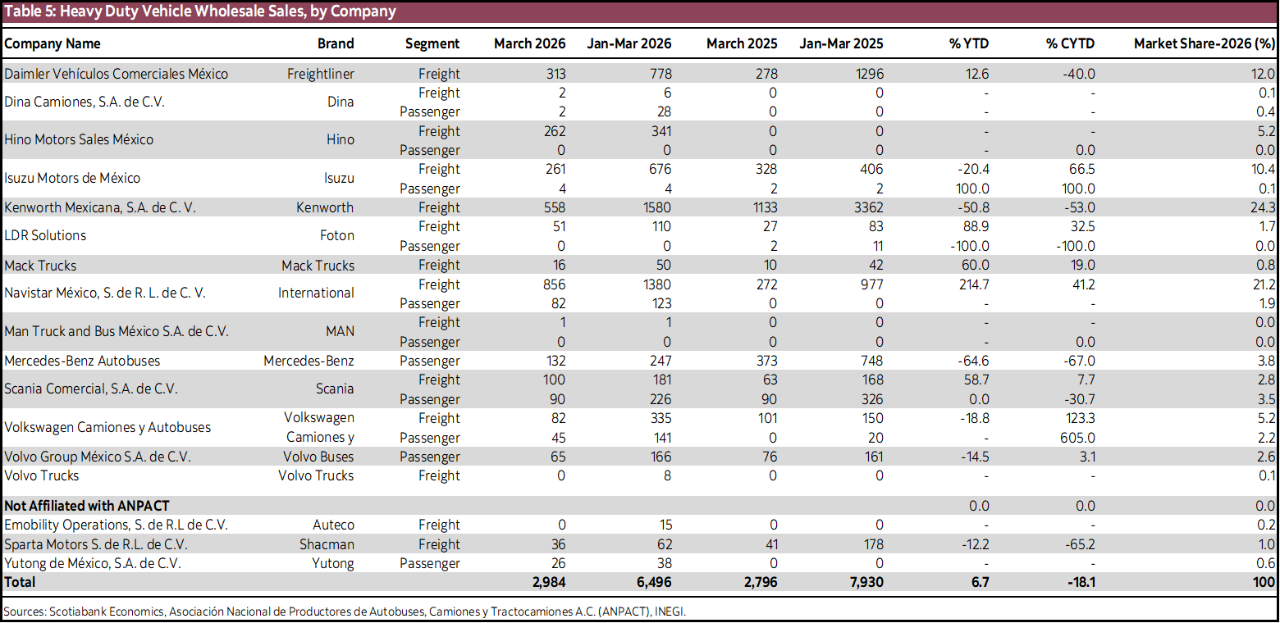
In the domestic market, demand remained fragile, although declines slowed. Retail sales totaled 2.9k units, representing a year-over-year decline of 18.6% (table 4), following contractions of 46.3% and 38.9% in January and February, respectively, marking 15 consecutive months of declines. Wholesale sales reached 3k units (table 5), posting annual growth of 6.7% and breaking a fourteen-month streak of negative growth. Nevertheless, this improvement should be interpreted cautiously, as it primarily reflects base effects rather than a structural change in market conditions. Sector weakness extends beyond the performance of sales and reflects stagnant investment and weakened business confidence, affected by domestic factors such as security conditions and persistent uncertainty surrounding judicial reform.
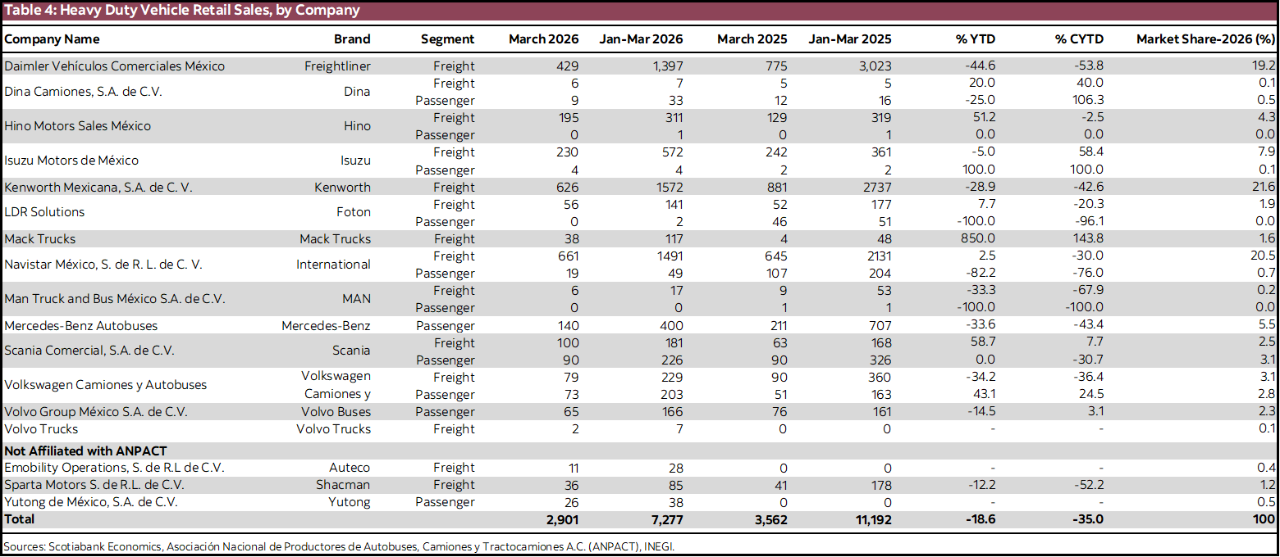
Although wholesale sales recorded annual growth in March, absolute levels remain low. Compared with March 2024, when 4.8k units were sold, the 3k units registered in March 2026 indicate that the recent improvement does not represent a structural recovery but rather a statistical rebound from a depressed comparison base.
Regarding external demand, exports in March totaled 10.6k heavy vehicles, representing a year-over-year decline of 5.9%, considerably smaller than those observed in January (-53.8%) and February (-32.0%), and even exceeding December levels. On a quarterly basis, exports accumulated 23.6k units, a decline of 30.3% compared to the first quarter of 2025. As in recent quarters, U.S. reindustrialization policies promoting domestic vehicle production remain one of the main downside risks for the sector, compounded by the 25% tariffs applied to trucks.
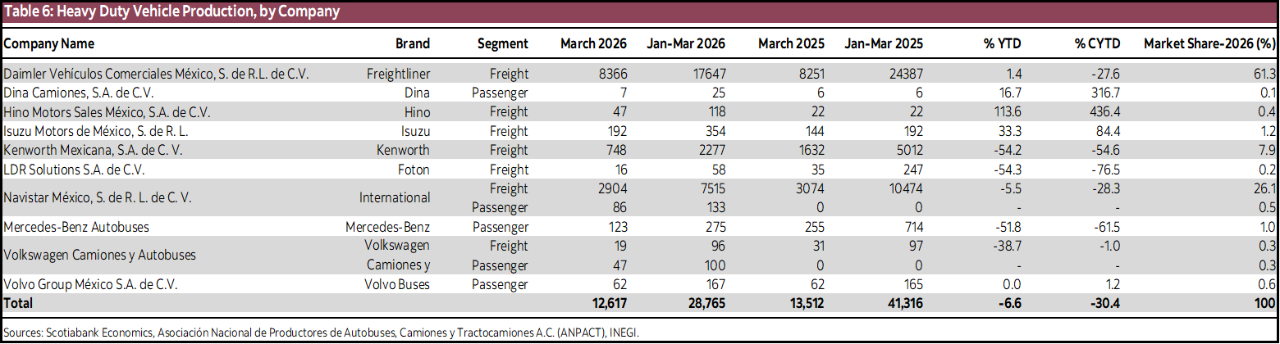
Finally, production remained weak. In March, 12.6k heavy vehicles were produced (table 6), representing a year-over-year decline of 6.6% and marking 16 consecutive months of contraction. Year-to-date production totaled 26.4k units, implying an accumulated annual decline of 36.1%, positioning Q1-2026 as one of the weakest starts of the year on record for heavy vehicle production. As with sales, this outcome reflects an adverse domestic environment in which stagnant investment continues to limit a sustained recovery.
Effects of the Decline in Gross Fixed Investment on Heavy Vehicles
The weakness observed in the heavy vehicle sector over recent quarters is closely linked to the deterioration of Gross Fixed Investment (GFI). Since September 2024, investment has remained in negative territory (chart 4), with machinery and equipment accumulating thirteen consecutive months of declines—particularly within the transportation subcomponent, both domestic and imported. This component is especially relevant, as the acquisition of trucks, buses, and tractor-trailers represents a core form of productive investment for transportation, logistics, and industrial firms. At the domestic level, average declines of around 8.0% in the transportation subcomponent have been recorded since December 2024.
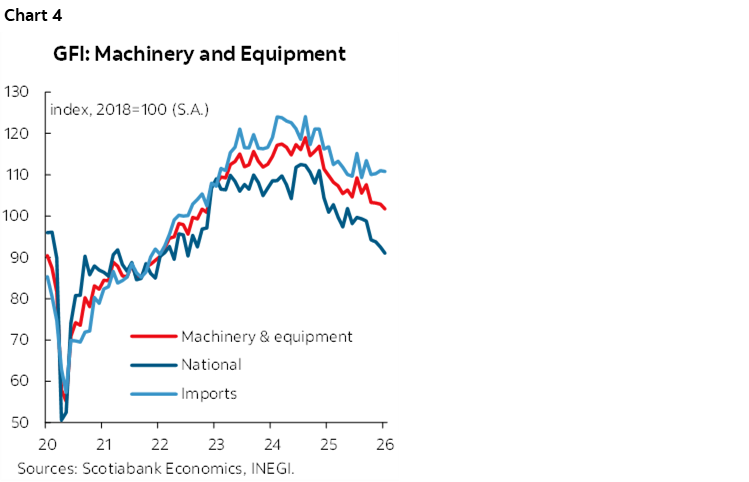
This context reveals a significant structural constraint. Lower investment reduced the acquisition of new units, leading to lower production and, in turn, reinforcing the contraction in Gross Fixed Investment itself, generating a negative feedback loop for the industry.
In response to this adverse dynamic, on March 26th, 2026, the Mexican government announced the Immediate Action Program for the Protection of the Heavy Vehicle Industry, led by the Ministry of Economy. The program includes MXN 2.0 billion in fiscal incentives and MXN 250 million in credit guarantees through Nafin, with the potential to mobilize up to MXN 6.0 billion in total financing. The program’s design directly targets the main bottlenecks affecting GFI in this segment.
Key instruments include immediate deduction of fixed assets, allowing the purchase of new heavy vehicles to be deducted in a single year—up to 86% of the vehicle’s value—thereby accelerating investment decisions and reactivating this component of GFI. The program also facilitates credit access for “owner-operators” (micro-enterprises operating fleets of one to five trucks) and SMEs, through public guarantees that reduce banking risk and address one of the main investment constraints: limited access to financing. Additional measures include tighter controls on used vehicle imports through updated reference prices, and the implementation of a new Official Mexican Safety Standard, encouraging fleet renewal and favouring the purchase of new vehicles produced domestically.
CONCLUSION
Overall, Mexico’s automotive industry showed a mixed performance during the first quarter of 2026. The light vehicle segment posted moderate gains in domestic sales, production, and exports, leading to a slight improvement in the sector’s aggregate balance compared to previous quarters. However, growth remains limited in absolute terms and faces significant risks linked to slowing private consumption, weak formal employment dynamics, and recent adjustments in market structure, particularly regarding imports and market share by country of origin.
In contrast, the heavy vehicle industry continues to experience a prolonged period of weakness, with no clear signs of a structural recovery. Recent improvements in some annual indicators reflect base effects stemming from the particularly weak start to 2025, rather than a genuine strengthening of activity. Persistent uncertainty, stagnant investment, and external risks—especially those related to the trade relationship with the United States—will continue to constrain a more dynamic recovery in the short and medium term, maintaining a low-growth environment for the automotive industry.
DISCLAIMER
This report has been prepared by Scotiabank Economics as a resource for the clients of Scotiabank. Opinions, estimates and projections contained herein are our own as of the date hereof and are subject to change without notice. The information and opinions contained herein have been compiled or arrived at from sources believed reliable but no representation or warranty, express or implied, is made as to their accuracy or completeness. Neither Scotiabank nor any of its officers, directors, partners, employees or affiliates accepts any liability whatsoever for any direct or consequential loss arising from any use of this report or its contents.
These reports are provided to you for informational purposes only. This report is not, and is not constructed as, an offer to sell or solicitation of any offer to buy any financial instrument, nor shall this report be construed as an opinion as to whether you should enter into any swap or trading strategy involving a swap or any other transaction. The information contained in this report is not intended to be, and does not constitute, a recommendation of a swap or trading strategy involving a swap within the meaning of U.S. Commodity Futures Trading Commission Regulation 23.434 and Appendix A thereto. This material is not intended to be individually tailored to your needs or characteristics and should not be viewed as a “call to action” or suggestion that you enter into a swap or trading strategy involving a swap or any other transaction. Scotiabank may engage in transactions in a manner inconsistent with the views discussed this report and may have positions, or be in the process of acquiring or disposing of positions, referred to in this report.
Scotiabank, its affiliates and any of their respective officers, directors and employees may from time to time take positions in currencies, act as managers, co-managers or underwriters of a public offering or act as principals or agents, deal in, own or act as market makers or advisors, brokers or commercial and/or investment bankers in relation to securities or related derivatives. As a result of these actions, Scotiabank may receive remuneration. All Scotiabank products and services are subject to the terms of applicable agreements and local regulations. Officers, directors and employees of Scotiabank and its affiliates may serve as directors of corporations.
Any securities discussed in this report may not be suitable for all investors. Scotiabank recommends that investors independently evaluate any issuer and security discussed in this report, and consult with any advisors they deem necessary prior to making any investment.
This report and all information, opinions and conclusions contained in it are protected by copyright. This information may not be reproduced without the prior express written consent of Scotiabank.
™ Trademark of The Bank of Nova Scotia. Used under license, where applicable.
Scotiabank, together with “Global Banking and Markets”, is a marketing name for the global corporate and investment banking and capital markets businesses of The Bank of Nova Scotia and certain of its affiliates in the countries where they operate, including; Scotiabank Europe plc; Scotiabank (Ireland) Designated Activity Company; Scotiabank Inverlat S.A., Institución de Banca Múltiple, Grupo Financiero Scotiabank Inverlat, Scotia Inverlat Casa de Bolsa, S.A. de C.V., Grupo Financiero Scotiabank Inverlat, Scotia Inverlat Derivados S.A. de C.V. – all members of the Scotiabank group and authorized users of the Scotiabank mark. The Bank of Nova Scotia is incorporated in Canada with limited liability and is authorised and regulated by the Office of the Superintendent of Financial Institutions Canada. The Bank of Nova Scotia is authorized by the UK Prudential Regulation Authority and is subject to regulation by the UK Financial Conduct Authority and limited regulation by the UK Prudential Regulation Authority. Details about the extent of The Bank of Nova Scotia's regulation by the UK Prudential Regulation Authority are available from us on request. Scotiabank Europe plc is authorized by the UK Prudential Regulation Authority and regulated by the UK Financial Conduct Authority and the UK Prudential Regulation Authority.
Scotiabank Inverlat, S.A., Scotia Inverlat Casa de Bolsa, S.A. de C.V, Grupo Financiero Scotiabank Inverlat, and Scotia Inverlat Derivados, S.A. de C.V., are each authorized and regulated by the Mexican financial authorities.
Not all products and services are offered in all jurisdictions. Services described are available in jurisdictions where permitted by law.