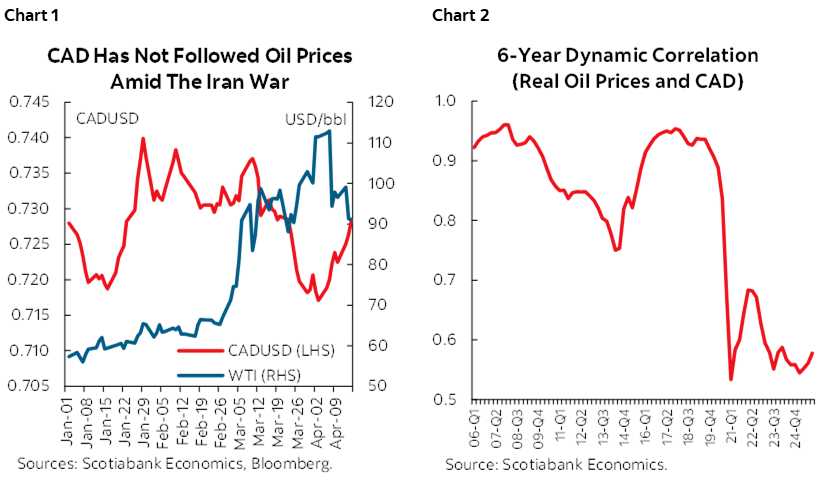
- The relationship between the Canadian dollar and oil prices has weakened materially over the past decade, and the current episode is no exception. Despite a sharp rise in oil prices amid the Iran war, the CAD response has been largely muted.
- The apparent decoupling does not imply the relationship has disappeared. There remains a meaningful underlying link between oil and the CAD, but not all oil shocks matter equally: our analysis shows the CAD responds significantly more to demand‑driven oil price increases than to supply‑driven ones.
- Once the source of oil price movements is taken into account, the decoupling is largely explained. Controlling for oil supply versus demand shocks—alongside interest rate differentials and broad USD dynamics—fully accounts for the decline in the oil–CAD correlation, without the need to invoke time‑varying elasticities or structural breaks.
- Implications: CAD upside remains limited in supply‑led oil rallies. By and large, the combination of supply‑driven oil gains, weak global demand, and US dollar safe‑haven flows argues for a subdued CAD response in the current environment.
CAD AND OIL: A RELATIONSHIP THAT HAS WEAKENED
The Canadian dollar has historically been one of the currencies closely linked to oil prices. As a major energy exporter, Canada typically benefits from higher oil prices through improved terms of trade, stronger export receipts and increased energy investment. In that framework, rising oil prices mechanically translate into stronger demand for CAD and, ultimately, currency appreciation.
Yet recent price action has once again challenged this assumption. Despite a sharp rally in oil prices, the USD/CAD barely budged (chart 1). While striking, this episode is not an anomaly. In fact, the oil–CAD relationship has been weakening steadily for more than a decade. We can see this visually in chart 2, with the rolling 6-year dynamic correlation between the CAD and oil prices. The relationship was once very strong, but it deteriorated sharply from the mid‑2010s onward and has remained structurally lower since.
The conventional explanation points to structural change in the Canadian economy. Following the 2014–2015 oil price collapse, investment in the energy sector fell sharply and never recovered to prior peaks. As a share of GDP, oil‑related investment has declined materially, reducing the macroeconomic leverage of oil price swings. In that sense, Canada has become less “oil‑intensive” than in previous cycles.
Structural changes in the Canadian economy is the traditional narrative for the weakening in the correlation between oil and the CAD, but other forces may have been at play simultaneously. For example, there could have been movements in the US dollar and/or movements in interest rate differentials that could explain the disconnect. Also, the source of oil price movement may matter. Supply‑driven price spikes may be perceived as temporary, generating limited investment responses, thus leading to smaller response of the CAD. Demand‑driven rallies, by contrast, tend to signal stronger global growth and sustained income effects—conditions that are far more CAD‑supportive. Moreover, oil markets are often hit by multiple shocks at the same time, with positive and negative forces offsetting one another but could impact differently CAD dynamics.
This is what we explore next. First, we need a method to distinguish between supply‑ and demand‑driven oil shocks.
IDENTIFYING OIL SUPPLY AND DEMAND SHOCKS
To disentangle the drivers of oil price movements, we estimate a structural model of the global oil market. Consistent with the literature, we rely on a sign‑restricted structural VAR (SR‑SVAR), which is both transparent and well‑suited to historical interpretation.1 The model includes four key variables: 1) global oil production, 2) global real GDP (detrended), the real price of oil (WTI), and changes in above-ground oil inventories (we use US inventories for proxy).
Because structural shocks are not directly observable, we need an identification strategy, and this is where the sign restrictions technique comes handy. Intuitively, we impose that specific shocks can only move variables (on impact) in a certain way. The estimation procedure generates many models and only keeps the ones that are consistent with these restrictions. We then take the median of these admissible models as the true model and recover the distribution of historical shock.
In the context of the oil market, we identify three structural shocks, using the following restrictions (table 1 shows the identification matrix):
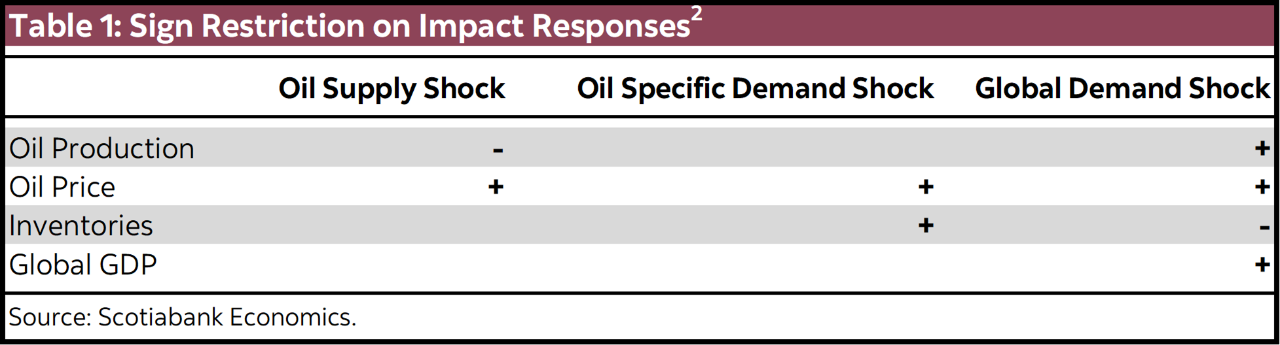
1. Oil supply shock: lowers oil production and raises oil prices. Inventories and global activity are unrestricted to this shock.
2. Oil-specific demand shock: precautionary or speculative demand that raises both inventories and prices.
3. Global demand shock: stronger global activity that lifts production and prices while drawing down inventories.
A fourth residual shock is left unrestricted and captures remaining noise in oil price dynamics.
The resulting decomposition of oil prices dynamics into supply and demand components is shown in chart 3. For simplicity, we combine the contribution of the two demand shocks, and the contribution of the supply shock with the residual shock. The historical decomposition appears economically plausible and aligns closely with the narrative commonly used to interpret major oil market events.
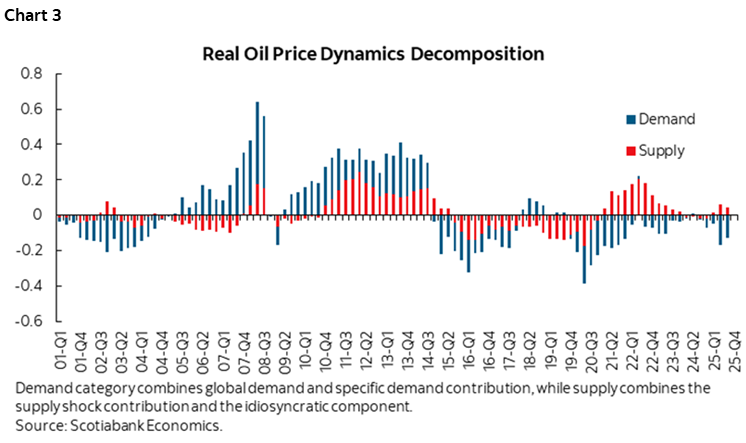
- The 2000–2008 oil rally was overwhelmingly demand‑driven, reflecting strong global growth.
- The collapse during the Global Financial Crisis is identified primarily as a negative demand shock.
- The 2014–2015 oil price decline was dominated by a supply shock, consistent with the shale boom, although weaker demand also played an important role.
- More recently, the spike associated with the Ukraine invasion is identified largely as a supply disruption.
This gives us confidence that the model captures well the dominant forces shaping oil price movements.
CAD SENSITIVITY DEPENDS ON THE TYPE OF OIL SHOCK
Having separated oil prices into supply and demand components, we can now examine how the Canadian dollar reacts to these movements. For this, we estimate a simple long‑run USD/CAD equation in which the exchange rate depends on:
- Oil price contributions from supply and demand shocks (shown in chart 3),
- The US–Canada short‑rate differential, and
- A US dollar factor capturing broad USD movements and flight‑to‑quality effects.
We compare this specification with a simpler model that replaces the supply and demand contribution with the oil price level. Importantly, we do not impose breaks or time-varying coefficients (see table 2 for estimation results).
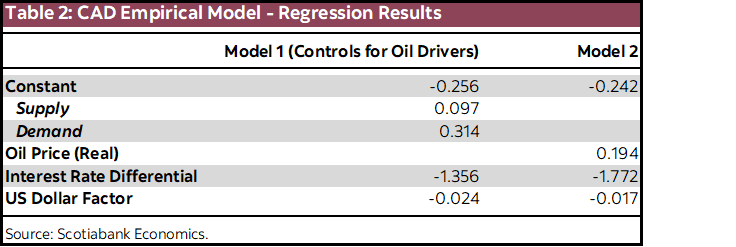
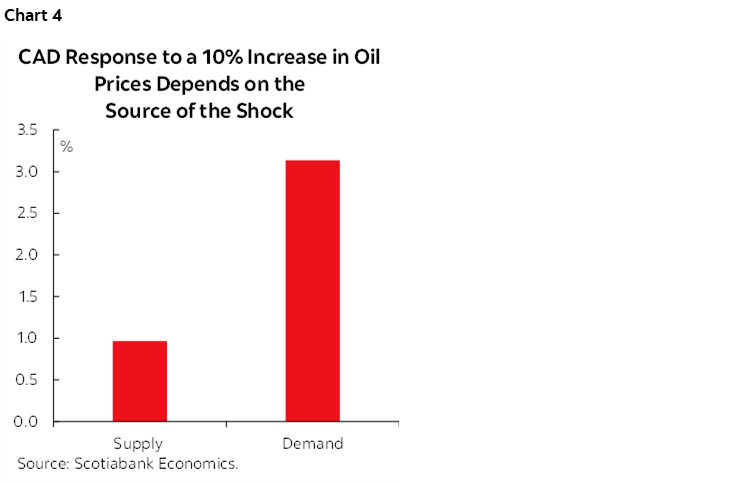
The results reveal a clear asymmetry. The CAD reacts much more strongly to demand‑driven oil price increases than to supply‑driven ones. In fact, the sensitivity to supply (and idiosyncratic) shocks is roughly half that of demand shocks.3 For a 10% increase in the price of oil that comes from supply, the model predicts there should be an appreciation of about 1%, while it should be closer to 3% if it came from demand factors (chart 4). This likely reflects weaker investment and income responses to supply‑driven oil rallies, which are often viewed as transitory and associated with elevated uncertainty. VAR impulse responses confirm that business investment responds far less to supply‑driven oil price increases than to demand‑driven ones especially in the near term (see Appendix). We also find oil supply shocks lead to an increase in the VIX, while a demand shocks lead to a decline in the VIX, consistent with the idea that supply shocks are often associated with negative confidence effects. Controlling for the source of oil price movements also reshapes the role of other fundamentals: the estimated impact of interest rate differentials declines, while the influence of the US dollar factor increases.
EXPLAINING THE APPARENT DECOUPLING
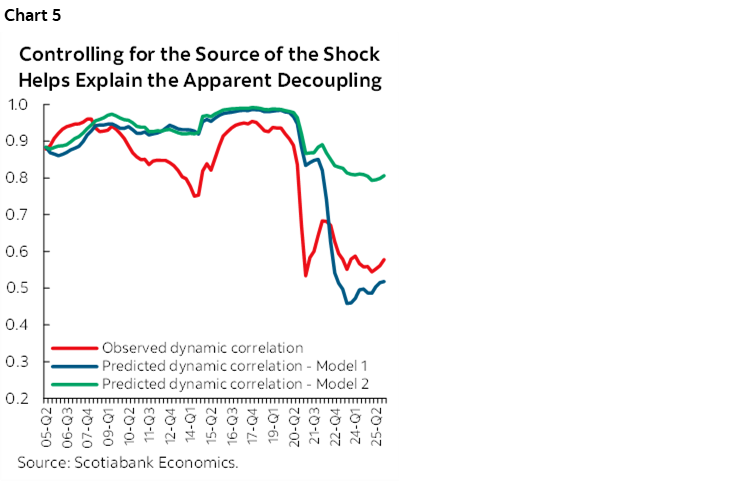
Perhaps the most striking result is that this simple framework can replicate the observed decline in the CAD–oil correlation. Chart 5 compares the actual rolling correlation with the correlation implied by the models in table 2. Despite constant elasticities, Model 1 generates a sharp drop in the correlation, mirroring the data. In other words, the apparent decoupling does not require a breakdown in economic relationships—it emerges naturally once we control for the source of oil shocks and other macro drivers. This is because supply‑driven oil rallies are less CAD‑supportive, but also because offsetting forces matter. The Ukraine war episode is a prime example: oil prices surged on supply disruptions, while global demand was weak and risk aversion elevated—factors that constrained CAD gains. Interestingly, Model 2 also predicts some decline in the correlation (green line) despite not distinguishing between supply and demand contribution. This highlights the role played by USD dynamics and rate differentials in the decoupling.
IMPLICATIONS FOR THE OUTLOOK
What does this mean for the CAD in the context of the Iran war? While we do not yet have the data to extract structural shocks, it is reasonable to expect a large negative supply shock to oil prices (with potentially an idiosyncratic element), and partially offset by weaker global demand and some flight to safety in favour of the US dollar. By and large, the combination of a weak response to supply shocks, a negative impulse from weaker global demand, and flight‑to‑safety for the US dollar could explain the lack of CAD response in the current episode.
This analysis therefore supports our view that the CAD response to the current oil rally is likely to remain subdued. That said, it also suggests that despite the apparent decoupling between the CAD and oil prices, the link has not completely disappeared. Should future oil price gains be driven more clearly by global demand, the correlation could re‑emerge.
1 The model used here is largely borrowed from Kilian and Murphy (2014), and is similar in spirit to Ellwanger (2019).
2 Following the literature, we also apply a bound on the impact price elasticity. This is to ensure that the price elasticity is closer to micro evidence. This helps narrow down the number of admissible models.
3 When we estimate the same relationship separately over the pre-2015 sample, the asymmetry remains broadly unchanged, implying that this is not a new phenomenon that appeared after the 2015 oil shock.
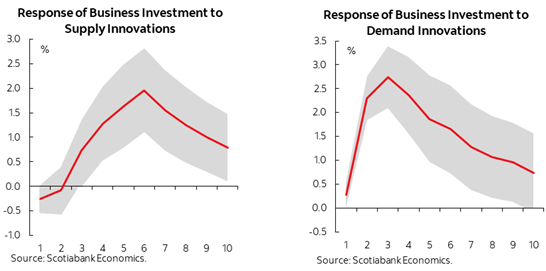
APPENDIX — CANADIAN BUSINESS INVESTMENT RESPONSE TO DEMAND VS SUPPLY SHOCKS
To evaluate how various oil shocks affect the economy, a two-step methodology is applied. First, shocks are extracted from the SR-SVAR, as previously described. Second, a SVAR identified with short-run restrictions is conducted, incorporating the oil shock and a variable of interest. Interest rate and inflation are included as control variables.
The chart below illustrates the asymmetrical response of Canadian business investment to supply and demand shocks. The investment reaction to a pure supply shock is depicted in the chart on the left, whereas the response to a global demand shock is shown in the chart on the right. Notably, in the near term, a demand shock prompts a significantly larger reaction from Canadian business investment compared to a supply shock.
DISCLAIMER
This report has been prepared by Scotiabank Economics as a resource for the clients of Scotiabank. Opinions, estimates and projections contained herein are our own as of the date hereof and are subject to change without notice. The information and opinions contained herein have been compiled or arrived at from sources believed reliable but no representation or warranty, express or implied, is made as to their accuracy or completeness. Neither Scotiabank nor any of its officers, directors, partners, employees or affiliates accepts any liability whatsoever for any direct or consequential loss arising from any use of this report or its contents.
These reports are provided to you for informational purposes only. This report is not, and is not constructed as, an offer to sell or solicitation of any offer to buy any financial instrument, nor shall this report be construed as an opinion as to whether you should enter into any swap or trading strategy involving a swap or any other transaction. The information contained in this report is not intended to be, and does not constitute, a recommendation of a swap or trading strategy involving a swap within the meaning of U.S. Commodity Futures Trading Commission Regulation 23.434 and Appendix A thereto. This material is not intended to be individually tailored to your needs or characteristics and should not be viewed as a “call to action” or suggestion that you enter into a swap or trading strategy involving a swap or any other transaction. Scotiabank may engage in transactions in a manner inconsistent with the views discussed this report and may have positions, or be in the process of acquiring or disposing of positions, referred to in this report.
Scotiabank, its affiliates and any of their respective officers, directors and employees may from time to time take positions in currencies, act as managers, co-managers or underwriters of a public offering or act as principals or agents, deal in, own or act as market makers or advisors, brokers or commercial and/or investment bankers in relation to securities or related derivatives. As a result of these actions, Scotiabank may receive remuneration. All Scotiabank products and services are subject to the terms of applicable agreements and local regulations. Officers, directors and employees of Scotiabank and its affiliates may serve as directors of corporations.
Any securities discussed in this report may not be suitable for all investors. Scotiabank recommends that investors independently evaluate any issuer and security discussed in this report, and consult with any advisors they deem necessary prior to making any investment.
This report and all information, opinions and conclusions contained in it are protected by copyright. This information may not be reproduced without the prior express written consent of Scotiabank.
™ Trademark of The Bank of Nova Scotia. Used under license, where applicable.
Scotiabank, together with “Global Banking and Markets”, is a marketing name for the global corporate and investment banking and capital markets businesses of The Bank of Nova Scotia and certain of its affiliates in the countries where they operate, including; Scotiabank Europe plc; Scotiabank (Ireland) Designated Activity Company; Scotiabank Inverlat S.A., Institución de Banca Múltiple, Grupo Financiero Scotiabank Inverlat, Scotia Inverlat Casa de Bolsa, S.A. de C.V., Grupo Financiero Scotiabank Inverlat, Scotia Inverlat Derivados S.A. de C.V. – all members of the Scotiabank group and authorized users of the Scotiabank mark. The Bank of Nova Scotia is incorporated in Canada with limited liability and is authorised and regulated by the Office of the Superintendent of Financial Institutions Canada. The Bank of Nova Scotia is authorized by the UK Prudential Regulation Authority and is subject to regulation by the UK Financial Conduct Authority and limited regulation by the UK Prudential Regulation Authority. Details about the extent of The Bank of Nova Scotia's regulation by the UK Prudential Regulation Authority are available from us on request. Scotiabank Europe plc is authorized by the UK Prudential Regulation Authority and regulated by the UK Financial Conduct Authority and the UK Prudential Regulation Authority.
Scotiabank Inverlat, S.A., Scotia Inverlat Casa de Bolsa, S.A. de C.V, Grupo Financiero Scotiabank Inverlat, and Scotia Inverlat Derivados, S.A. de C.V., are each authorized and regulated by the Mexican financial authorities.
Not all products and services are offered in all jurisdictions. Services described are available in jurisdictions where permitted by law.