EXECUTIVE SUMMARY
- As a net oil exporter, Canada typically benefits from higher oil prices, but is there a point when the gains diminish or disappear?
- Our results confirm that higher oil prices remain a net positive for activity at current levels, but the macro payoff diminishes as prices rise.
- We find evidence that once oil prices move into the US$120–US$130 range (in 2026 dollars), they no longer provide a statistically meaningful boost to Canadian activity.
- These estimates should be interpreted with caution: Rather than a precise tipping point, this range is better viewed as an indicative zone where the positive relationship becomes markedly less clear.
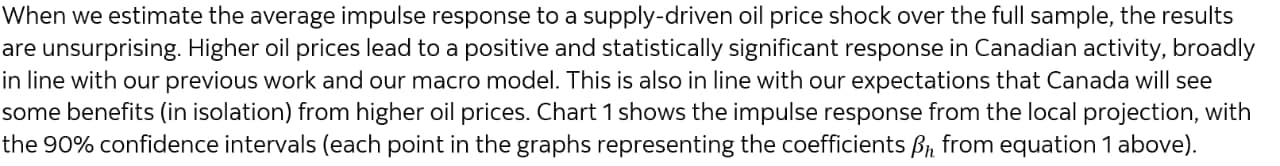
Oil prices have risen sharply amid the Iran war, and this has reignited debate around what higher oil prices mean for Canada. At a basic level, the story is well understood. Higher oil prices improve Canada’s terms of trade, raise national income, and typically support investment and employment. However, the relationship between oil prices and Canadian macro outcomes has clearly weakened over time as investment in the oil and gas sector declined. As we showed in our previous note, the correlation between the Canadian dollar and oil prices has also declined in the last decade.
The distinction between supply and demand matters in the current episode. Today’s oil rally is largely supply-led, which mechanically delivers a smaller boost to domestic activity. Indeed, the Bank of Canada has emphasized that the near-term macro impact of the recent oil price increase will likely be modest. That raises a deeper question: When the relationship between oil and Canada has already weakened and the price surge is mainly supply-led, could higher oil prices eventually become neutral, or even negative, for the Canadian economy? Put differently: Is there a level of oil prices beyond which Canada no longer benefits?
COULD OIL PRICES BE NEUTRAL FOR CANADA?
In a purely linear world, the answer would be no. As a net oil exporter, any increase in oil prices would always be positive for Canada. The improvement in the terms of trade would outweigh the negative effects of slightly lower volumes, given how inelastic oil demand is.
But that logic rests on the assumption that foreign demand remains resilient in the face of an oil supply shock. Once oil prices are high enough to begin weighing materially on global activity, especially among Canada’s trading partners, the impact could change.
Simple simulations of our own macro model highlight this trade-off. For a 10% increase in oil prices, we would need foreign demand for Canadian goods to fall by roughly 0.5% for the net impact on Canada to turn negative. While this figure is not exceptionally large in isolation and appears plausible, it is less likely to occur when oil prices are around US$100. Indeed, higher oil prices can still be expansionary for the U.S. economy at those levels, abstracting from financial market volatility and confidence effects related to geopolitical risks. Nonetheless, this underscores that the Canadian economy’s response to oil price changes may not be uniform. The impact when oil is priced at US$60 may diverge significantly from the impact when oil is at US$120. This raises the question: Is there a sweet spot after which oil price increases no longer benefit the Canadian economy?
OUR TWO-STEP EMPIRICAL STRATEGY
To examine whether the response of the Canadian economy to oil supply shocks depends on the level of oil prices, we adopt an empirical strategy that allows explicitly for nonlinear effects. Our approach combines two complementary frameworks that are now standard in the literature. First, we use a structural VAR (SVAR) of the global oil market to identify oil shocks. In a second step, we use local projections to trace their dynamic impact on the Canadian economy.
In a recent note, we estimated a sign-restricted SVAR of the global oil market to disentangle the underlying drivers of oil price movements. The model includes global oil production, global real activity, real oil prices (WTI deflated by the U.S. GDP deflator), and oil inventories, and identifies three structural disturbances: (1) Oil supply shocks, (2) oil-specific demand shocks, and (3) global demand shocks. This framework allows us to recover shocks that are both economically interpretable and historically plausible. Importantly, it enables us to distinguish between oil price increases driven by supply disruptions and those reflecting stronger global demand conditions. This distinction is critical from a Canadian macro perspective: Demand-driven oil price increases tend to be associated with stronger global activity and, therefore, have a larger positive impact on Canadian GDP, whereas supply-driven increases typically act as a positive terms-of-trade shock but are associated with weaker global demand, partially offsetting the positive terms-of-trade lift. Since the recent rise in oil prices is a supply-driven shock, this decomposition is particularly relevant.
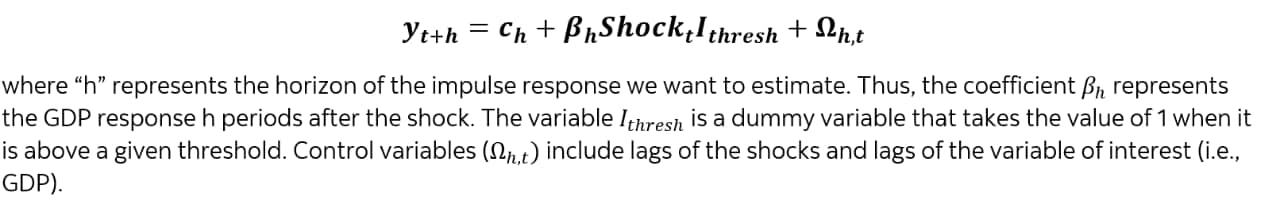
Having identified the structural oil supply shocks, we then turn to local projections to estimate their macroeconomic effects in Canada. Local projections provide a flexible framework for estimating impulse responses, particularly when allowing for nonlinearities or state dependence. To assess whether the impact of oil shocks varies with the level of oil prices, we extend this framework to incorporate threshold effects. Specifically, we allow the response of GDP to an oil supply shock to depend on whether oil prices are above or below a given threshold. By estimating impulse responses across a range of thresholds, we can trace how the sensitivity of the economy evolves as oil prices increase. This approach enables us to move beyond an average effect and instead characterize how the transmission of oil shocks changes across different price regimes.
More formally, local projection consists of a series of regressions of our variable of interest (GDP) on an identified shock (the oil supply shock):
IS THERE A “SWEET SPOT” PRICE FOR OIL?
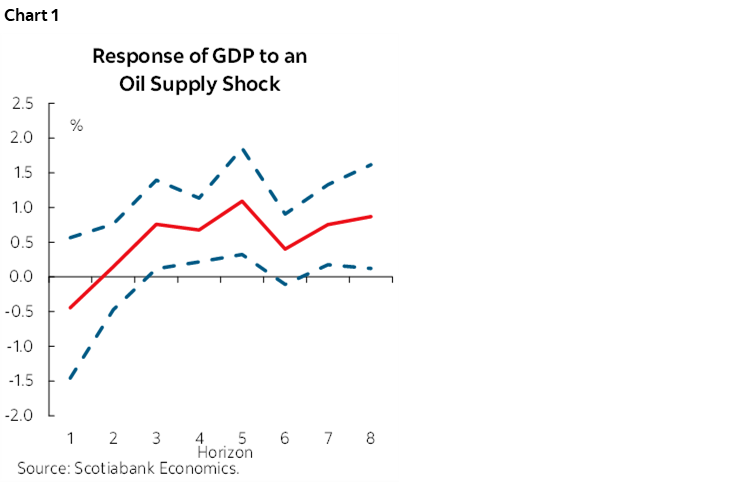
However, our results point to some non‑linear effects. When we restrict the analysis to periods where oil prices are above US$135 (in 2026 dollars), the picture is different.1 The response of Canadian activity becomes statistically indistinguishable from zero (chart 2). In other words, once oil prices move into very elevated territory, the traditional positive macro effect appears to fade.
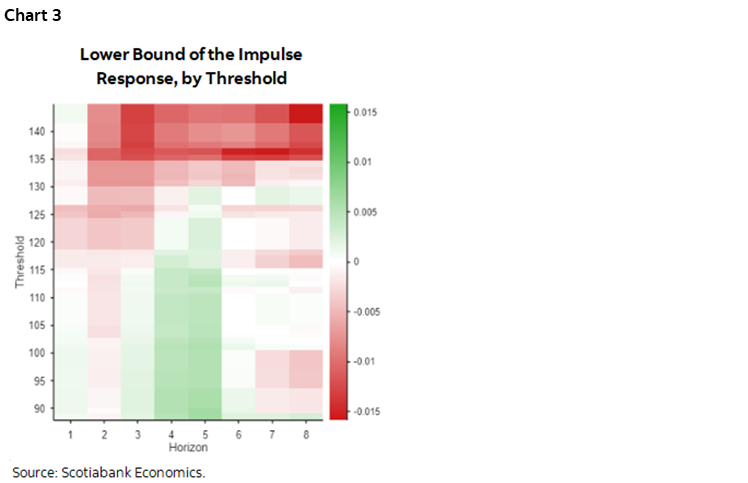
Chart 3 shows the resulting heat map of the lower bound of the impulse responses across horizons and all thresholds we estimated. The X axis represents the number of quarters after the shock hits (the horizon of the impulse response), and the Y axis shows the oil price threshold. Green means a positive response of Canadian GDP, thus statistically above 0, and red means negative. A negative lower bound means that we can no longer see the statistically significant positive benefits. At the lower end of the threshold range, the impact is positive throughout the horizon, indicating that the economy responds clearly positively when oil prices are above US$80. However, as prices rise toward US$120, the positive effect becomes less evident, and by US$130 the response is clearly no longer statistically distinguishable from zero.
This pattern is consistent with the idea that the negative global demand effects eventually dominate. At sufficiently high oil prices, the drag on oil‑importing economies—and perhaps on sentiment and financial conditions—begins to offset the income gains accruing to oil exporters like Canada.
However, like any empirical work, especially non-linear work, important caveats apply. Inference in threshold local projections is challenging, and it is difficult to establish whether impulse responses at different thresholds are statistically distinct from one another. Moreover, there is actual uncertainty about the oil shock itself, and different specifications of the SVAR could lead to different results. Finally, and perhaps more importantly, very high oil prices occur only sporadically in the data. The estimates at the upper end of the distribution rely on a small number of observations. For these reasons, we do not view the US$120–US$130 range as a precise tipping point. Rather, it should be seen as an indicative zone where the positive relationship between oil prices and Canadian activity becomes markedly less clear.
BOTTOM LINE
Higher oil prices remain a small net positive for Canada, but not without limits. At very high price levels, the negatives, which may come from lower global demand and/or tighter financial conditions, become large enough that the traditional terms‑of‑trade benefits may no longer dominate. While our results are necessarily tentative, they suggest that the Canadian economy does have a “sweet spot” for oil prices at around US$120–US$130 in today’s dollars and that pushing well beyond it comes with diminishing, and potentially negative, macro returns.
1 The thresholds are defined with real oil prices in the local projection, but are then expressed in 2026 dollars for ease of exposition.
DISCLAIMER
This report has been prepared by Scotiabank Economics as a resource for the clients of Scotiabank. Opinions, estimates and projections contained herein are our own as of the date hereof and are subject to change without notice. The information and opinions contained herein have been compiled or arrived at from sources believed reliable but no representation or warranty, express or implied, is made as to their accuracy or completeness. Neither Scotiabank nor any of its officers, directors, partners, employees or affiliates accepts any liability whatsoever for any direct or consequential loss arising from any use of this report or its contents.
These reports are provided to you for informational purposes only. This report is not, and is not constructed as, an offer to sell or solicitation of any offer to buy any financial instrument, nor shall this report be construed as an opinion as to whether you should enter into any swap or trading strategy involving a swap or any other transaction. The information contained in this report is not intended to be, and does not constitute, a recommendation of a swap or trading strategy involving a swap within the meaning of U.S. Commodity Futures Trading Commission Regulation 23.434 and Appendix A thereto. This material is not intended to be individually tailored to your needs or characteristics and should not be viewed as a “call to action” or suggestion that you enter into a swap or trading strategy involving a swap or any other transaction. Scotiabank may engage in transactions in a manner inconsistent with the views discussed this report and may have positions, or be in the process of acquiring or disposing of positions, referred to in this report.
Scotiabank, its affiliates and any of their respective officers, directors and employees may from time to time take positions in currencies, act as managers, co-managers or underwriters of a public offering or act as principals or agents, deal in, own or act as market makers or advisors, brokers or commercial and/or investment bankers in relation to securities or related derivatives. As a result of these actions, Scotiabank may receive remuneration. All Scotiabank products and services are subject to the terms of applicable agreements and local regulations. Officers, directors and employees of Scotiabank and its affiliates may serve as directors of corporations.
Any securities discussed in this report may not be suitable for all investors. Scotiabank recommends that investors independently evaluate any issuer and security discussed in this report, and consult with any advisors they deem necessary prior to making any investment.
This report and all information, opinions and conclusions contained in it are protected by copyright. This information may not be reproduced without the prior express written consent of Scotiabank.
™ Trademark of The Bank of Nova Scotia. Used under license, where applicable.
Scotiabank, together with “Global Banking and Markets”, is a marketing name for the global corporate and investment banking and capital markets businesses of The Bank of Nova Scotia and certain of its affiliates in the countries where they operate, including; Scotiabank Europe plc; Scotiabank (Ireland) Designated Activity Company; Scotiabank Inverlat S.A., Institución de Banca Múltiple, Grupo Financiero Scotiabank Inverlat, Scotia Inverlat Casa de Bolsa, S.A. de C.V., Grupo Financiero Scotiabank Inverlat, Scotia Inverlat Derivados S.A. de C.V. – all members of the Scotiabank group and authorized users of the Scotiabank mark. The Bank of Nova Scotia is incorporated in Canada with limited liability and is authorised and regulated by the Office of the Superintendent of Financial Institutions Canada. The Bank of Nova Scotia is authorized by the UK Prudential Regulation Authority and is subject to regulation by the UK Financial Conduct Authority and limited regulation by the UK Prudential Regulation Authority. Details about the extent of The Bank of Nova Scotia's regulation by the UK Prudential Regulation Authority are available from us on request. Scotiabank Europe plc is authorized by the UK Prudential Regulation Authority and regulated by the UK Financial Conduct Authority and the UK Prudential Regulation Authority.
Scotiabank Inverlat, S.A., Scotia Inverlat Casa de Bolsa, S.A. de C.V, Grupo Financiero Scotiabank Inverlat, and Scotia Inverlat Derivados, S.A. de C.V., are each authorized and regulated by the Mexican financial authorities.
Not all products and services are offered in all jurisdictions. Services described are available in jurisdictions where permitted by law.