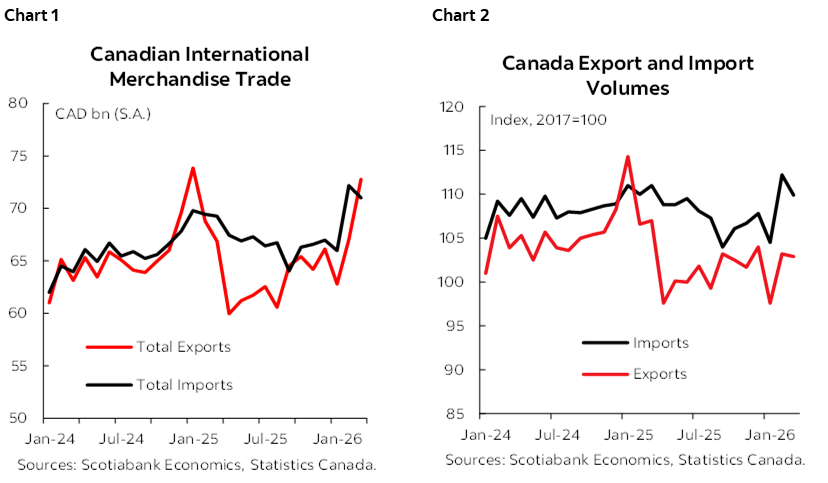
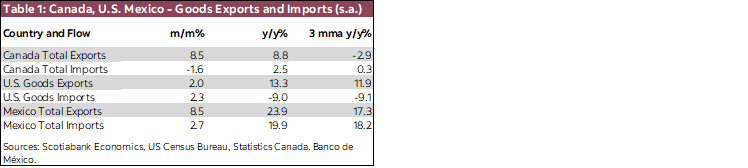
- Canada’s goods trade balance jumped back into surplus in March, with exports rising 8.5%(m/m) and imports falling 1.6% (chart 1). As has often been the case lately, gold was the dominant driver on the export side, though energy products also contributed—aided by the rise in oil prices since the start of the U.S.-Iran conflict. On the import side, most categories ticked lower after a strong February—with the notable exception of motor vehicles, reflecting the continued integration of supply chains in that sector. After adjusting for prices, export volumes rose 2.2% and imports were down 2.5% on the month (chart 2). The trade data have improved after a very weak January report, but net trade is still likely to drag on estimated Q1 growth. However, we expect a rebound in Q2.
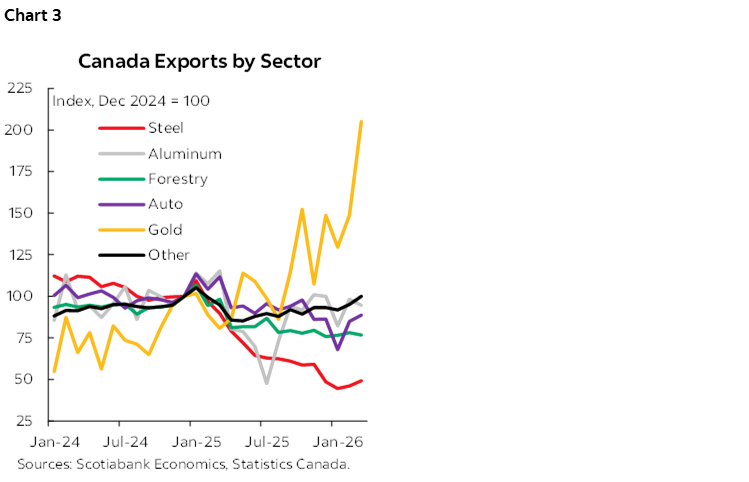
- The strong gold exports and higher energy prices are masking declines in some sectors. Exports are clearly lower in the goods categories targeted by the U.S. sectoral tariffs (chart 3) including: steel (-51% vs Dec 2024), aluminum (-5%), forestry (-23%), and motor vehicles and parts (-11%).
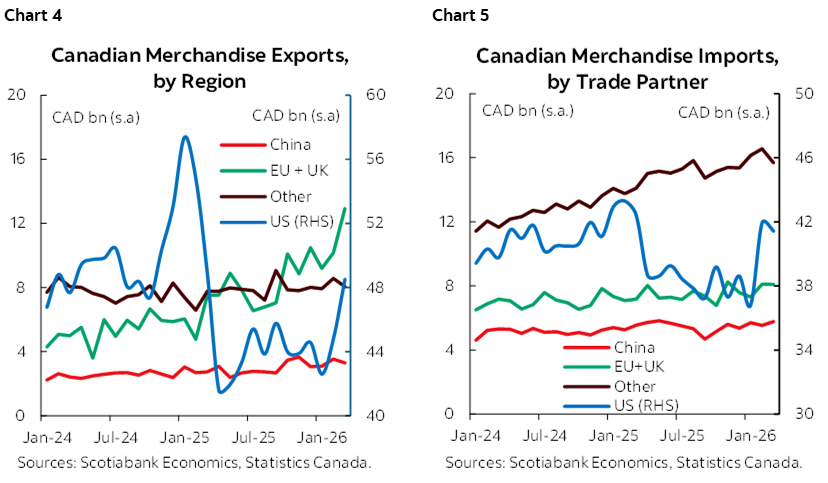
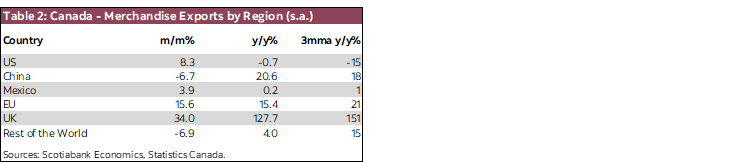
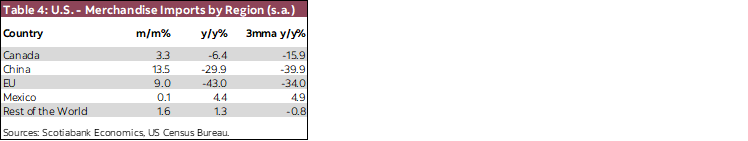
- The share of Canadian exports bound for the U.S. is gradually trending lower, averaging 76% in 2024 and 72% in 2025, and coming in at 67% in March 2026. This has been driven by a decline in exports to the U.S. and increasing exports to other regions—mainly Europe (chart 4). In March, exports to the U.S. rose 8.3% m/m but were down 1.3% compared to 2024. Exports to other countries rose 9.1% m/m and were up 55.2% from 2024—though much of this has been driven by elevated overseas exports of gold. On the import side (chart 5), the share of Canadian imports from the U.S. has gradually fallen to 58% in March from an average of 62% in 2024.
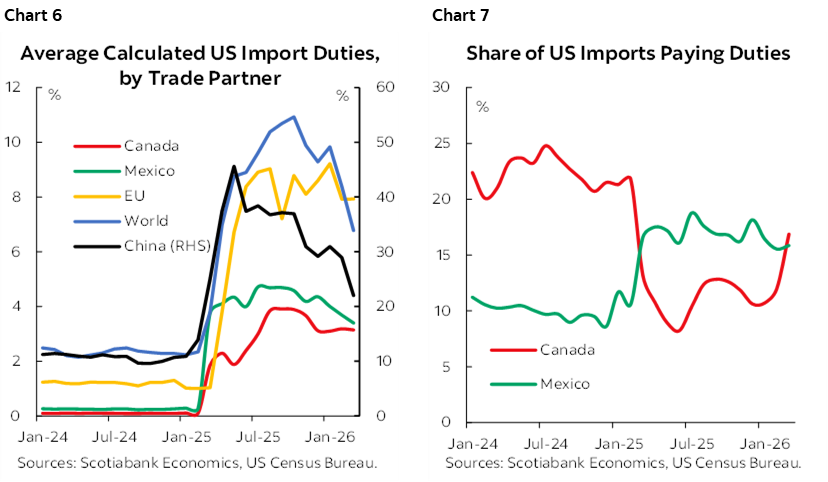
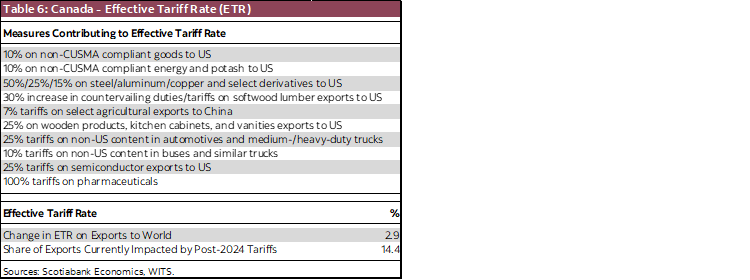
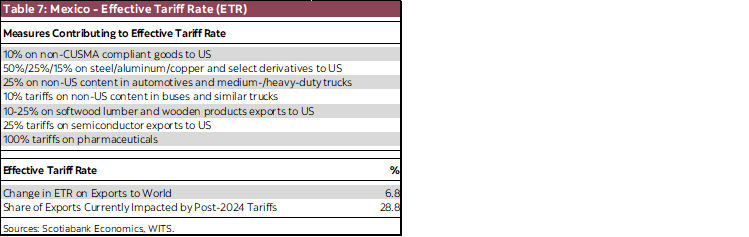
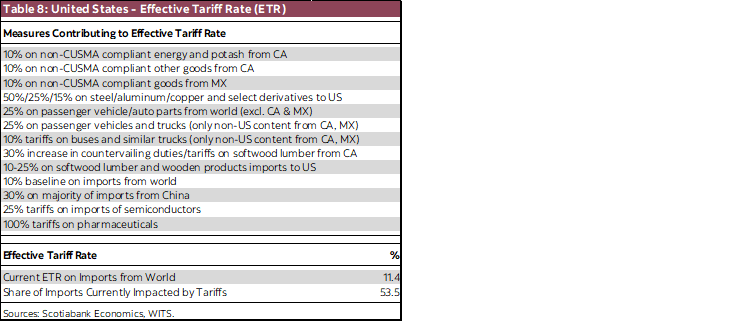
- Canada continues to benefit from a (relatively) low effective tariff rate on total exports. 2.9% is our latest estimate (based on pre-tariff trade flows) of the increase in tariffs since end-2024, thanks to most of our trade with the U.S. continuing on a tariff-free basis under CUSMA. This is down from 4.5% in February, following the replacement of the U.S. IEEPA tariffs with a 10% global tariff, as well as changes to steel and aluminum tariffs and the addition to pharmaceutical tariffs. The reported average actual duties paid on U.S. goods imports from Canada was slightly above 3% for the fourth month in a row, down from close to 4% six months ago (chart 6). The proportion of Canadian goods imported into the U.S. facing tariffs jumped from 12% to 17% in March (chart 7), in part due to an increase in Canadian exports of steel and aluminum to the U.S. in the month.
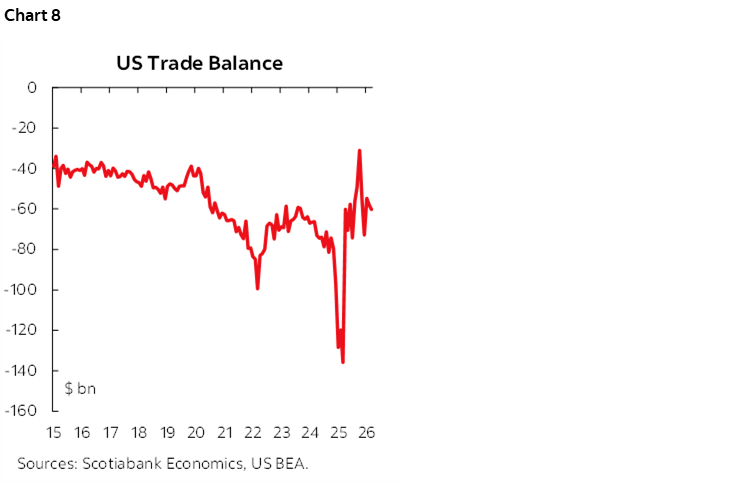
- The U.S. trade deficit is back close to its pre-tariff level (chart 8). U.S. trade saw significant volatility early in 2025 in response to the tariffs, before stabilizing later in the year. In March, U.S. exports rose 2.0% and imports increased 2.3%, resulting in an increase to the trade deficit to US$60 bn, down from around US$70bn in 2024.
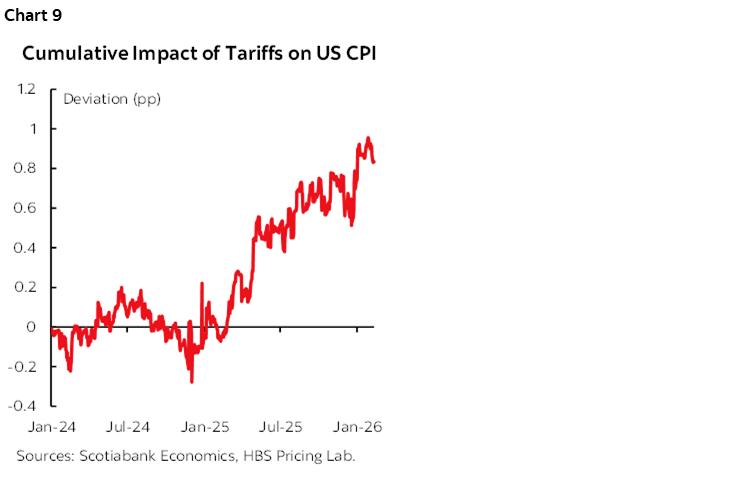
- The U.S. import tariffs continue to create inflationary pressures in that country, with the latest estimate of the cumulative impact of the tariffs on U.S. CPI reaching nearly a full percentage point (chart 9)—clouding the outlook for U.S. interest rate cuts, especially given recent increases in oil prices.
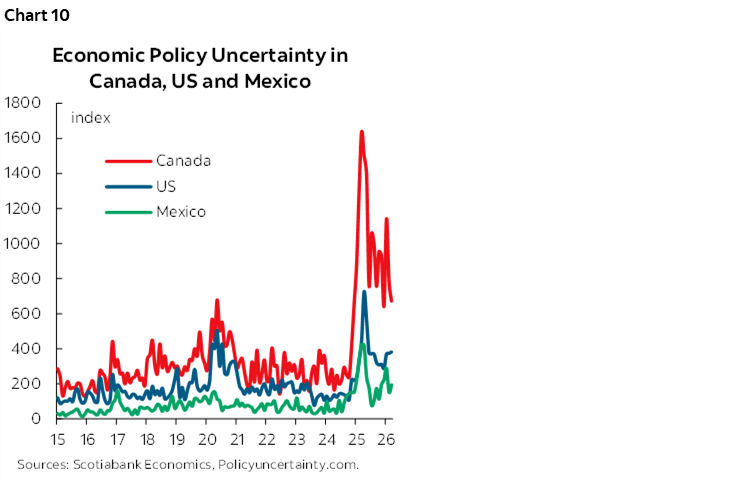
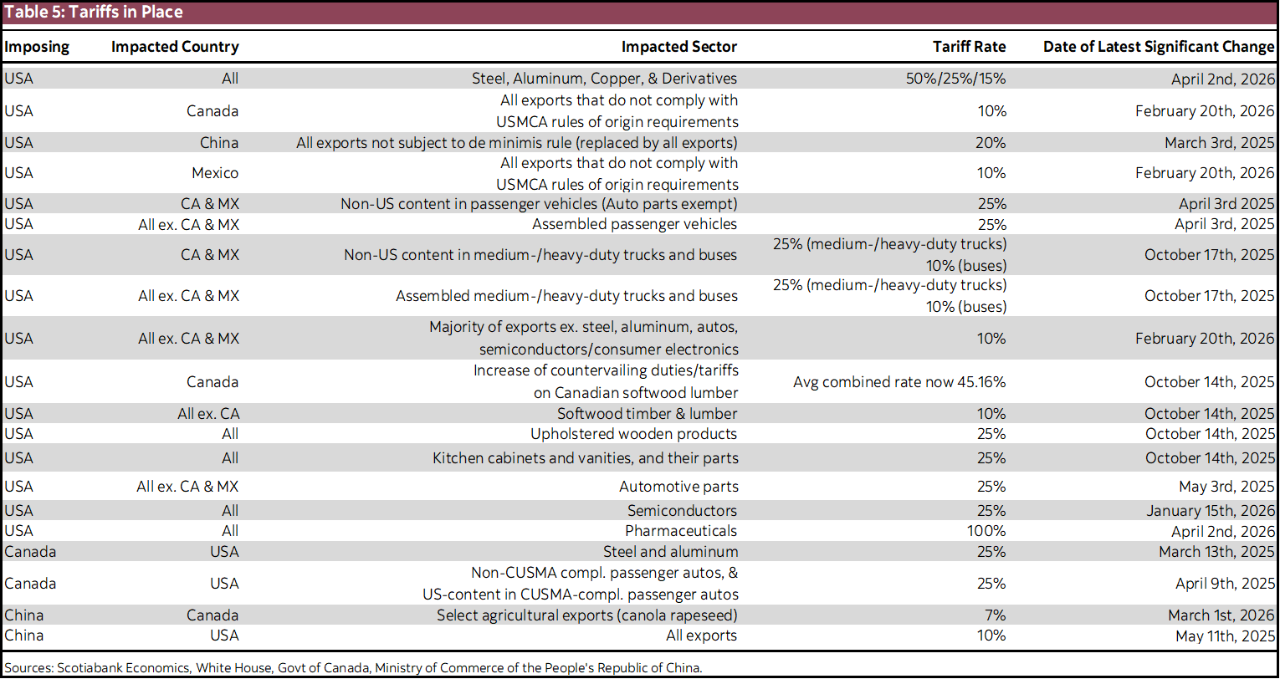
- Tariffs and uncertainty (chart 10) continue to be elevated and dynamic. Although the replacement of the U.S. IEEPA tariffs with the temporary global tariff of 10% was positive for Canada (and many other U.S. trade partners), the vast majority of our trade has been deemed CUSMA-compliant and thus exempt from those tariffs. The sectoral tariffs are by far the most impactful for Canada, and the recent U.S. changes to the steel and aluminum tariffs, as well as the addition of tariffs on pharmaceuticals, represent increased headwinds for these sectors.

DISCLAIMER
This report has been prepared by Scotiabank Economics as a resource for the clients of Scotiabank. Opinions, estimates and projections contained herein are our own as of the date hereof and are subject to change without notice. The information and opinions contained herein have been compiled or arrived at from sources believed reliable but no representation or warranty, express or implied, is made as to their accuracy or completeness. Neither Scotiabank nor any of its officers, directors, partners, employees or affiliates accepts any liability whatsoever for any direct or consequential loss arising from any use of this report or its contents.
These reports are provided to you for informational purposes only. This report is not, and is not constructed as, an offer to sell or solicitation of any offer to buy any financial instrument, nor shall this report be construed as an opinion as to whether you should enter into any swap or trading strategy involving a swap or any other transaction. The information contained in this report is not intended to be, and does not constitute, a recommendation of a swap or trading strategy involving a swap within the meaning of U.S. Commodity Futures Trading Commission Regulation 23.434 and Appendix A thereto. This material is not intended to be individually tailored to your needs or characteristics and should not be viewed as a “call to action” or suggestion that you enter into a swap or trading strategy involving a swap or any other transaction. Scotiabank may engage in transactions in a manner inconsistent with the views discussed this report and may have positions, or be in the process of acquiring or disposing of positions, referred to in this report.
Scotiabank, its affiliates and any of their respective officers, directors and employees may from time to time take positions in currencies, act as managers, co-managers or underwriters of a public offering or act as principals or agents, deal in, own or act as market makers or advisors, brokers or commercial and/or investment bankers in relation to securities or related derivatives. As a result of these actions, Scotiabank may receive remuneration. All Scotiabank products and services are subject to the terms of applicable agreements and local regulations. Officers, directors and employees of Scotiabank and its affiliates may serve as directors of corporations.
Any securities discussed in this report may not be suitable for all investors. Scotiabank recommends that investors independently evaluate any issuer and security discussed in this report, and consult with any advisors they deem necessary prior to making any investment.
This report and all information, opinions and conclusions contained in it are protected by copyright. This information may not be reproduced without the prior express written consent of Scotiabank.
™ Trademark of The Bank of Nova Scotia. Used under license, where applicable.
Scotiabank, together with “Global Banking and Markets”, is a marketing name for the global corporate and investment banking and capital markets businesses of The Bank of Nova Scotia and certain of its affiliates in the countries where they operate, including; Scotiabank Europe plc; Scotiabank (Ireland) Designated Activity Company; Scotiabank Inverlat S.A., Institución de Banca Múltiple, Grupo Financiero Scotiabank Inverlat, Scotia Inverlat Casa de Bolsa, S.A. de C.V., Grupo Financiero Scotiabank Inverlat, Scotia Inverlat Derivados S.A. de C.V. – all members of the Scotiabank group and authorized users of the Scotiabank mark. The Bank of Nova Scotia is incorporated in Canada with limited liability and is authorised and regulated by the Office of the Superintendent of Financial Institutions Canada. The Bank of Nova Scotia is authorized by the UK Prudential Regulation Authority and is subject to regulation by the UK Financial Conduct Authority and limited regulation by the UK Prudential Regulation Authority. Details about the extent of The Bank of Nova Scotia's regulation by the UK Prudential Regulation Authority are available from us on request. Scotiabank Europe plc is authorized by the UK Prudential Regulation Authority and regulated by the UK Financial Conduct Authority and the UK Prudential Regulation Authority.
Scotiabank Inverlat, S.A., Scotia Inverlat Casa de Bolsa, S.A. de C.V, Grupo Financiero Scotiabank Inverlat, and Scotia Inverlat Derivados, S.A. de C.V., are each authorized and regulated by the Mexican financial authorities.
Not all products and services are offered in all jurisdictions. Services described are available in jurisdictions where permitted by law.