CANADA HOUSING MARKET: “FALL” SEASON
SUMMARY
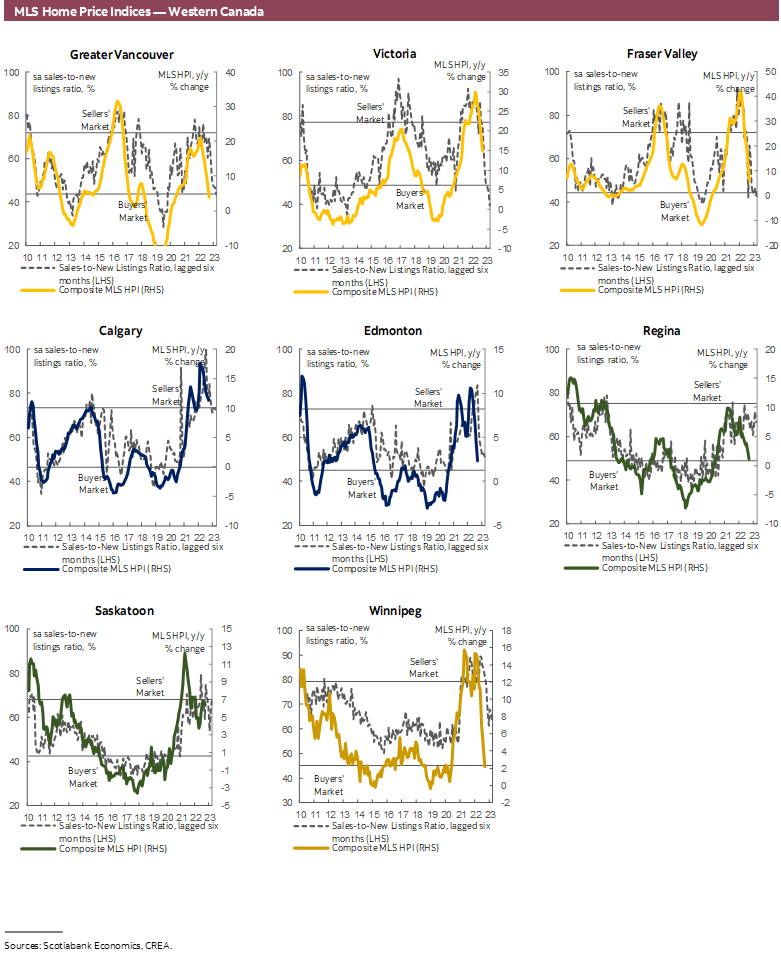
Canadian home sales fell for the seventh month in a row, dropping by 3.9% (sa m/m) in September, while listings edged down by 0.8% (sa m/m). This eased the sales-to-new listings ratio, an indicator of how tight the market is, to 52%—in line with its long-term average of 55.1%. These easing and overall more balanced market conditions brought about another decline in the composite MLS Home Price Index (HPI), which edged down 1.4% (sa m/m) in September compared to August, a deceleration from August’s 1.7% decline.
Sales fell in two-thirds of the local markets we track, with double digit gains in some urban centres in Ontario offset by declines elsewhere. The national decline puts the level of sales below its pre-pandemic levels, with September’s sales hovering around 13% below the month’s 2010–2019 average.
It was an even split between markets where listings declined and those where listings increased, resulting in an almost negligible decline in September. September’s small decline however follows significantly larger ones in the preceding two months. The level of new listings in September sat 6% below the month’s 2010–2019 average, and was the lowest level seen for the month since 2006. This is as sellers join buyers in a tug-of-war game, each waiting for the other to cave. Months of inventory continued to climb up from its record lows, reaching 3.7 months in September—still below its long-term average of 5 months, but much higher than its all-time low of 1.7 months.
For the first month since home prices started declining, the fall in apartment prices— measured by the MLS Home Price Index (HPI)—outpaced that of single-family homes. September’s monthly decline in the composite MLS HPI represented a deceleration from the prior month, falling at almost half of August’s pace. The largest deceleration was in two-storey single family homes, while apartments experienced an acceleration in terms of monthly price declines. This may be due to some demand for single-family homes returning to the market to take advantage of prices that are now sitting 10% below peak, while buyers await apartments to catch up on the decline as they remain only 3% below peak. In annual terms, however, apartments continued to lead price gains—the MLS HPI for apartments was up by 9.5% (nsa y/y) in September, above the composite increase of 3.7% (nsa y/y).
IMPLICATIONS
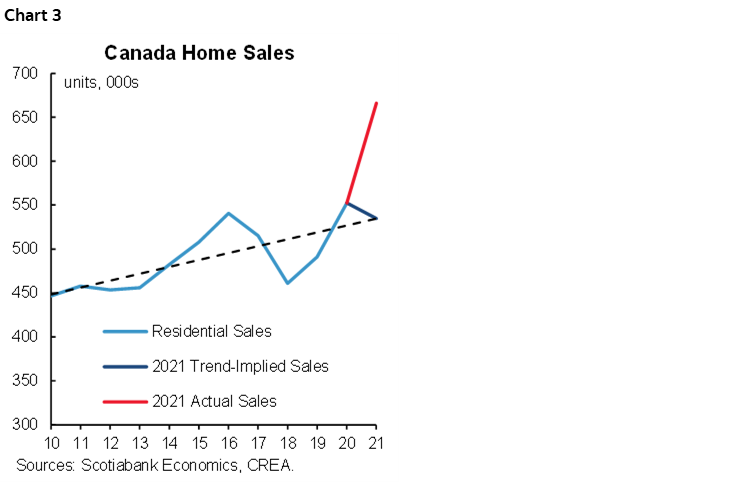
September featured another decline in national housing sales as the housing market continued adjusting to worsening macroeconomic conditions and rising prices and borrowing rates. Since the Bank of Canada began hiking its policy rate in March of this year, national sales have declined by 36%, reaching levels not seen since May 2020 when the market was just starting to emerge from covid interruptions. Current national sales levels are now around 8% below their pre-pandemic long-term average. After ticking up in August, the average selling fell again in September, ending the month 17% below its February 2022 peak, but 21% above its February 2020 level—right before the pandemic started.
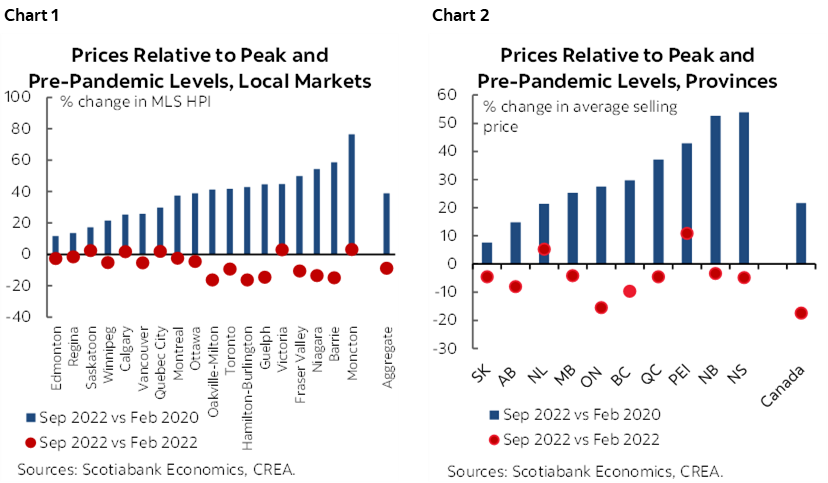
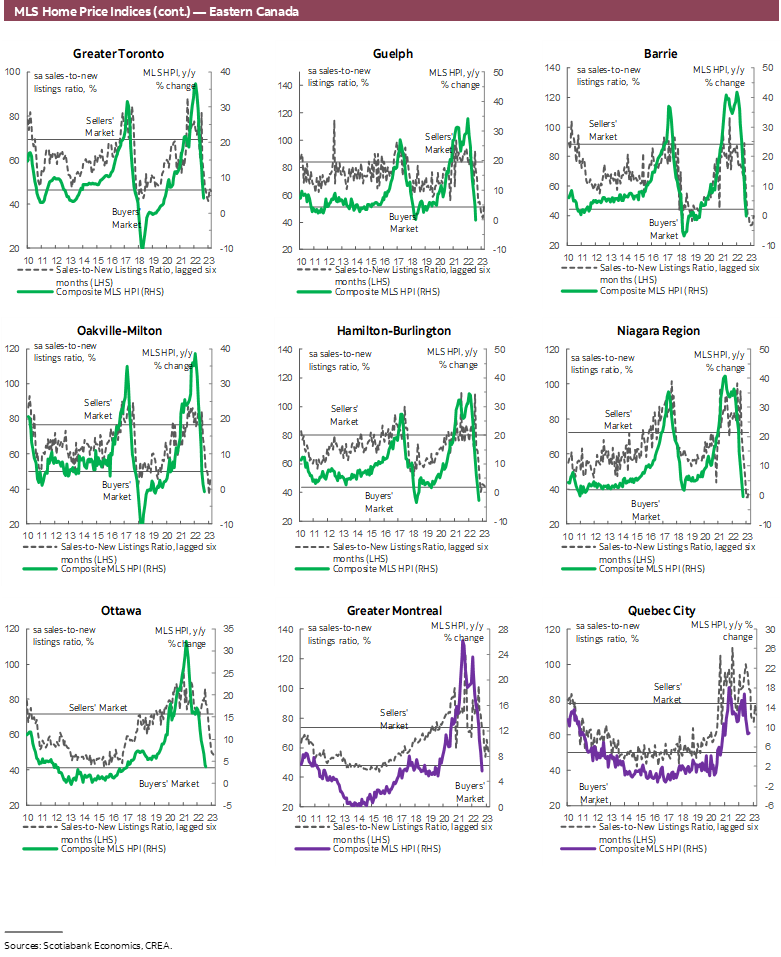
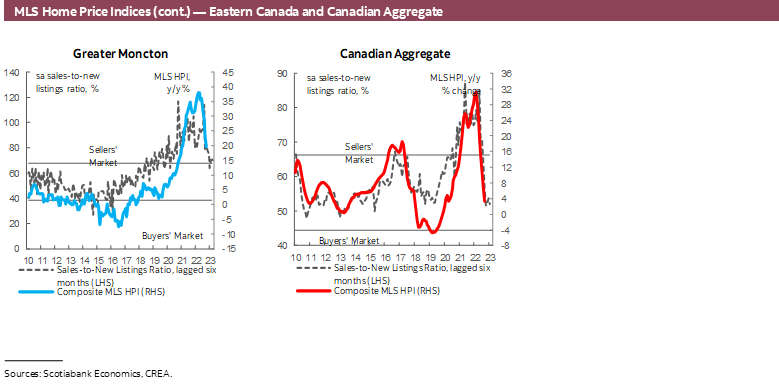
Focusing on changes in the average selling price could be misleading, however, as it does not indicate a change in the value of the average home—it is simply taking the total dollar value of the sales in a single month divided by the total number of units sold in a single month. Fluctuations in the average selling price therefore can overestimate movements in the market as it is easily swayed up or down depending on the composition of sales. The MLS House Price Index (HPI), a much more stable measure that accounts for differences in house type and size, is only 9% below the February 2022 peak and remains 39% above pre-pandemic levels, with variations across cities (chart 1). Since the MLS HPI index is not available at the provincial level, chart 2 compares September’s prices to peak and pre-pandemic levels using the average selling price. In PEI and Newfoundland and Labrador home values continue to sit above February 2022 levels.
Supply-demand conditions have been easing in many parts of the country, with the national market now in balanced territory. The recalibration in the housing market has so far been a reasonably orderly—and welcome—process, with many factors, including higher mortgage rates, leading to less demand for homes and creating much more balanced markets than seen earlier this year.
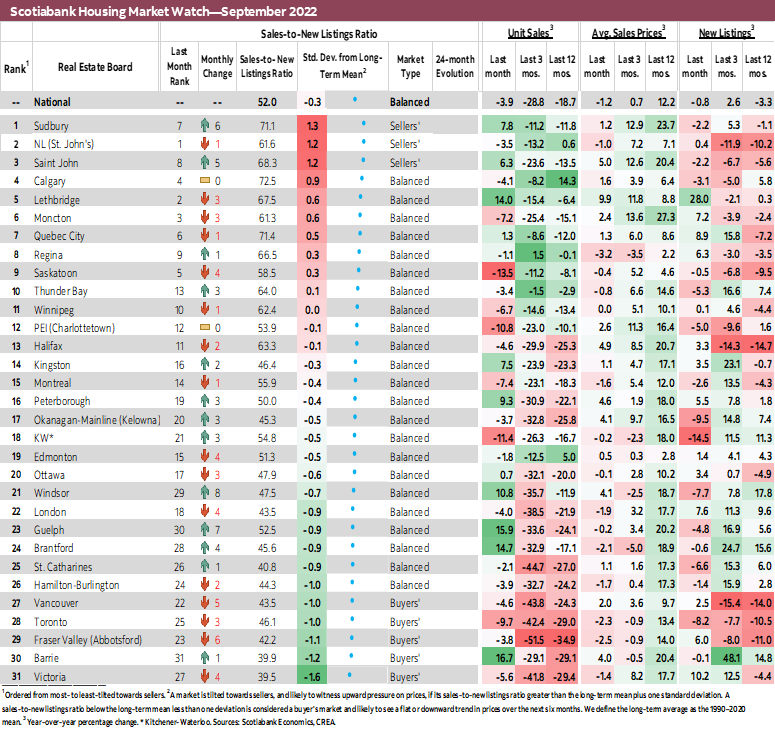
It is worth repeating an interesting point made by Murtaza Haider from the Urban Analytics Institute and discussed in last month’s report pertaining to this year’s decline in sales. A simple trend line of the number of sales over the past decade, notwithstanding covid disruptions in 2020, suggests we should’ve seen roughly 530,000 units sold in 2021. Actual units sold in 2021 were over 130,000 above the trend-suggested level, however, despite the rate of population growth that year being the slowest in a decade (chart 3). He prescribes this significantly above-trend level of sales in 2021 to forward buying, as some sales that would’ve happened this year were advanced to last year, and those who advanced their purchases naturally won’t be back to the market this year. Therefore, the slowdown in sales volume this year relative to last is at least partly due to this advancement in demand, and not entirely due to the increase in mortgage rates. The total decline in sales volume since the market turned in March adds up to 30,000 units, only a fifth of advanced purchases.
In any case, housing markets across the country are expected to continue to moderate into next year. The speed at which the moderation is occurring might seem alarming right now, particularly as they coincide with a changing and uncertain macroeconomic environment, in addition to worsening consumer sentiment. But this speed is related to many factors (discussed in detail in previous reports, see here for example), including heightened sensitivity to increased rates, investors’ activity, urgent sales, shifts in buyers’ psychology, and self-reinforcing expectations of price declines. But once those settle in, we can expect a more comfortable pace of adjustment. And in the longer term, demand fundamentals, including the acceleration of immigration and the existing challenges to increasing supply, are expected to put a floor on the adjustment.
While the monthly drop in September’s sales was bigger than August’s, pausing a trend of tapering declines that occurred in the preceding five months, the acceleration may partly be a result of the Bank of Canada’s September rate hike further narrowing the spread between variable and fixed-rate mortgages. It is the case however that the month’s decline in prices—as measured by the MLS HPI—continued to decelerate.

DISCLAIMER
This report has been prepared by Scotiabank Economics as a resource for the clients of Scotiabank. Opinions, estimates and projections contained herein are our own as of the date hereof and are subject to change without notice. The information and opinions contained herein have been compiled or arrived at from sources believed reliable but no representation or warranty, express or implied, is made as to their accuracy or completeness. Neither Scotiabank nor any of its officers, directors, partners, employees or affiliates accepts any liability whatsoever for any direct or consequential loss arising from any use of this report or its contents.
These reports are provided to you for informational purposes only. This report is not, and is not constructed as, an offer to sell or solicitation of any offer to buy any financial instrument, nor shall this report be construed as an opinion as to whether you should enter into any swap or trading strategy involving a swap or any other transaction. The information contained in this report is not intended to be, and does not constitute, a recommendation of a swap or trading strategy involving a swap within the meaning of U.S. Commodity Futures Trading Commission Regulation 23.434 and Appendix A thereto. This material is not intended to be individually tailored to your needs or characteristics and should not be viewed as a “call to action” or suggestion that you enter into a swap or trading strategy involving a swap or any other transaction. Scotiabank may engage in transactions in a manner inconsistent with the views discussed this report and may have positions, or be in the process of acquiring or disposing of positions, referred to in this report.
Scotiabank, its affiliates and any of their respective officers, directors and employees may from time to time take positions in currencies, act as managers, co-managers or underwriters of a public offering or act as principals or agents, deal in, own or act as market makers or advisors, brokers or commercial and/or investment bankers in relation to securities or related derivatives. As a result of these actions, Scotiabank may receive remuneration. All Scotiabank products and services are subject to the terms of applicable agreements and local regulations. Officers, directors and employees of Scotiabank and its affiliates may serve as directors of corporations.
Any securities discussed in this report may not be suitable for all investors. Scotiabank recommends that investors independently evaluate any issuer and security discussed in this report, and consult with any advisors they deem necessary prior to making any investment.
This report and all information, opinions and conclusions contained in it are protected by copyright. This information may not be reproduced without the prior express written consent of Scotiabank.
™ Trademark of The Bank of Nova Scotia. Used under license, where applicable.
Scotiabank, together with “Global Banking and Markets”, is a marketing name for the global corporate and investment banking and capital markets businesses of The Bank of Nova Scotia and certain of its affiliates in the countries where they operate, including; Scotiabank Europe plc; Scotiabank (Ireland) Designated Activity Company; Scotiabank Inverlat S.A., Institución de Banca Múltiple, Grupo Financiero Scotiabank Inverlat, Scotia Inverlat Casa de Bolsa, S.A. de C.V., Grupo Financiero Scotiabank Inverlat, Scotia Inverlat Derivados S.A. de C.V. – all members of the Scotiabank group and authorized users of the Scotiabank mark. The Bank of Nova Scotia is incorporated in Canada with limited liability and is authorised and regulated by the Office of the Superintendent of Financial Institutions Canada. The Bank of Nova Scotia is authorized by the UK Prudential Regulation Authority and is subject to regulation by the UK Financial Conduct Authority and limited regulation by the UK Prudential Regulation Authority. Details about the extent of The Bank of Nova Scotia's regulation by the UK Prudential Regulation Authority are available from us on request. Scotiabank Europe plc is authorized by the UK Prudential Regulation Authority and regulated by the UK Financial Conduct Authority and the UK Prudential Regulation Authority.
Scotiabank Inverlat, S.A., Scotia Inverlat Casa de Bolsa, S.A. de C.V, Grupo Financiero Scotiabank Inverlat, and Scotia Inverlat Derivados, S.A. de C.V., are each authorized and regulated by the Mexican financial authorities.
Not all products and services are offered in all jurisdictions. Services described are available in jurisdictions where permitted by law.