CANADA HOUSING MARKET: HOUSING MARKET FATIGUE!
SUMMARY
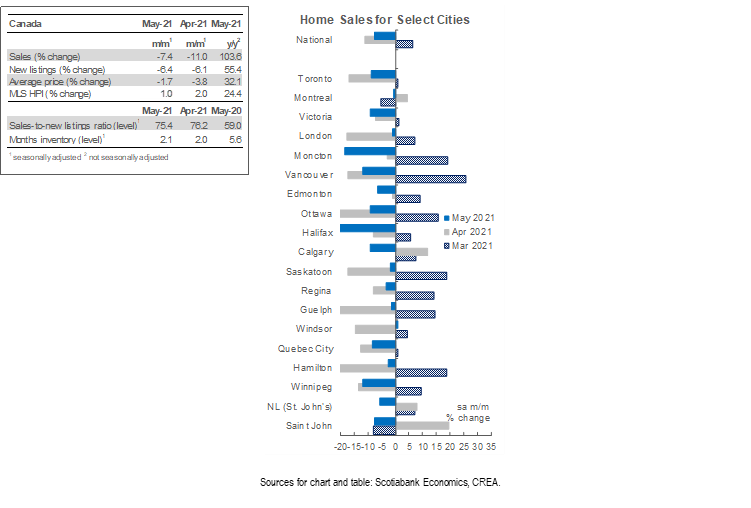
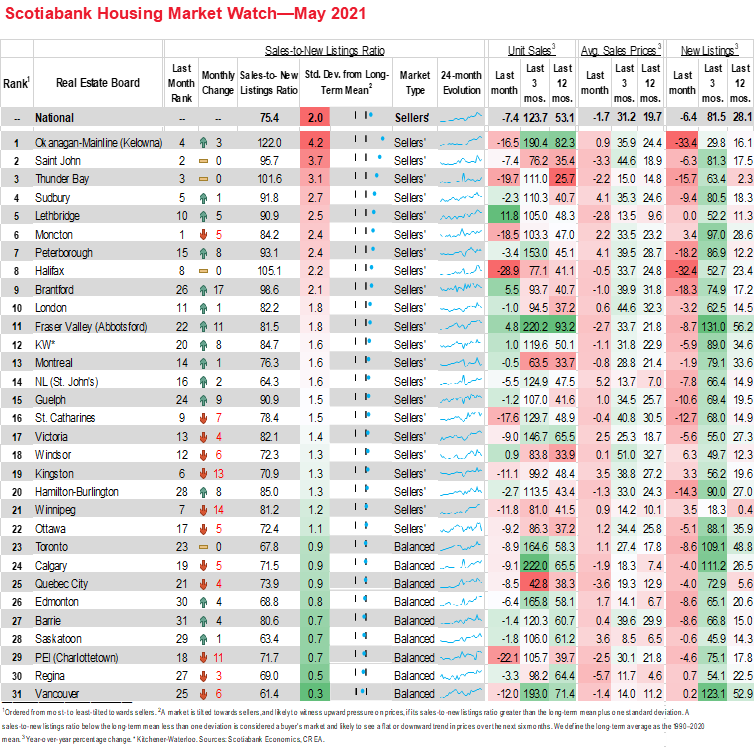
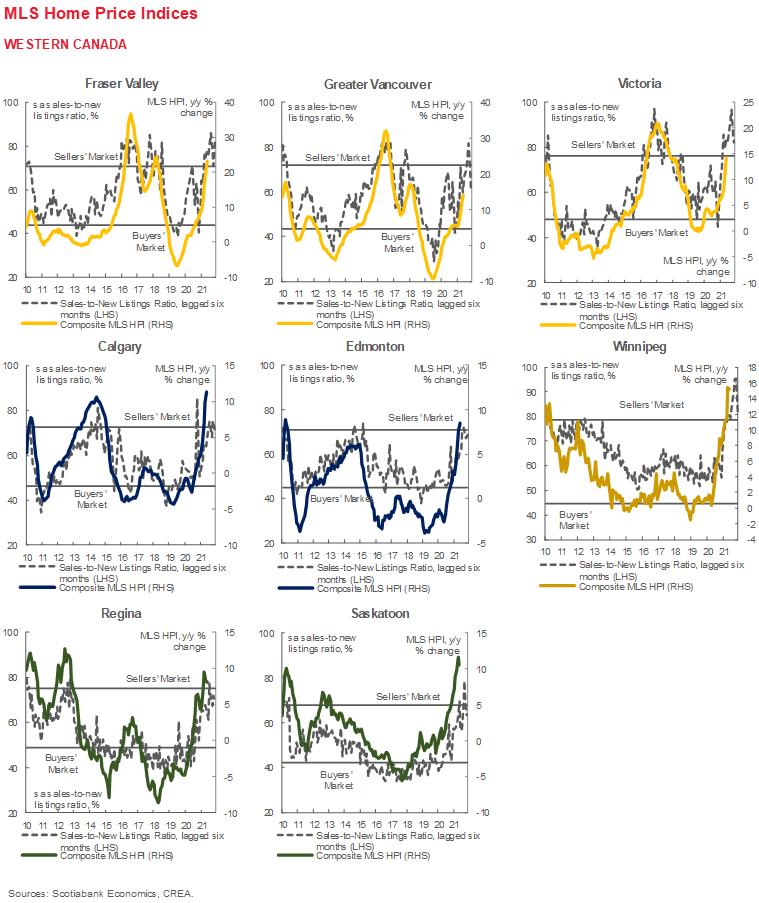
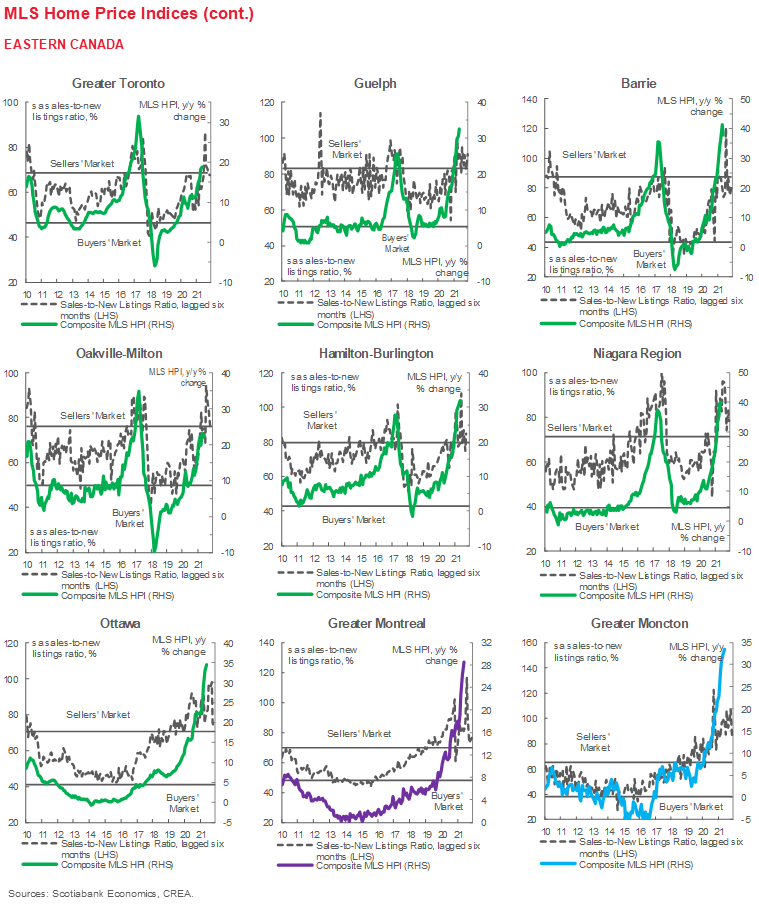
Canadian home sales declined by 7.4% (sa m/m) in May for a second drop in a row. Listings followed suit, falling by 6.4% (sa m/m). With sales falling by 1 percentage point more than listings, the national-level sales-to-new listings declined to 75.4% from 76.2% in April—a welcome moderation from record high readings earlier this year (the highest being 91% in January). Despite this easing, supply-demand conditions remain historically tight as this ratio is still significantly higher than its long-term average of 54.5%, and its May 2020 level of 59%. As a result of this persistent tightness in the housing market, we do not see prices reflecting the decline in sales, where the composite MLS Home Price Index (HPI) rose by 1% (sa m/m). This price increase, however, does reflect a deceleration in price gains compared to the unsustainable pace observed earlier this year, with February and March witnessing the biggest monthly price gains since 2000. This deceleration is in the most part driven by the single-family homes and townhouses segments, which experienced only half of April’s monthly price gain in May. Apartments, on the other hand, have maintained momentum in May.
Sales declines were spread out across much of the country this month, maintaining the broad-based trend in the housing market witnessed during the pandemic. Of the 31 local markets we monitor, 26 witnessed sales declines in May compared to April, with the biggest decline happening in Halifax (29% sa m/m). While headlines might focus on May’s monthly decline, it’s important to remember that sales were up 103.6% (nsa y/y) compared to May 2020—a month that had fully recovered the largest monthly sales decline on record in April 2020, but one that was nonetheless the worst May since the late 1990s and was 31.2% (sa) lower than the 20-year May-average from 2000 to 2019. In comparison to this long-term May average, which gives a better idea of this month’s results, sales in May 2021 were 45% (sa) higher.
Listings dropped this month but at a smaller pace than sales, bringing up months of inventory for the second consecutive month. The May drop in listings was, like sales, broad based, where listings fell in 24 of the 31 centres in our list, and remained stable in 1 centre, Lethbridge—which happens to be the centre that experienced the highest sales gain in May (11.8% sa m/m) . The smaller decline in listings compared to sales further relaxed the sales-to-new listings ratio for the fifth consecutive month this year, but the ratio remains significantly higher than its long-term average, leaving 22 of our centres in sellers’ market territory. At the current rate of sales activity, national inventories would be liquidated in 2.1 months. While this is an improvement from the fastest rate on record in March 2021 of 1.7 months, it is still markedly lower than its long-term average of 5 months. The only exception to the improvement in months of inventory is New Brunswick, which recorded its lowest rate on record in April and May 2021.
Single-family homes and townhouses experienced the largest deceleration in price gains. The composite MLS HPI for all homes in Canada increased by 24.4% (nsa y/y) in May 2021—this is the biggest year-over-year increase on record since 2005, but one that is likely biased up due to base effect. While single-family homes and townhouses also recorded their biggest year-over-year increase this month, these same segments recorded the largest deceleration in price gains on a monthly basis—that is, their monthly price gains in May were around 50% smaller than in April. Apartments, which in April 2021 experienced their highest monthly price gain since May 2017 (2% sa m/m), maintained a similar pace in May (1.9% sa m/m).
IMPLICATIONS
A softening in the housing market for the second consecutive month this year has been felt across sales, listings, and price gains across much of the country’s markets. Despite the slowdown, however, the housing market remains historically strong. The reasons sales slowed down in May are not entirely clear, but it could well be related to the third wave, where much of the country was under lockdown in May, and the erosion in affordability after months of unsustainable price increases and persistent shortages in supply. The simultaneous drop in sales and listings for two consecutive months further points to this being more than just a demand-side story. The drop in listings serves to only limit buyers’ options, in a market that has already been in sellers’ territory. While potential sellers may be encouraged to list their homes to capture peak price gains as signs of moderation arise, another mechanic might be at play. Potential sellers might be hesitant to list their homes having been hearing the horror stories of too many buyers and bidders chasing too few homes and homes selling for hundreds of thousands over asking price. Why sell your house if you can’t afford to buy another? This may be particularly true in today’s rough bidding environment where the fewer conditions on an offer, the better—whereas it used to be acceptable to include a clause in your offer that indicates you would buy the home as long as you can sell yours, clause-inclusive offers are not considered the most competitive today.
Despite anticipation of OSFI’s new and tighter stress test, it doesn’t seem that buyers rushed in May to qualify before these stricter measures took effect on June 1st—at least not enough to record a sales gain. It may be the case that the stress test only impacts buyers on the margin who have already been priced out of the market, or that homebuyers are adjusting their plans in the event that the Bank of Canada tightens its policy rate next year. Home hunting and bidding-wars fatigue could also be setting in for some buyers, especially at this stage of the COVID pandemic where a glimpse of a return to normal life and working conditions begins to emerge. With summer weather arriving and provinces easing restrictions, maybe this shifts some of the focus away from needing more spacious homes in the suburbs. This shift might be exacerbated due to the widening price differential between these units and other smaller units in cities’ core, where the latter became relatively more affordable. This can be seen by the robust momentum in the apartment segment of the market while single-family homes and townhouses continued to experience a deceleration in price gains.
No matter the reasons for the slowdown in the housing market this month, the chronic shortages in housing supply (see here) continue to be the most pressing issue facing the housing market today. The long-standing shortage in supply has been underlying imbalances in the housing market long before COVID hit. The slowdown in demand is unlikely to be permanent due to immigration if nothing else, which so far this year has been on the sidelines. Even if it is the case that the slowdown in current demand inside of Canada is permanent, demand will undoubtedly pick up again once we open the borders and achieve the new ambitious immigration targets over the next few years.
Looking ahead, solid progress in terms of vaccines and a reduction in case count point to a full reopening of the economy by the end of summer and a solid economic rebound underway. Despite the set-back in April and May due to lockdowns, we still expect the output gap to close and move into excess demand by end of this year and as a result we currently forecast a rate hike by the Bank of Canada by 2022-Q3. As domestic and global conditions continue to improve, jobs-recovery and population growth will continue to support housing market prices—which are more likely to go up than down until we achieve a better supply-demand balance in the market.
DISCLAIMER
This report has been prepared by Scotiabank Economics as a resource for the clients of Scotiabank. Opinions, estimates and projections contained herein are our own as of the date hereof and are subject to change without notice. The information and opinions contained herein have been compiled or arrived at from sources believed reliable but no representation or warranty, express or implied, is made as to their accuracy or completeness. Neither Scotiabank nor any of its officers, directors, partners, employees or affiliates accepts any liability whatsoever for any direct or consequential loss arising from any use of this report or its contents.
These reports are provided to you for informational purposes only. This report is not, and is not constructed as, an offer to sell or solicitation of any offer to buy any financial instrument, nor shall this report be construed as an opinion as to whether you should enter into any swap or trading strategy involving a swap or any other transaction. The information contained in this report is not intended to be, and does not constitute, a recommendation of a swap or trading strategy involving a swap within the meaning of U.S. Commodity Futures Trading Commission Regulation 23.434 and Appendix A thereto. This material is not intended to be individually tailored to your needs or characteristics and should not be viewed as a “call to action” or suggestion that you enter into a swap or trading strategy involving a swap or any other transaction. Scotiabank may engage in transactions in a manner inconsistent with the views discussed this report and may have positions, or be in the process of acquiring or disposing of positions, referred to in this report.
Scotiabank, its affiliates and any of their respective officers, directors and employees may from time to time take positions in currencies, act as managers, co-managers or underwriters of a public offering or act as principals or agents, deal in, own or act as market makers or advisors, brokers or commercial and/or investment bankers in relation to securities or related derivatives. As a result of these actions, Scotiabank may receive remuneration. All Scotiabank products and services are subject to the terms of applicable agreements and local regulations. Officers, directors and employees of Scotiabank and its affiliates may serve as directors of corporations.
Any securities discussed in this report may not be suitable for all investors. Scotiabank recommends that investors independently evaluate any issuer and security discussed in this report, and consult with any advisors they deem necessary prior to making any investment.
This report and all information, opinions and conclusions contained in it are protected by copyright. This information may not be reproduced without the prior express written consent of Scotiabank.
™ Trademark of The Bank of Nova Scotia. Used under license, where applicable.
Scotiabank, together with “Global Banking and Markets”, is a marketing name for the global corporate and investment banking and capital markets businesses of The Bank of Nova Scotia and certain of its affiliates in the countries where they operate, including; Scotiabank Europe plc; Scotiabank (Ireland) Designated Activity Company; Scotiabank Inverlat S.A., Institución de Banca Múltiple, Grupo Financiero Scotiabank Inverlat, Scotia Inverlat Casa de Bolsa, S.A. de C.V., Grupo Financiero Scotiabank Inverlat, Scotia Inverlat Derivados S.A. de C.V. – all members of the Scotiabank group and authorized users of the Scotiabank mark. The Bank of Nova Scotia is incorporated in Canada with limited liability and is authorised and regulated by the Office of the Superintendent of Financial Institutions Canada. The Bank of Nova Scotia is authorized by the UK Prudential Regulation Authority and is subject to regulation by the UK Financial Conduct Authority and limited regulation by the UK Prudential Regulation Authority. Details about the extent of The Bank of Nova Scotia's regulation by the UK Prudential Regulation Authority are available from us on request. Scotiabank Europe plc is authorized by the UK Prudential Regulation Authority and regulated by the UK Financial Conduct Authority and the UK Prudential Regulation Authority.
Scotiabank Inverlat, S.A., Scotia Inverlat Casa de Bolsa, S.A. de C.V, Grupo Financiero Scotiabank Inverlat, and Scotia Inverlat Derivados, S.A. de C.V., are each authorized and regulated by the Mexican financial authorities.
Not all products and services are offered in all jurisdictions. Services described are available in jurisdictions where permitted by law.