CANADA HOUSING MARKET: ADJUSTING AWAY
SUMMARY
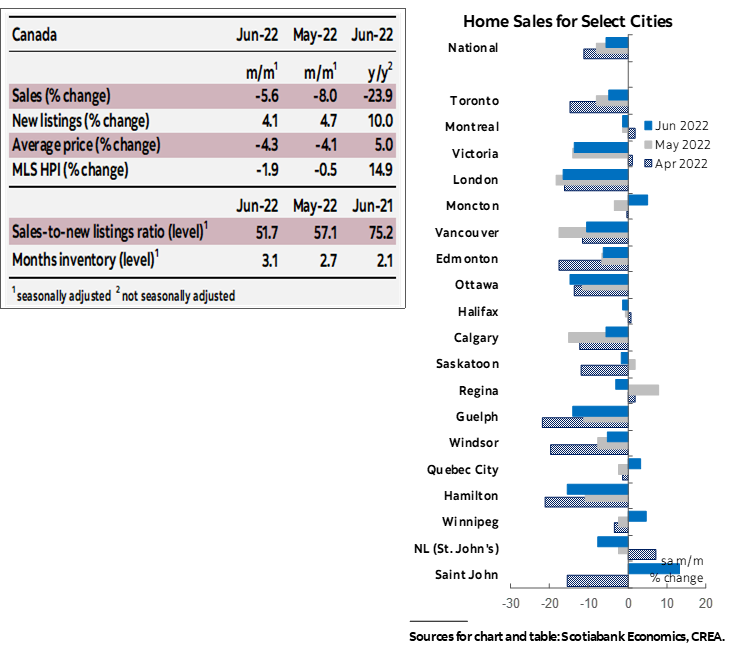
Canadian home sales fell for the fourth month in a row, dropping by 5.6% (sa m/m) in June, while listings were up by 4.1% (sa m/m). This has brought further balance to the market, where the sales-to-new listings ratio, an indicator of how tight the market is, dropped to 51.7%—its lowest level since January 2015, and below its long-term average of 55.1%. This easing in conditions brought about another decline in the composite MLS Home Price Index (HPI), which edged down 1.9% (sa m/m) in June compared to May.
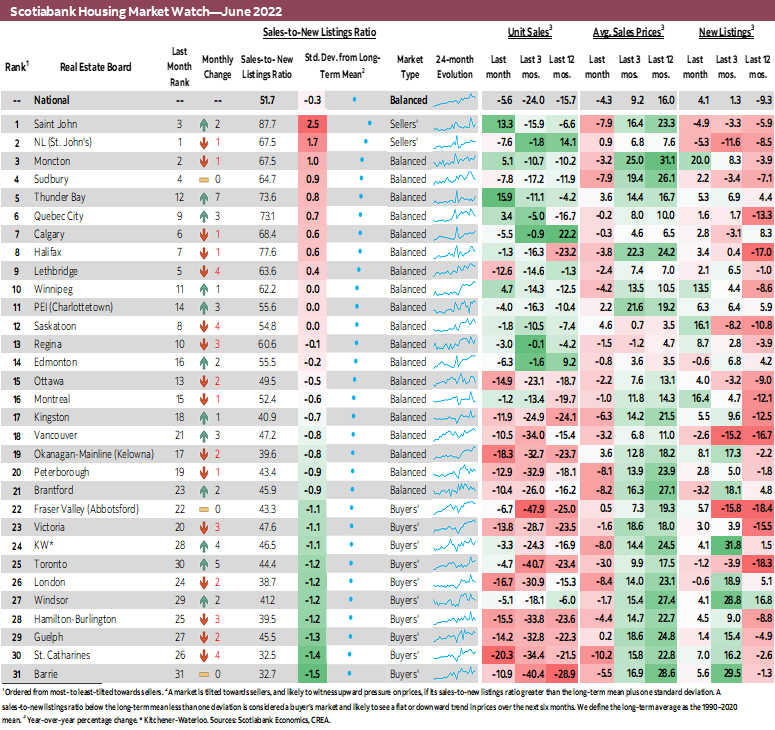
The decline in sales was widespread across the local markets we track. Of our 31 markets, sales fell in 26, led by urban centres in Ontario (St. Catharines, London, Hamilton-Burlington, Ottawa, Guelph, Peterborough, Kingston, Barrie, Brantford) and BC (Okanagan-Mainline, Victoria, Vancouver)—all of which recorded declines in the double digits. The national decline brings the level of sales closer to pre-pandemic levels, with June’s sales in line with the month’s long-term average.
Listings increased in three-quarters of our local markets, pushing more markets out of sellers’ territory and into the balanced and buyers’ territory. Only two of our local centres remain in sellers’ territory, Saint John and St. John’s. Ten, majority of which in Ontario, are now in buyers’ territory, including Toronto, with the rest in balanced market territory. Months of inventory continued to climb up from its record lows, reaching 3.1 months in June—still below its long-term average of 5 months, but the highest it has been since summer 2020.
For the second month in a row, all home-types registered monthly price declines, including apartments. One-storey family homes led the fall in prices (-2.8% sa m/m), followed by two-storey family homes (-1.7% sa m/m), apartments (-1.4% sa m/m) and townhouses (-1.3% sa m/m). On the whole, the composite MLS HPI for all homes in Canada was 14.9% (nsa y/y) higher in June 2022 compared to the same month last year, half the record-setting year-over-year increases of 30% in January and February 2022.
IMPLICATIONS
The housing market in many regions in Canada continued its adjustment to higher rates and shifts in market psychology and dynamics in June.
Since the Bank of Canada began hiking its policy rate in March of this year, national sales have declined by 27%, while average selling price declined by 14% from its February 2022 peak.
Supply-demand conditions have been easing in many parts of the country, with the national market now in balanced territory. The recent recalibration in the housing market is a welcome development, and an intended consequence of higher borrowing rates. The rate hikes were meant to remove some of the exuberance from the market, which they are doing—admittedly, however, they are doing so at a much faster pace than previously anticipated.
This rapid response is largely the result of higher sensitivity to rate hikes as we’ve discussed in previous reports. With the ever increasing mortgage sizes required to afford the hefty price tags on homes after two years of unsustainable appreciations, marginal increases in borrowing rates translate into disproportionate increases in mortgage payments and reduction in affordability. This has increased the response of housing demand to the Bank of Canada rate hikes and ensuing increase in mortgage rates and stress-testing thresholds. Additionally, while Canadian households increased their net wealth to record high levels during the pandemic, they have also increased their liabilities, encouraged by record low rates and “cheap” debt. This increased indebtedness has made debt servicing ratios more sensitive to the renewal of these loans at higher rates (see the Bank of Canada’s Financial System Review for a detailed analysis of the impact of higher indebtedness on rate-sensitivity). The sensitivity also comes from the speculative nature of the demand that had fueled the unsustainable price increases throughout the pandemic. Investors, whose demand is naturally more rate-elastic given their higher debt-servicing ratios and profitability incentives, made up a larger share of the buyers’ pool. As rates climb and their cost of business follows suit, a drop in demand from this segment results in a disproportionate fall in sales.
The shift in market psychology is also at play. More people now expect prices to drop relative to before, and therefore buyers are increasingly feeling less rushed and are holding off for cheaper price tags. Also back on the table are conditional offers, a sensical market lever in normal time that the abnormal pandemic times made irrelevant, as such offers were considered uncompetitive. With certain conditions, like inspections, being normalized again, home appraisals may be pulling prices down closer to market values. And, while buyers’ sense of urgency might be retreating, it is likely creeping up on sellers who bought new homes before selling their existing ones, as they could not make their offer conditional on the successful sale of their current property. Some of these households could now be finding themselves in need of capital and are therefore rushing to list their homes and sell. This may be bringing more temporary supply to the market and causing larger discounts as they accept bids that are below asking. Another segment of sellers might be in denial/rejection phase—seeing what similar homes sold for just a couple of months ago, they are having a hard time readjusting their expectations and asking price, creating a mismatch between inventory and market clearing price.
The housing market therefore is reacting to a slew of factors, and is readjusting to higher interest rates—as it should! Yes it is doing so in a rapid fashion, and the Bank of Canada’s surprise 1% rate hike this week will only add to the speed of this adjustment.
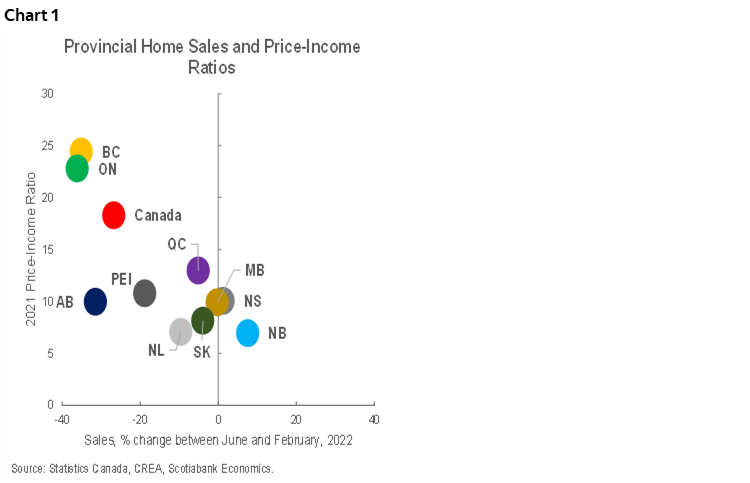
Of course, there are variations within these adjustments across different regions and different market segments. In Toronto for example, compared to the same month last year, sales dropped more in the large, detached-homes segment relative to apartments, with monthly price declines in the single-family home segment being double that of apartments. Within the detached-homes segment, sales in the suburbs declined by more than in the downtown core. This makes sense as a reversal of the pandemic conditions that led to a significant price appreciation in this segment is now under way. Across cities, the biggest sales drops are happening in regions that saw the largest divergence of prices from incomes and fundamentals. Chart 1 plots the level of sales in June relative to February (the month before the first Bank of Canada hike) against the average price to income ratios in 2021 across the different provinces—with the exception of Alberta, a clear trend emerges, whereby provinces that had the largest price-to-income ratios at the end of 2021 have in four months recorded the largest declines in sales, namely Ontario and British Columbia. This is in line with recent data from Equifax that shows the biggest reduction in new mortgage volumes compared to last year occurred in these two provinces.
As the dust clears and these dynamics play out, we can expect the housing market to settle into a more sustainable pace of adjustment in the short to medium term and to reflect demand fundamentals in the longer term.

DISCLAIMER
This report has been prepared by Scotiabank Economics as a resource for the clients of Scotiabank. Opinions, estimates and projections contained herein are our own as of the date hereof and are subject to change without notice. The information and opinions contained herein have been compiled or arrived at from sources believed reliable but no representation or warranty, express or implied, is made as to their accuracy or completeness. Neither Scotiabank nor any of its officers, directors, partners, employees or affiliates accepts any liability whatsoever for any direct or consequential loss arising from any use of this report or its contents.
These reports are provided to you for informational purposes only. This report is not, and is not constructed as, an offer to sell or solicitation of any offer to buy any financial instrument, nor shall this report be construed as an opinion as to whether you should enter into any swap or trading strategy involving a swap or any other transaction. The information contained in this report is not intended to be, and does not constitute, a recommendation of a swap or trading strategy involving a swap within the meaning of U.S. Commodity Futures Trading Commission Regulation 23.434 and Appendix A thereto. This material is not intended to be individually tailored to your needs or characteristics and should not be viewed as a “call to action” or suggestion that you enter into a swap or trading strategy involving a swap or any other transaction. Scotiabank may engage in transactions in a manner inconsistent with the views discussed this report and may have positions, or be in the process of acquiring or disposing of positions, referred to in this report.
Scotiabank, its affiliates and any of their respective officers, directors and employees may from time to time take positions in currencies, act as managers, co-managers or underwriters of a public offering or act as principals or agents, deal in, own or act as market makers or advisors, brokers or commercial and/or investment bankers in relation to securities or related derivatives. As a result of these actions, Scotiabank may receive remuneration. All Scotiabank products and services are subject to the terms of applicable agreements and local regulations. Officers, directors and employees of Scotiabank and its affiliates may serve as directors of corporations.
Any securities discussed in this report may not be suitable for all investors. Scotiabank recommends that investors independently evaluate any issuer and security discussed in this report, and consult with any advisors they deem necessary prior to making any investment.
This report and all information, opinions and conclusions contained in it are protected by copyright. This information may not be reproduced without the prior express written consent of Scotiabank.
™ Trademark of The Bank of Nova Scotia. Used under license, where applicable.
Scotiabank, together with “Global Banking and Markets”, is a marketing name for the global corporate and investment banking and capital markets businesses of The Bank of Nova Scotia and certain of its affiliates in the countries where they operate, including; Scotiabank Europe plc; Scotiabank (Ireland) Designated Activity Company; Scotiabank Inverlat S.A., Institución de Banca Múltiple, Grupo Financiero Scotiabank Inverlat, Scotia Inverlat Casa de Bolsa, S.A. de C.V., Grupo Financiero Scotiabank Inverlat, Scotia Inverlat Derivados S.A. de C.V. – all members of the Scotiabank group and authorized users of the Scotiabank mark. The Bank of Nova Scotia is incorporated in Canada with limited liability and is authorised and regulated by the Office of the Superintendent of Financial Institutions Canada. The Bank of Nova Scotia is authorized by the UK Prudential Regulation Authority and is subject to regulation by the UK Financial Conduct Authority and limited regulation by the UK Prudential Regulation Authority. Details about the extent of The Bank of Nova Scotia's regulation by the UK Prudential Regulation Authority are available from us on request. Scotiabank Europe plc is authorized by the UK Prudential Regulation Authority and regulated by the UK Financial Conduct Authority and the UK Prudential Regulation Authority.
Scotiabank Inverlat, S.A., Scotia Inverlat Casa de Bolsa, S.A. de C.V, Grupo Financiero Scotiabank Inverlat, and Scotia Inverlat Derivados, S.A. de C.V., are each authorized and regulated by the Mexican financial authorities.
Not all products and services are offered in all jurisdictions. Services described are available in jurisdictions where permitted by law.