Next Week's Risk Dashboard
- There’s value amid the gloom
- Nonfarm payrolls still resilient?
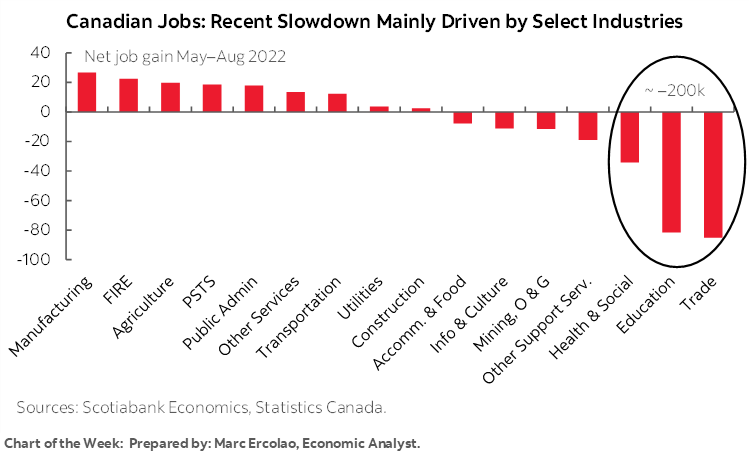
- Teachers are messing up Canadian jobs
- Canadian wage-price spiral risk
- Brazilian election could impact EM asset class
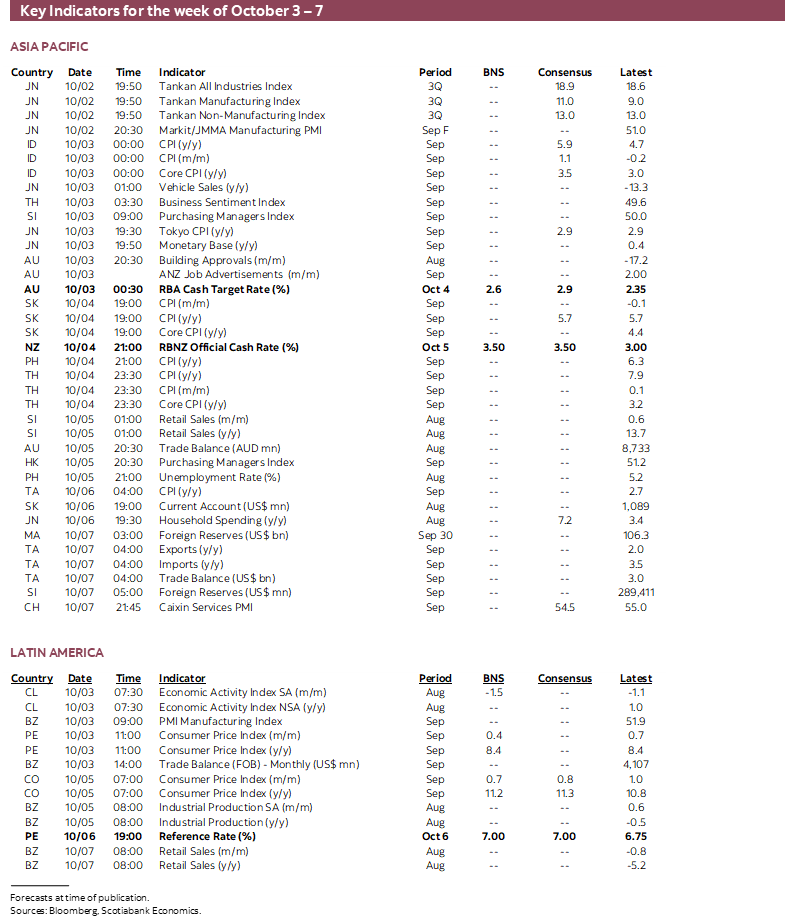
- RBA: 25 or 50?
- RBNZ’s job isn’t done yet
- Peru’s central bank might not be done hiking after all
- LatAm and Asian inflation
- PMIs: US-ISMs, Canada, Brazil, China, India, Japan
- Germany’s economy
Chart of the Week
There are legitimate reasons to be concerned about the world economic outlook and certainly in the context of global market turmoil, but often lost in the portrayal of these concerns is any reference to the associated opportunity that is opening up. We can’t time optimal entry and exit points for broad market sentiment and I don’t wish to sound pollyannaish toward the risks, but amid the gloom is the evidence of more value for investors than we’ve seen in quite a while and with the present focus upon Canada. Many investors are benchmarked on relative performance to indices and so beating the market on its timing is important, while many other investors with more patient horizons need only do well by dipping into opportunities in gradual fashion amid some of the best value we’ve seen in quite a while.
Before turning to the evidence, much of the mainstream narrative is around concerns for the real economy, meaning mainstreet variables like GDP and employment. There are definitely downsides to both. But financial market prospects often march to a different drummer and with significantly different timing to the broader economy. Financial markets typically price in the full pain of monetary tightening that shows up before lagging real economy variables and then turn toward pricing recovery when mainstreet is still going through painful adjustments.
What’s the evidence on Canada?
For starters, the currency has put the whole country’s assets on sale especially to holders of USD. That matters enormously given the tight integration of its economy and capital markets with the US and the reliance upon two-way trade and capital flows with the US in an overall balance of payments sense. The C$ has depreciated by about 17 cents since mid-2021. We see some evidence that this is working to generate increased interest in Canada even including shoppers as travel figures show that cross-border shopping trips from the US to Canada soared over the summer.
Because of Canada’s ban on foreign buying of real estate, it’s unlikely that there will be similar buying activity of vacation properties by Americans as in the past. This is unfortunate scapegoating when it was domestic buyers who drove prices skyward in response to excessive policy stimulus.
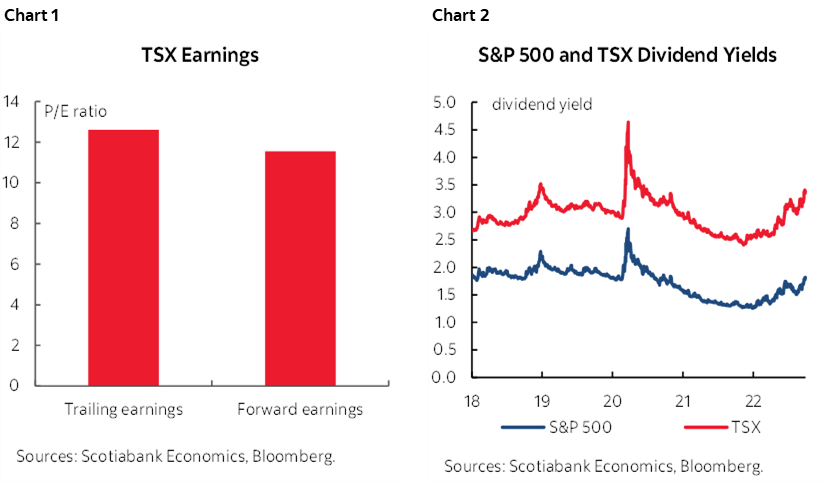
That could mean that more of the interest in Canada will be expressed through financial markets. Start with the TSX at about 12 times trailing earnings and 11 times forward earnings with the highest dividend yield of any North American equity exchange (charts 1, 2).
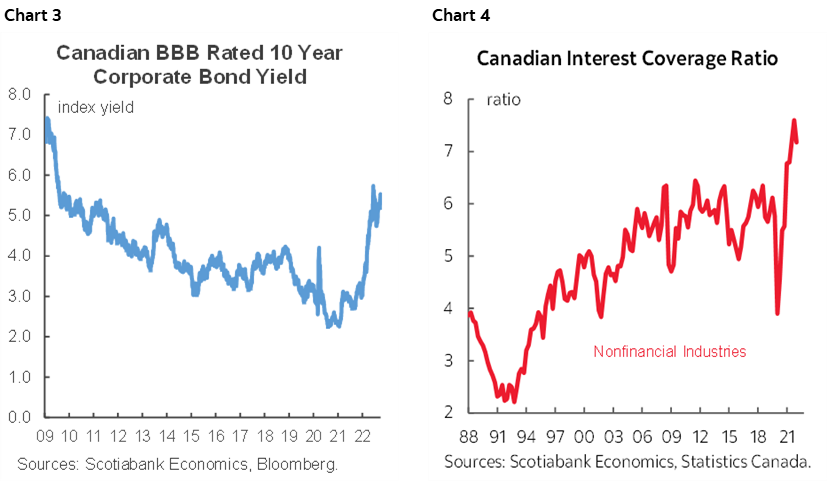
Corporate bonds have sharply cheapened with the benchmark BBB rated corporate proxy yield rising to about 5½% or double what it was in early 2021 and the highest observed yield since 2009 that is garnering a full 220bps above 10-year Canadas (chart 3). Excellent corporate balance sheet fundamentals like record high interest coverage into coming weakness and a roughly $250B surge in cash balances are supportive (chart 4). Financing demand around building inventories in response to serial supply chain shocks and potential financing of efforts to revamp supply chains present related flow opportunities.
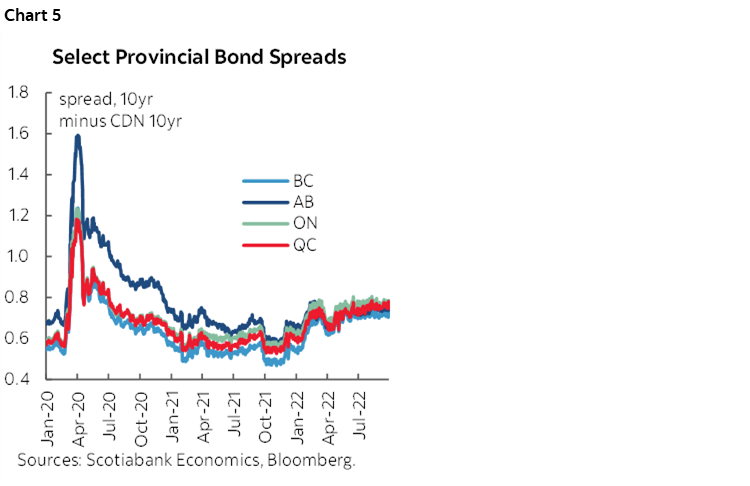
Provincial government bond spreads over comparable maturity Government of Canada bond yields are offering about 80bps of spread pick-up which makes them more attractive than yields on US Treasuries (chart 5). These are highly liquid issues by issuers with enormous powers over revenues and expenditures that stand them apart from multiple other sub-federal levels of government elsewhere.
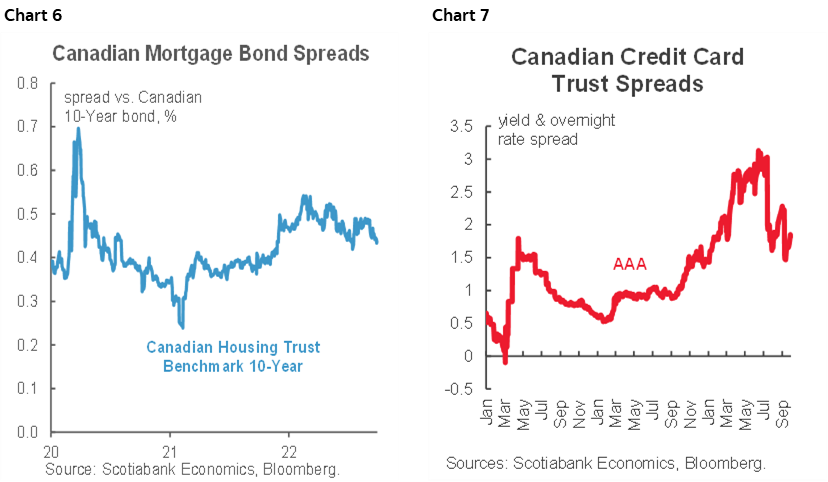
Spreads on housing related debt also offer spread pick-up (chart 6) including government guaranteed mortgage bonds. Highly rated credit card trusts offer still higher spreads than have tended to exist on average over the pandemic (chart 7).
As 2023 unfolds there is likely to be further opportunity and this is just a sampling of the universe of products. Inverted sovereign yield curves tend not to last very long because of the associated damage and so at some point we are likely to see this pivot toward declining yields from shorter terms through the belly of the curve. The higher the near-term policy rate outlook on the path to 4% by year-end, the more likely that the Bank of Canada is to return to cutting over the next 1–2 years.
Over the coming week we are likely to witness further turmoil in global markets as nonfarm payrolls lie ahead while the Fed’s effects on other central banks reverberate and a major EM election could carry spillover effects across the asset class. The point of what I’ve said above, however, is to be mindful of not only the risks in financial markets but also the attractive opportunities that are emerging.
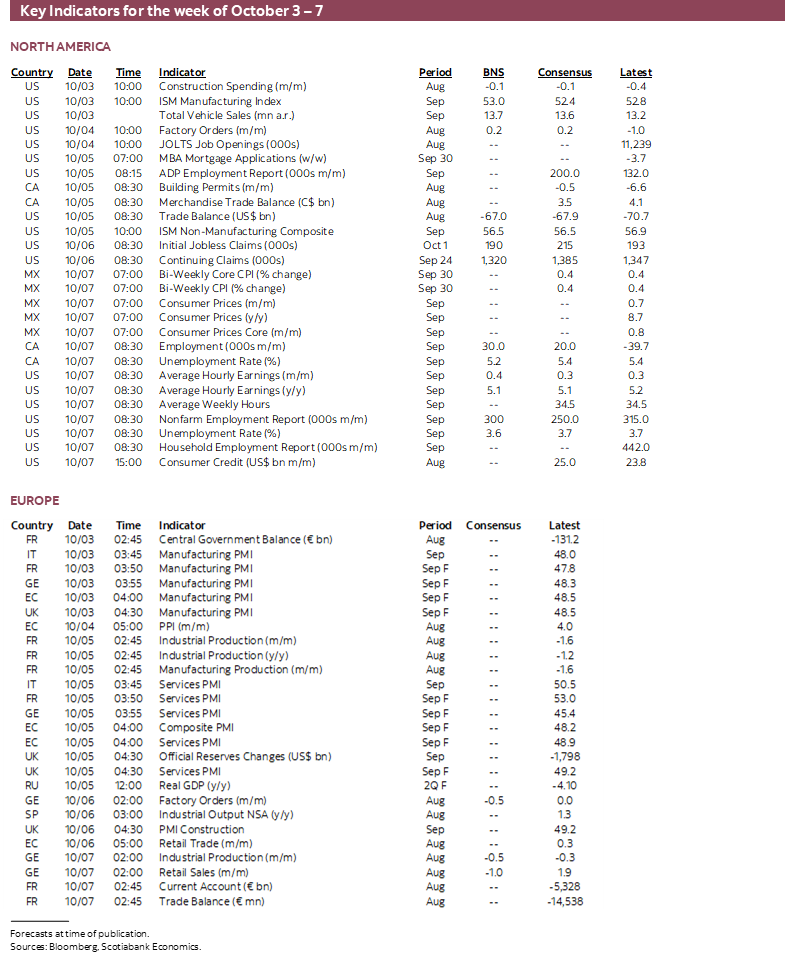
US JOBS AND WAGES—TOO EARLY TO ROLL?
Friday’s nonfarm payrolls and associated job market measures will be the marquee global release of the week by far. It’s also the week’s biggest wildcard. With significant trepidation I’ve gone with a guesstimated 300k increase alongside wage growth at 0.4% m/m and 5.1% y/y.
The US job market has thus far remained highly resilient to mounting downside risks to the outlook and has not behaved in keeping with a US version of Okun’s ‘law.’ Advance indicators of changes in nonfarm payrolls have not been terribly reliable. With that caution, declining initial jobless claims to sub-200k levels last week and an approximate 40k+ decline into the reference period compared to the August payrolls reference period is a positive.
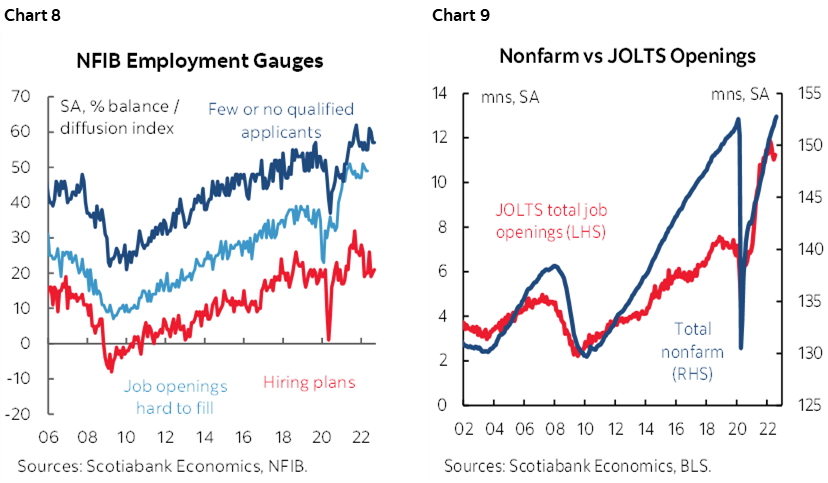
Declining small business hiring plans (chart 8) and job openings (chart 9) are less encouraging. It may be too early to expect nonfarm payrolls to begin to exhibit more of a weakening trend given that this tends to happen considerably after the peak in job openings that are the job market’s first response to souring prospects as shown in the chart.
Other job market signals will arrive during the week on the way to nonfarm, but they are unlikely to do well at informing the call. Wednesday’s ADP payrolls will be the second release since the methodology was revamped (again) and yet the 132k increase in August was well shy of the 308k increase in private nonfarm payrolls. JOLTS job openings will be updated for August on Tuesday. Also watch for the employment subindices to the ISM reports on Monday and Wednesday
ARE TEACHERS MESSING UP CANADIAN JOBS?
Canada updates job market conditions during September on Friday. Canada has ‘lost’ 114k jobs over the past three months and done so at a similar pace in each of the past three months. There is reason to believe that the job market has fewer supports, but there is also reason to believe that there have been significant distortions that have made it difficult to treat the losses quite so literally. There may even be some upside to job growth in September which is why I went with +30k.
One reason for a softening job market is that economic growth has softened into Q3. Okun’s ‘law’ is just a statistical observation more so than any ‘law’, but it works reasonably well to show the connections (chart 10). We can also see that small businesses have less bullish hiring plans (chart 11) and that job postings are cooling (chart 12).
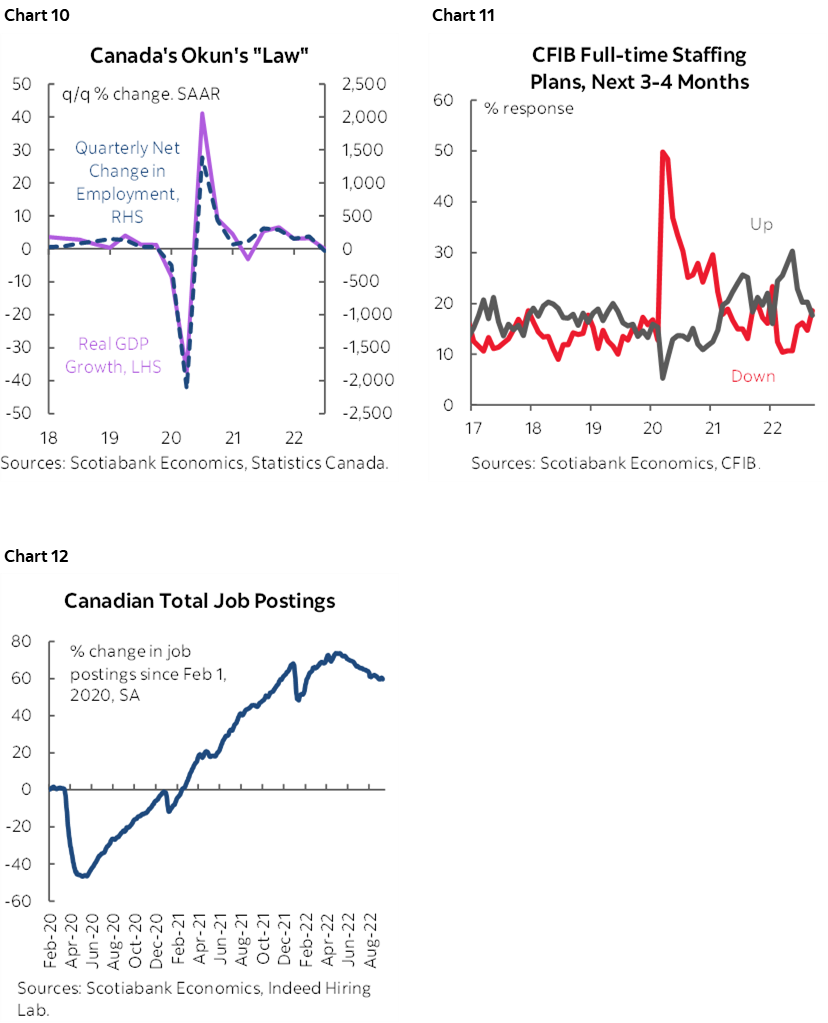
Yet what complicates things is that the education sector’s contract disputes are messing up the numbers. Chart 13 gives an idea of the magnitude of these disputes just for the province of Ontario.
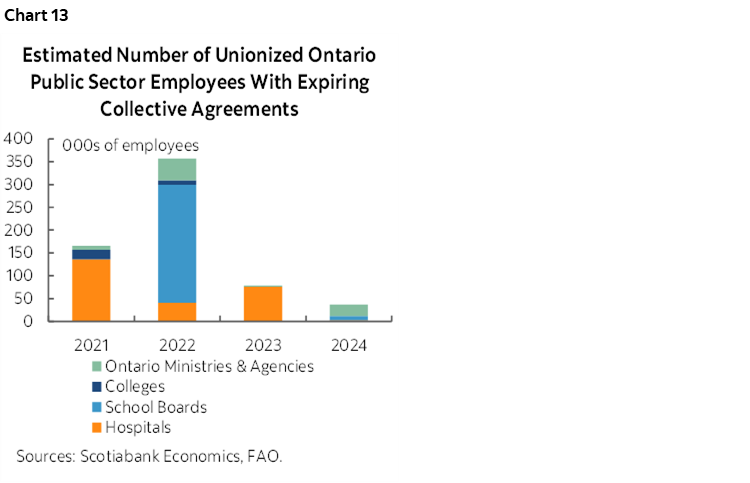
Education and trade have accounted for the bulk of the lost jobs over the past three months as shown in the front cover’s chart-of-the-week. This is because of a large number of overlapping contract disputes affecting education sector workers across the country which draws into question the reliability of the job figures. That’s because I don’t trust the seasonal adjustments or necessarily the ways in which teachers and others may be answering the survey’s questions as contract expirations have approached. Because this sector dominated the weakness in August total job market tallies it’s feasible that we’ll see more stabilization with back-to-school effects.
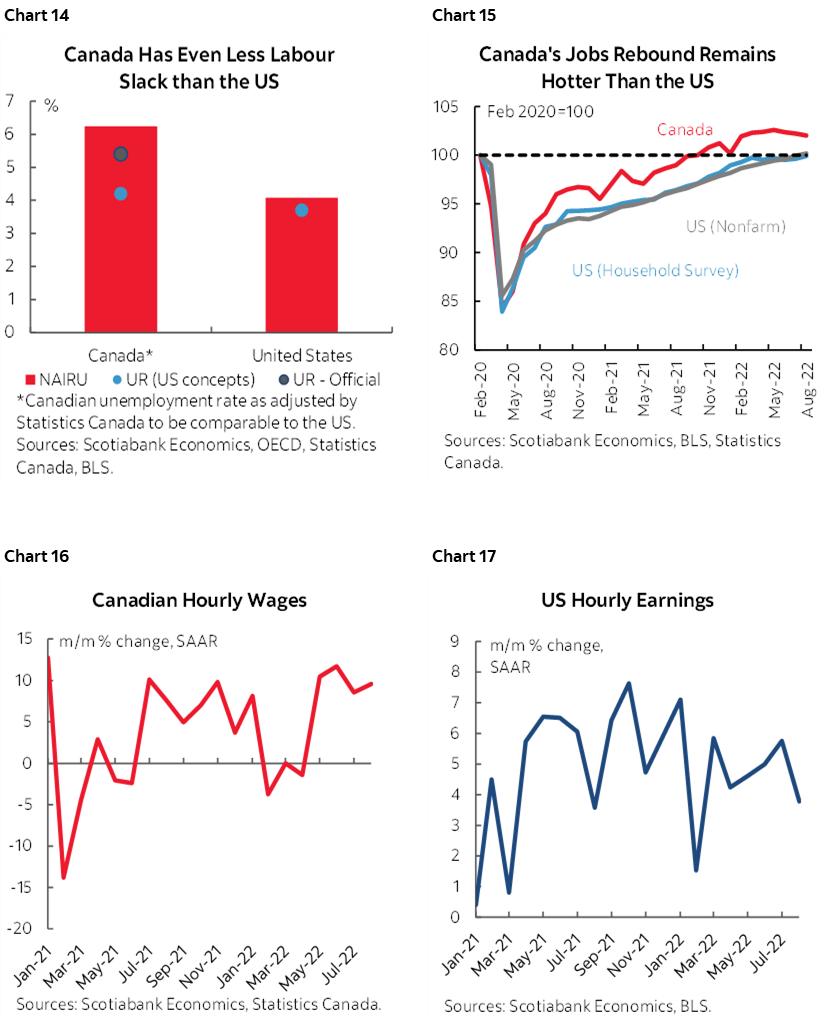
Still, even with over one hundred thousand jobs ‘lost’ over the past three months it remains the case that Canada’s job market is tighter than stateside. Estimating equilibrium or natural rates of unemployment is fraught with difficulties, but reasonable efforts suggest Canada’s unemployment rate is more deeply below this equilibrium rate than is the case in the US (chart 14). That’s because Canada’s employment rebound to date throughout the pandemic has been stronger than the US’s (chart 15) and because Canada’s job market tends to have a higher rate of structural unemployment than the US. The greater employment rebound has partially come at the expense of productivity growth that when combined with much more rapid recent wage gains in Canada (10% m/m SA 3moMA) than in the US (~5%) points toward more cost-push wage-price spiral effect concerns north of the border (charts 16, 17). It’s this measure that likely has the Bank of Canada more worried than small monthly variations in the total number of jobs that may be distorted in any event. In fact, high numbers of contract disputes likely represent ongoing upside risk to wage and price developments.
CENTRAL BANKS—THE FED’S RIPPLE EFFECTS
What would a week be without more central bank hikes and speeches? There will be plenty of speeches from officials at the world’s most influential central banks, but the actual decisions are more likely to be impactful to regional markets. The ongoing reverberations of the Fed’s communications on September 21st may be impactful to each decision.
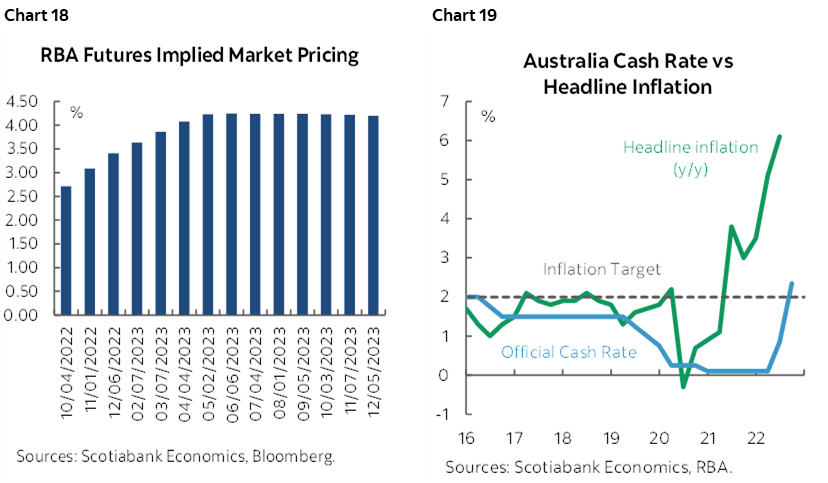
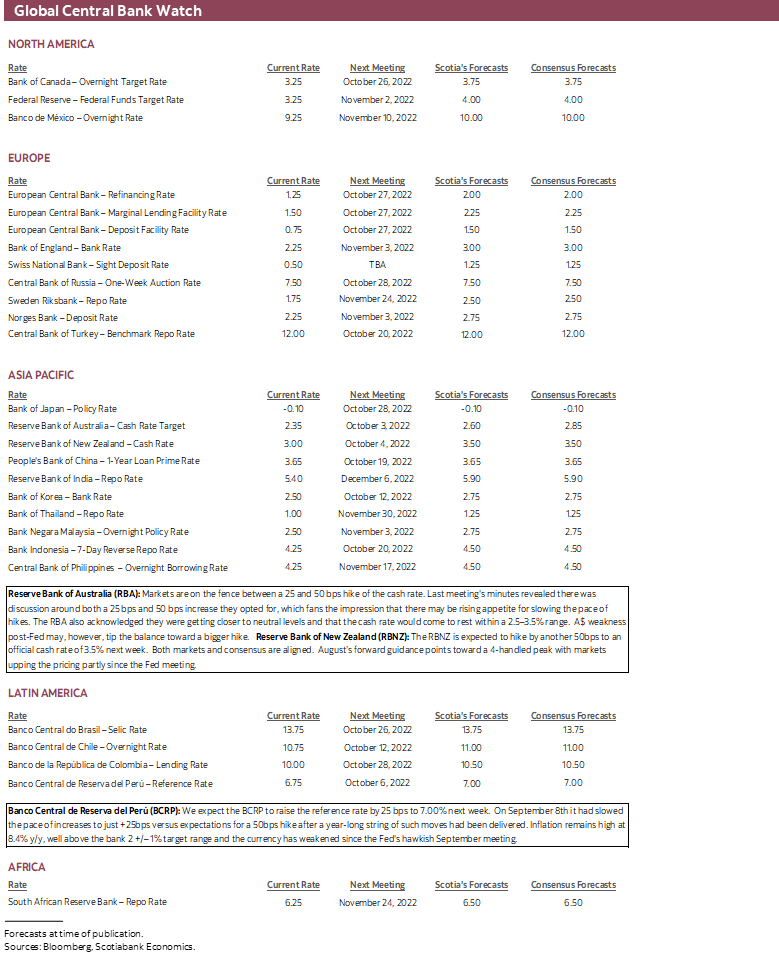
First up will be the Reserve Bank of Australia on Monday night (11:30pmET) into Tuesday Down Under. A 50bps hike to a cash rate target of 2.85% is plausible but hardly in the bag versus a more modest 25bps hike. Markets are on the fence between +25 and +50 but still expect considerably greater rate hikes ahead (chart 18) as inflation remains well above target (chart 19).
One reason for this is that minutes to the September 6th meeting provided on September 15th indicated that there was discussion around both a 25bps hike and the 50bps increase they opted for which fans the impression that there may be rising appetite for slowing the pace of hikes especially given the reference to how “They acknowledged that monetary policy operates with a lag and that interest rates had been increased quite quickly and were getting closer to normal settings.” A few days before the release of the minutes but after the meeting itself, Governor Lowe said he hoped that the cash rate would come to rest within a 2.5–3.5% rate with ‘a few’ more rate increases over coming meetings. This suggests that there is considerably more work to be done with the 2.35% current rate below the bottom of the range.
The fly in the ointment is that both developments preceded the Federal Reserve’s more aggressive actions on September 21st with much of the emphasis placed upon the more hawkish dot plot. The Australian dollar has been among the casualties in the face of the US dollar’s broadly based strength and has shed another couple of cents since then along a long-term declining trend from about 76 cents in April to roughly 65 cents now. This development might suggest a more pressing need for a bigger 50bps hike given the implications of ongoing currency weakening for import price pressures.
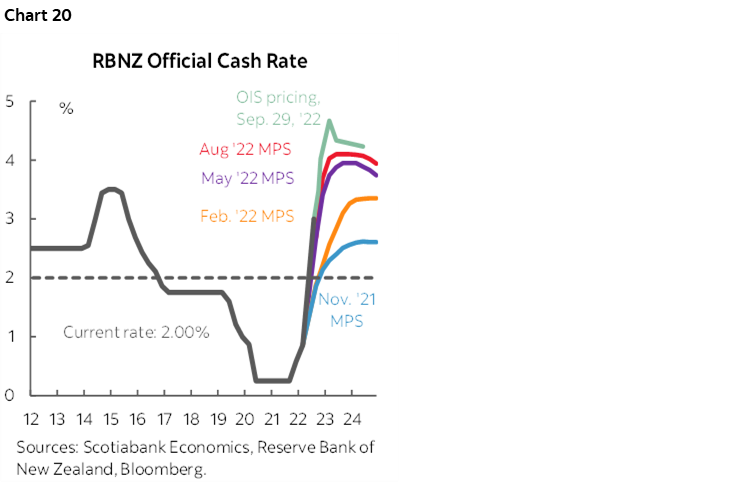
The RBNZ is expected to hike by another 50bps to an official cash rate of 3.5% on Tuesday night (9pmET) into Wednesday local kiwi time. Both markets and consensus are aligned. August’s forward guidance points toward a 4-handled peak with markets upping the pricing partly since the Fed meeting (chart 20). On September 26th, Governor Orr note that while “we still have some work to do” they still believe that the “tightening cycle is very mature.” Fair enough, this central bank started hiking before most others along with the Bank of Korea and some LatAm central banks and has now hiked by a total of 275bps. Much like the RBA, however, the RBNZ has watched its currency slide since the Fed pulled the curtains back more aggressively; the NZ$ has depreciated by almost a dime this year despite the RBNZ’s aggressive tightening.
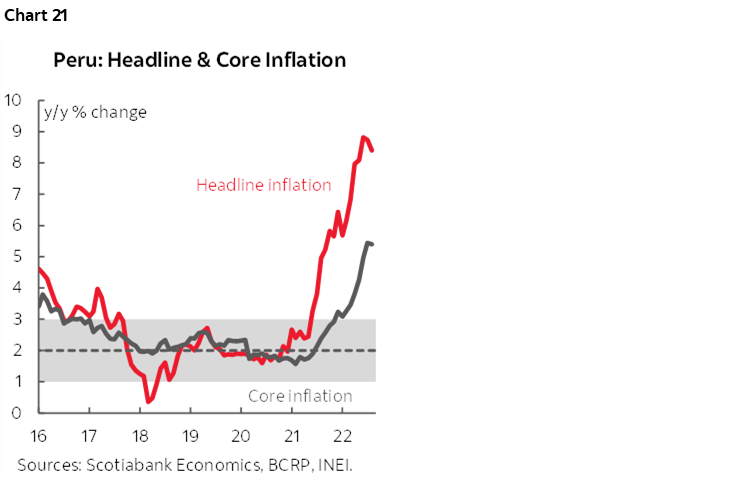
Peru’s central bank is expected to hike by 25bps to a reference rate of 7% on Thursday. Prior to the Fed meeting it had been looking as if the central bank might be signalling an end to the hike cycle. On September 8th it had slowed the pace of increases to just +25bps versus expectations for a 50bps hike after a year-long string of such moves had been delivered. Data released since then pointed to higher unemployment (7.3% from 6.8% in July) and slower than expected growth in overall economic activity according to July’s monthly gauge. However, inflation remains high (chart 21) and may be about to experience renewed upward pressure. That’s because like virtually everyone else, Peru’s currency stumbled anew after the Fed’s September 21st hike and guidance and is once again testing the weakest point since the start of the year. The inflation pass-through implications may prompt another hike.
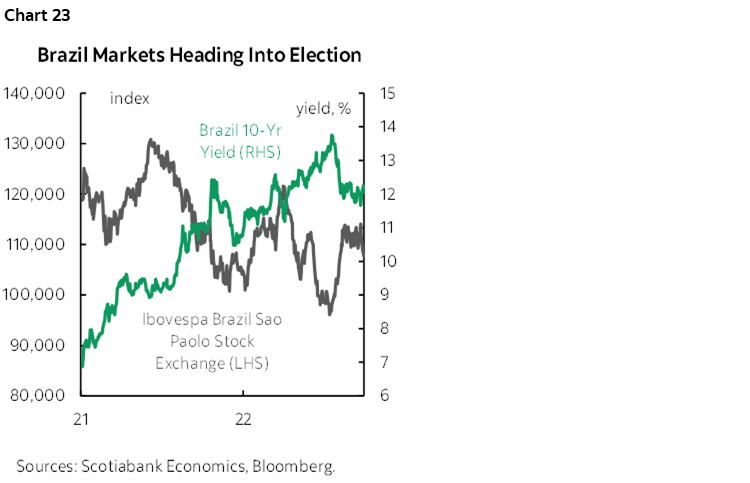
BRAZILIAN ELECTION—A FINE CHOICE
Brazil’s election on Sunday pits incumbent President Jair Bolsonaro against former President (“Lula”) Luiz Inácio Lula da Silva. Lula’s original twelve-year prison sentence for laundering money and general corruption was reduced to about one-and-a-half years and he was sprung from prison almost three years ago. He is a serious contender for the job according to the polls.
Bolsonaro is often referred to as Brazil’s answer to defeated US President Donald Trump. One manifestation of this adds to the uncertainty surrounding the outcome of the vote and potential implications for markets that may extend beyond Brazil is how Bolsonaro might respond to defeat if polls prove to be correct (chart 22). There are fears that he may reject the outcome and return Brazil to its history of military coups if he receives such support. These concerns are based upon his efforts to undermine the election process to date.

As Lula has climbed in the polls and such concerns have intensified, the real has been Latin America’s poorest performer against broadly based USD strength, two-year Brazilian yields have risen and Sao Paulo’s stock exchange has dropped by about 5% albeit within the context of global risk-off sentiment. Chart 23. Policy instability is an added factor as Lula’s leftist Workers Party is pitted against Bolsonaro’s right wing policies.
OTHER MACRO—PMIS, INFLATION AND GERMANY’S ECONOMY
Little else may ultimately matter much once Friday rolls around and nonfarm payrolls is out of the way. Still, the added calendar-based risks can be lumped into three categories.
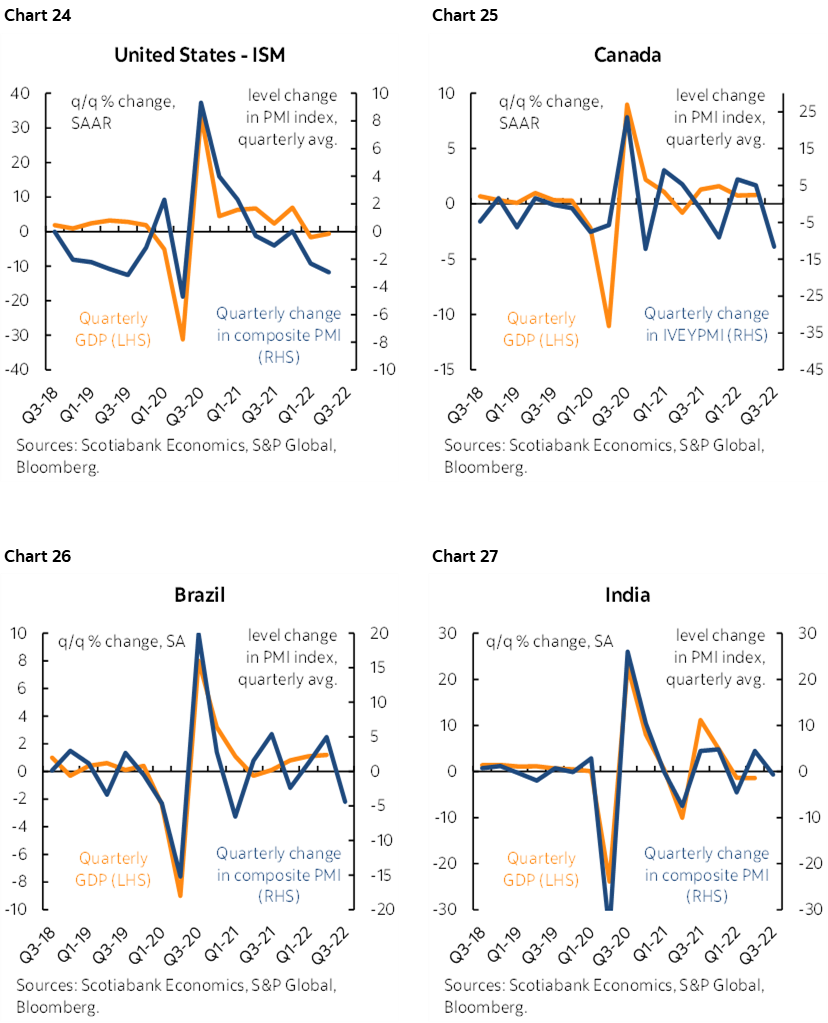
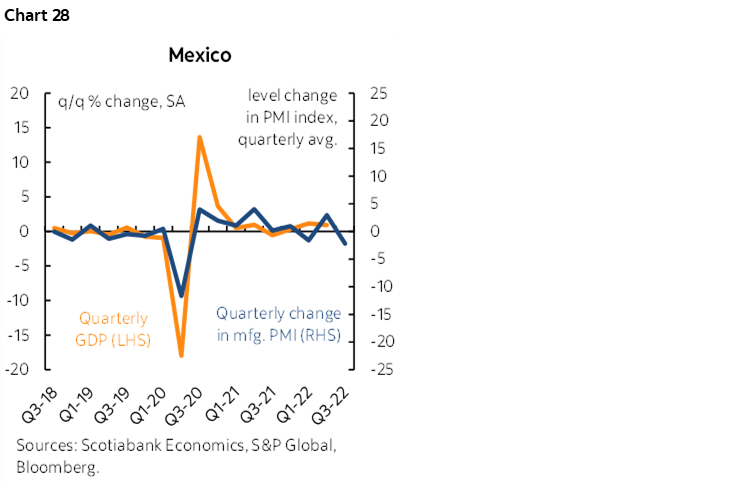
Progress toward repairing supply chains will be informed by soft survey-based data for September out of the US, Japan, India, parts of Latin America and Canada. Charts 24–28 show the individual connections to GDP growth as the surveys inform near-term expectations. The US will bring updates to ISM-manufacturing (Monday) and ISM-services (Wednesday) and the services PMI in particular has continued to signal moderate growth throughout the summer. Japan will update its quarterly Tankan survey at the start of the week and mild further improvements are expected. Canada’s Ivey PMI arrives on Thursday and it had rebounded the prior month but this gauge is a catch-all measure for everything in the private and public sectors of the economy and therefore hard to evaluate. A cleaner read will come from Canada’s S&P manufacturing PMI on Monday but there is no separate services PMI for Canada. Mexico updates the manufacturing PMI on Monday and Brazil refreshes PMIs on Wednesday. India’s PMIs arrive on Monday and Thursday with China’s private PMIs closing off the week.

DISCLAIMER
This report has been prepared by Scotiabank Economics as a resource for the clients of Scotiabank. Opinions, estimates and projections contained herein are our own as of the date hereof and are subject to change without notice. The information and opinions contained herein have been compiled or arrived at from sources believed reliable but no representation or warranty, express or implied, is made as to their accuracy or completeness. Neither Scotiabank nor any of its officers, directors, partners, employees or affiliates accepts any liability whatsoever for any direct or consequential loss arising from any use of this report or its contents.
These reports are provided to you for informational purposes only. This report is not, and is not constructed as, an offer to sell or solicitation of any offer to buy any financial instrument, nor shall this report be construed as an opinion as to whether you should enter into any swap or trading strategy involving a swap or any other transaction. The information contained in this report is not intended to be, and does not constitute, a recommendation of a swap or trading strategy involving a swap within the meaning of U.S. Commodity Futures Trading Commission Regulation 23.434 and Appendix A thereto. This material is not intended to be individually tailored to your needs or characteristics and should not be viewed as a “call to action” or suggestion that you enter into a swap or trading strategy involving a swap or any other transaction. Scotiabank may engage in transactions in a manner inconsistent with the views discussed this report and may have positions, or be in the process of acquiring or disposing of positions, referred to in this report.
Scotiabank, its affiliates and any of their respective officers, directors and employees may from time to time take positions in currencies, act as managers, co-managers or underwriters of a public offering or act as principals or agents, deal in, own or act as market makers or advisors, brokers or commercial and/or investment bankers in relation to securities or related derivatives. As a result of these actions, Scotiabank may receive remuneration. All Scotiabank products and services are subject to the terms of applicable agreements and local regulations. Officers, directors and employees of Scotiabank and its affiliates may serve as directors of corporations.
Any securities discussed in this report may not be suitable for all investors. Scotiabank recommends that investors independently evaluate any issuer and security discussed in this report, and consult with any advisors they deem necessary prior to making any investment.
This report and all information, opinions and conclusions contained in it are protected by copyright. This information may not be reproduced without the prior express written consent of Scotiabank.
™ Trademark of The Bank of Nova Scotia. Used under license, where applicable.
Scotiabank, together with “Global Banking and Markets”, is a marketing name for the global corporate and investment banking and capital markets businesses of The Bank of Nova Scotia and certain of its affiliates in the countries where they operate, including; Scotiabank Europe plc; Scotiabank (Ireland) Designated Activity Company; Scotiabank Inverlat S.A., Institución de Banca Múltiple, Grupo Financiero Scotiabank Inverlat, Scotia Inverlat Casa de Bolsa, S.A. de C.V., Grupo Financiero Scotiabank Inverlat, Scotia Inverlat Derivados S.A. de C.V. – all members of the Scotiabank group and authorized users of the Scotiabank mark. The Bank of Nova Scotia is incorporated in Canada with limited liability and is authorised and regulated by the Office of the Superintendent of Financial Institutions Canada. The Bank of Nova Scotia is authorized by the UK Prudential Regulation Authority and is subject to regulation by the UK Financial Conduct Authority and limited regulation by the UK Prudential Regulation Authority. Details about the extent of The Bank of Nova Scotia's regulation by the UK Prudential Regulation Authority are available from us on request. Scotiabank Europe plc is authorized by the UK Prudential Regulation Authority and regulated by the UK Financial Conduct Authority and the UK Prudential Regulation Authority.
Scotiabank Inverlat, S.A., Scotia Inverlat Casa de Bolsa, S.A. de C.V, Grupo Financiero Scotiabank Inverlat, and Scotia Inverlat Derivados, S.A. de C.V., are each authorized and regulated by the Mexican financial authorities.
Not all products and services are offered in all jurisdictions. Services described are available in jurisdictions where permitted by law.