Next Week's Risk Dashboard
- Another US government shutdown may happen…
- …disrupting many services and data releases like nonfarm
- Nonfarm payrolls preview
- Eurozone CPI just biding time as the ECB holds
- China PMIs to inform growth momentum
- US ISMs — services outperforming manufacturing
- RBA expected to hold
- RBI — markets versus economists
- BanRep — divisions likely to maintain a hold
- Global macro
Chart of the Week
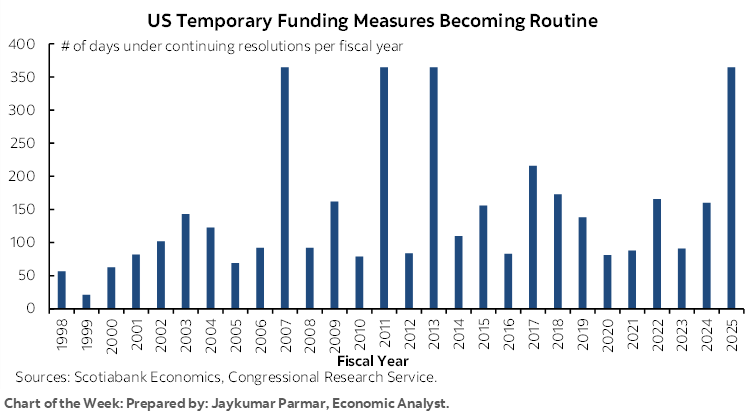
The possibility of another US government shutdown by mid-week ahead of Friday’s nonfarm payrolls will be the main events by way of calendar-based risk. If the government remains shut, then there will be no payrolls report this week along with a few other indicators like claims, construction spending, and factory orders. Markets may be left to dwell upon limited private sector readings on the state of the US job market that align poorly with nonfarm.
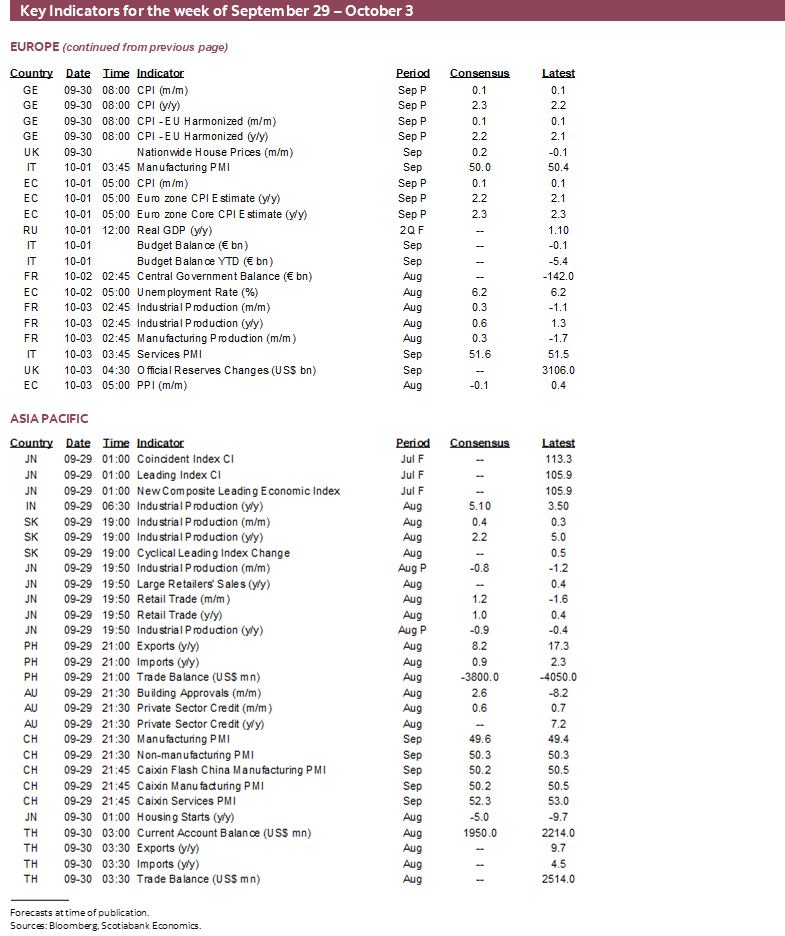
Global data risk will be elevated with Eurozone CPI and Chinese PMIs also due out. More central bank decisions will focus upon the RBA, RBI and BanRep.
NONFARM — CALCULATED RISK
Another set of US labour market readings arrives on Friday for the month of September. Notwithstanding the usual trepidation, I’ve gone negative on this one with a nonfarm payrolls estimate of -20k.
A negative reading would arise if the trend of cooling seasonally unadjusted hiring is paired with the recent pattern of shifting more closely toward average seasonal adjustment factors than the previously distorted ones that have been over-weighted to the pandemic era. Let’s bust that up into its components and then get into some scenarios.
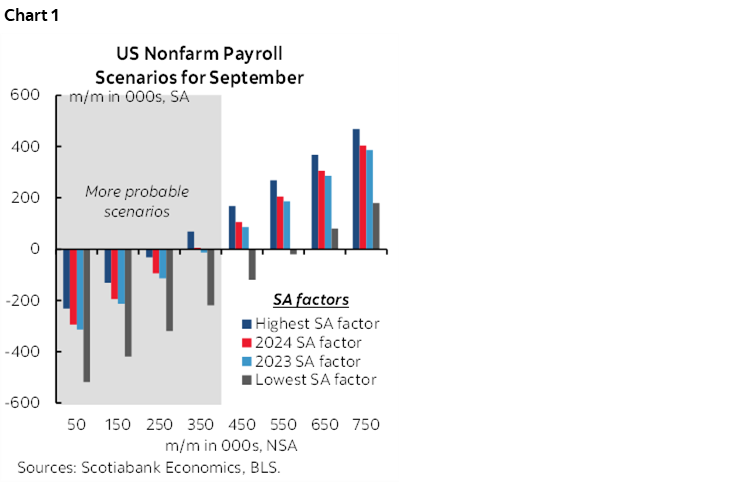
As backdrop to what follows, chart 1 lays out scenarios for what could happen to seasonally adjusted payrolls under various assumptions for SA factors and NSA changes that are within the wide range of past norms for September. I’ll argue that the risks are more heavily weighted to the downside as per the shaded area in the chart.
Seasonal Factors Are Drifting
Seasonal adjustment factors are subject to a recency bias in how they are calculated that places more weight upon recent years than earlier periods. That has long been the case and affected SA factors even during years before the pandemic.
The issue became more acute in the pandemic and post-pandemic era with each month’s SA factors being more heavily distorted relative to the historical pattern. The timing of openings and closings and restrictions in the economy, the timing of when vaccines arrived and fiscal and business practices were influenced messed up a lot of the data seasonality. What happened to the statistical methods used to estimate seasonality pushed the adjustment factors into the tails of historical norms when comparing like months in history.
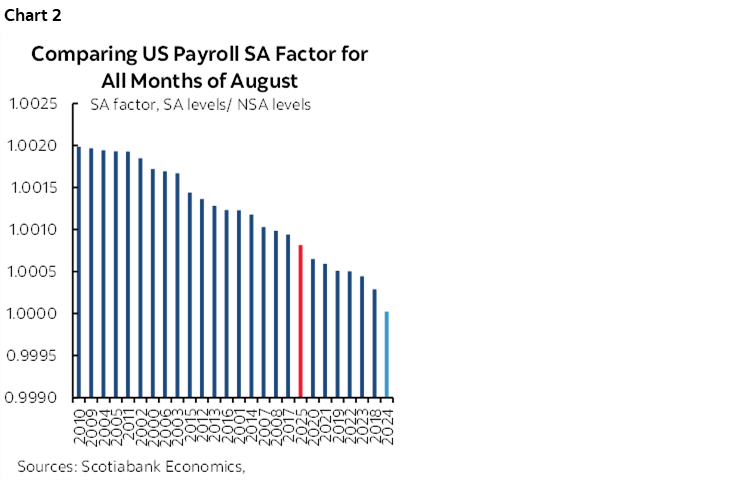
Over recent months, however, the BLS has been employing SA factor adjustments (X12A) that are moving back toward the middle of historical norms as the recency bias now shifts toward over-weighting the period since the pandemic’s depths and its initial recovery. As just one example, August’s SA factor went from being the lowest on record for like months of August in 2024, to closer to the middle this August (chart 2).
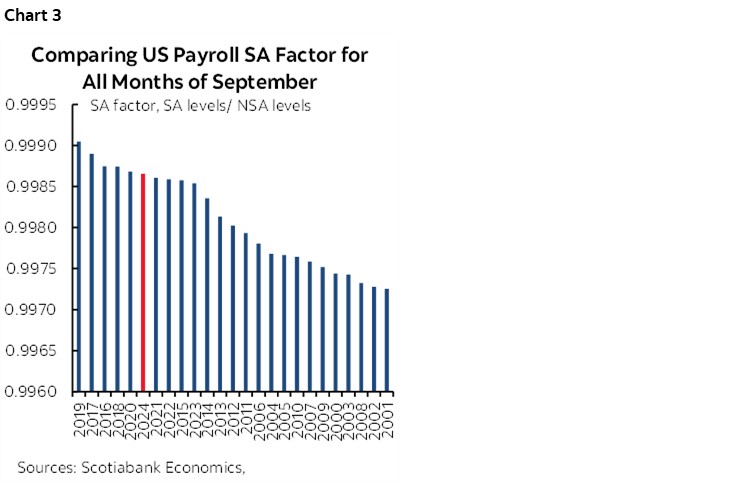
If September is a further extension of this pattern, then since the SA factor for September is normally below 1.0, then a move that inches back toward the middle would shave seasonally adjusted payrolls all else equal (chart 3). Even a small step could be impactful.
Cooler Seasonally Unadjusted Hiring
Over recent months, the pattern for seasonally unadjusted changes in nonfarm payrolls has been waning relative to like months in history. I’ll come back to why, but this pattern is expected to extend into September’s payrolls.
The Punchline
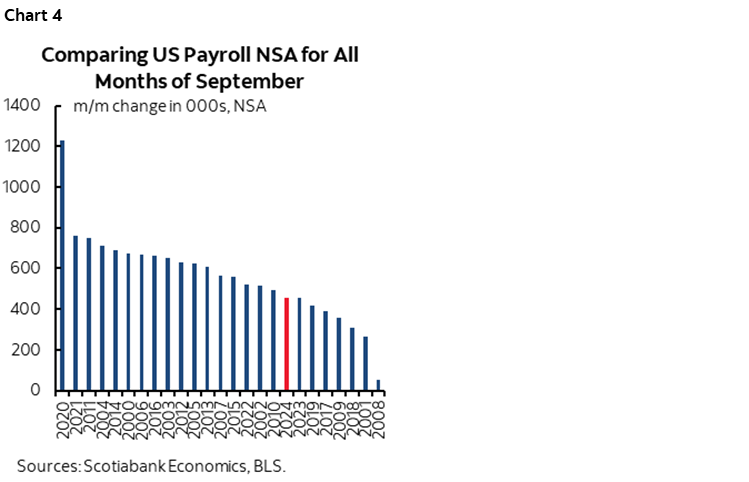
Chart 4 gives some scenarios of how NFP could change in seasonally adjusted terms under different assumptions for SA factors and NSA changes. The bottom line is that even a minor decline in the SA factor this September over last September combined with a modest cooling of seasonally unadjusted hiring would give a negative reading for SA NFP payrolls. Should the SA factor be lower—which would be in keeping with bigger downward estimates in recent months—and/or seasonally unadjusted hiring cools by more than a fairly modest amount, then payrolls could drop by materially more than my estimate. In fact, it’s not the least bit inconceivable that payrolls drop by a lot more. An NSA number of 350k or less paired with just a slight decline in the SA factor would yield a negative payrolls number.
The focus then turns toward why seasonally unadjusted hiring may be cooler than a normal month of September—perhaps a lot cooler.
- Companies appear to be cutting controllable costs—like labour—in order to mitigate the effects of rising costs that are out of their control—such as tariffs.
- Companies are seeking higher productivity and curtailing hiring and hours worked. Hours grew only 1.6% q/q SAAR in Q2 and are tracking a drop of –½% in Q3. Labour productivity surged by 3.3% q/q SAAR in Q2 and based on GDP tracking and hours worked appears to be growing at a healthy clip in Q3. A point of uncertainty in the economy makes this a somewhat typical effect.
- Tighter immigration policy has sharply cooled the potential availability of workers.
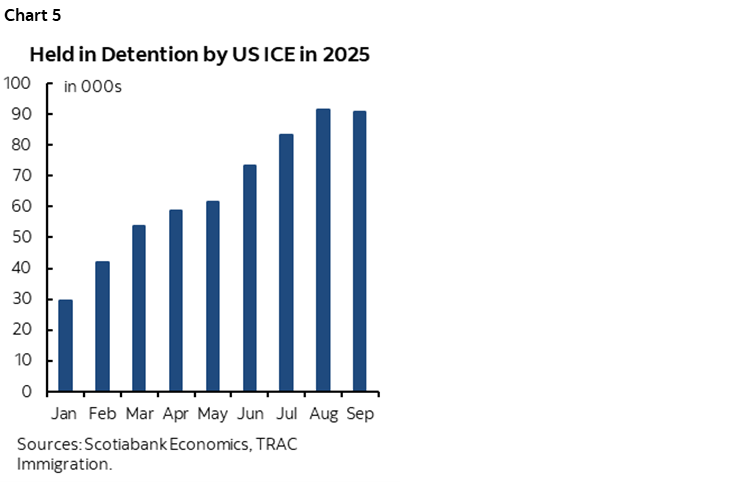
- By how much depends upon direct and indirect effects. ICE raids have been arresting about three-quarters of a million people at an annualized pace to date over the first three-quarters of the year (chart 5). They have probably driven a much greater number of potential workers underground. This is a material shock to the available pool of labour and hence crimps the ability to fill open postings. A surge in H-1B visa fees to $100k and the changed lottery system could negatively impact future payroll reports.
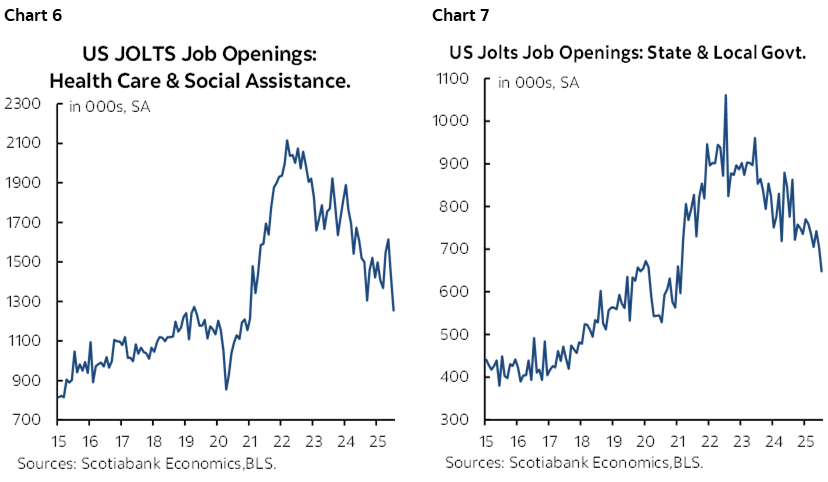
- Job postings have eased somewhat. That includes the education and healthcare sectors that have tended to lead past job growth (chart 6). Further, hiring by state and local governments have lessening ability to offset federal government firings (chart 7).
- We don’t have a solid answer for the effects of technological change on employment such as AI’s effects. Anecdotes point to crowding out tech workers. Several months this year have seen tech sector layoffs in the tens of thousands. We expect this to persist.
- DOGE cuts are reducing federal government payrolls with the bulk of the effect likely to come next month as layoff packages mature with the end of the US fiscal year. This could represent a very large negative shock to October payrolls in November.
Over the coming week we will get more information on the state of the US labour market that might influence the estimated change in payrolls. On the list are JOLTS job openings in August (Tuesday), ADP private payrolls for September (Wednesday), consumer confidence jobs plentiful in September, Challenger job cuts in September (Thursday) and the employment subindex to ISM-manufacturing (Monday) but not ISM-services that comes after payrolls. Bear in mind, however, that none of the readings perform very well as advance indicators of nonfarm payrolls.
Readings we do have include somewhat cooler Indeed job postings, and a mild increase in total weekly initial jobless claims between the August and September nonfarm reference periods.
It's doubtful that there will be a meaningful weather distortion. Weather-adjusted payrolls were not meaningfully different from official payrolls in August, and September’s weather did not seem abnormal. For one thing, the limited number of hurricanes thus far all veered away from the east coast.
Only 3k workers were on strike in September. Striking workers only drop off payrolls if they do not receive a paycheque through the whole nonfarm reference period. In any event, the numbers are small.
What could also affect the estimates is a high probability of revisions to August payrolls given that the 1st preliminary collection rate for nonfarm was 56.7% and is usually around 90%+ in subsequent revisions. We just can’t tell in which direction revisions will go, but it’s likely they will be modestly negative. If so, then this could pose a weaker jumping off point for September payrolls that would add some upside risk to the month-over-month change.
And throughout it all recall that nonfarm is its own beast. Its use of the birth-death model of controlling for estimated firm openings and closings can introduce surprises. So can the fact that nonfarm counts jobs versus the household survey that counts jobholders; therefore, nonfarm is susceptible to swings in multiple jobholders.
US GOVERNMENT SHUTDOWN—PATENTLY IRRESPONSIBLE BY BOTH SIDES
The US federal government could once again shut down on Wednesday October 1st after the conclusion of the current fiscal year. A full shutdown of all government services would occur if none of the twelve appropriations bills that approve funding are enacted. A partial shutdown would occur if some of them are enacted. This is an excellent primer on what’s involved with shutdowns.
Depending upon whether a potential shutdown affects the BLS or not, we may not get Friday’s nonfarm payrolls report. Further, the Trump administration has threatened that if a shutdown occurs, it may not furlough workers and could instead opt for mass firings. One could question the credibility of such a threat but it would be a risk to the next payrolls report when the DOGE cuts are already likely to drag down payrolls as layoff packages expire.
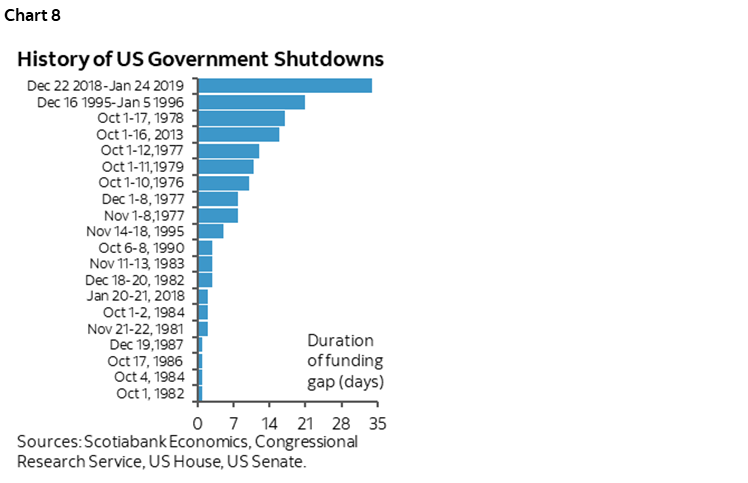
Chart 8 ranks past shutdowns according to their lengths. There have been 20 of them since the 1970s. Most are short-lived. A handful of them have exacted a material toll on the economy.
It’s important to emphasize that the issue is the required passage of bills to free up funding already approved and not by, say, an inability to issue debt because the debt ceiling has been hit.
A shutdown could be avoided if a Continuing Resolution temporarily extends funding in time. A CR could extend funding by days to up to a year, but it would be unlikely to have any such arrangement expire just before the 2026 midterm election.
Past lengthy shutdowns can cost the US economy billions of dollars through suspended pay for some furloughed employees and business interruptions. Not all of that is subsequently made up when the government reopens.
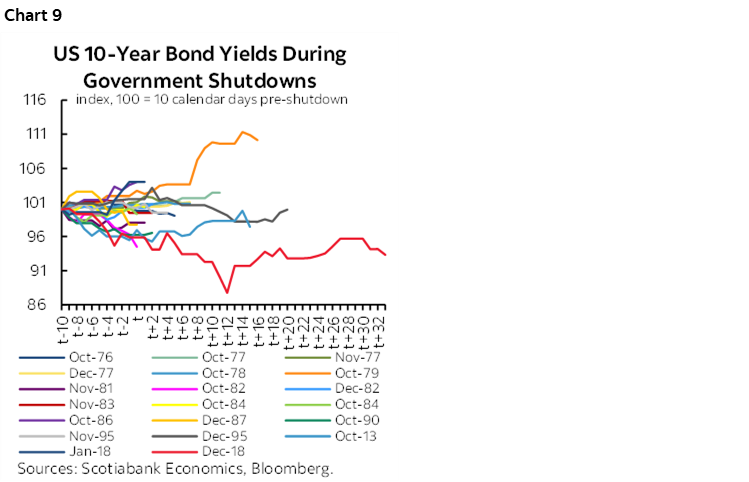
As for financial markets, chart 9 illustrates what happened to the 10-year Treasury yield around past shutdowns but without controlling for other developments that may have occurred around those times. More often than not there is a modest rally going into and during the shutdown.
Frankly, the bigger deal is the disgusting failures of both political parties to ensure stability in the delivery of services upon which millions depend. It happens too often for an advanced economy.
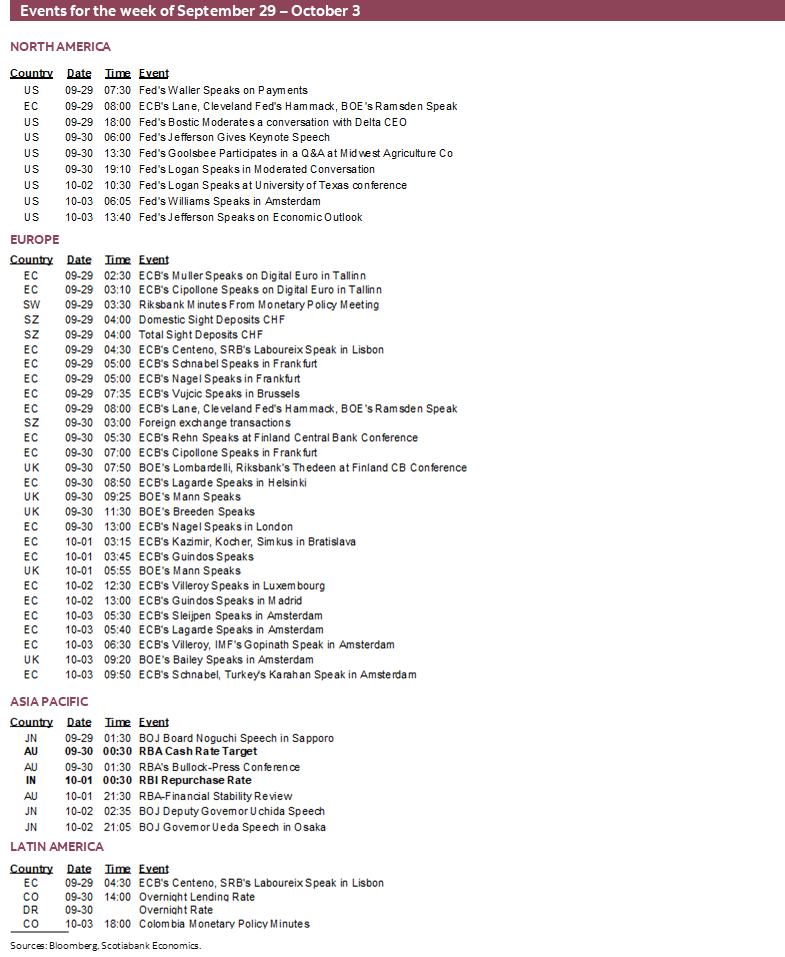
CENTRAL BANKS—TWO HOLDS AND A MAYBE
RBA—Hello, Goodbye
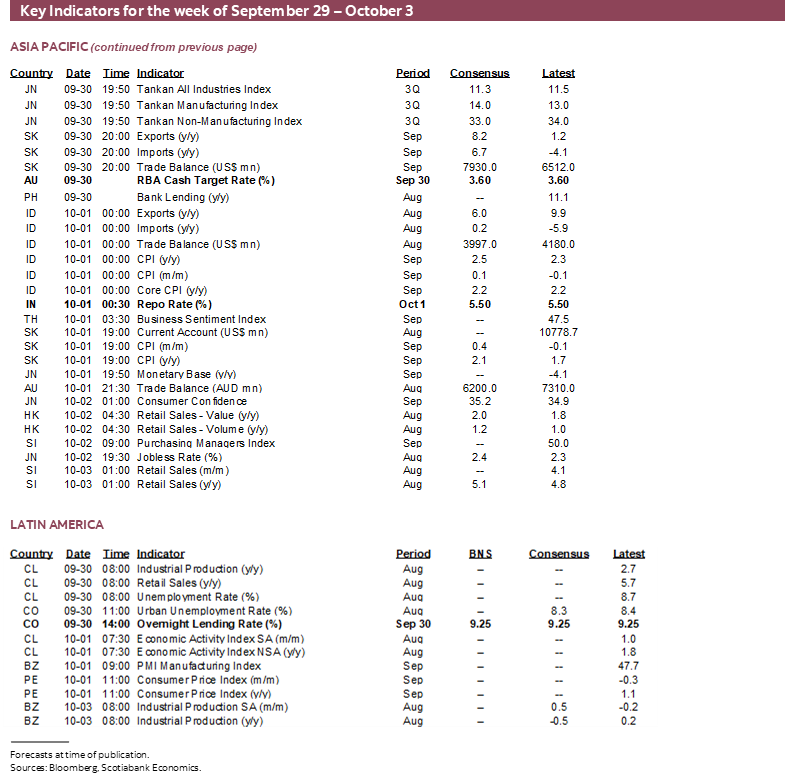
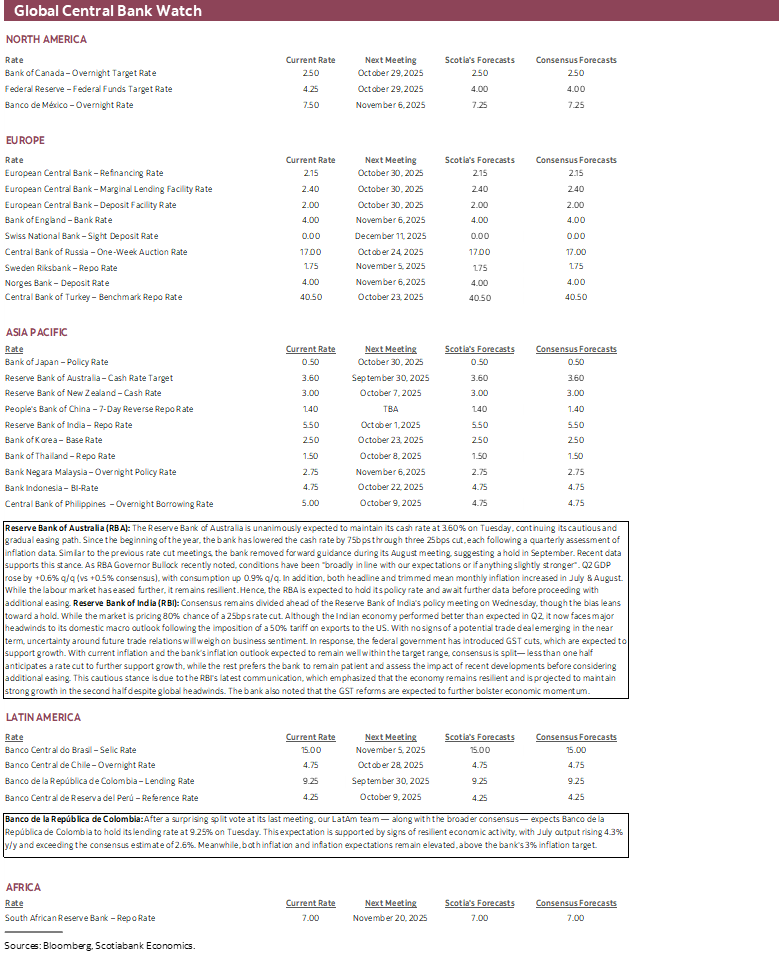
This should be a no brainer. The Reserve Bank of Australia is universally expected to hold its cash rate at 3.6% on Tuesday. Consensus is unanimous. Markets are fully priced for a hold.
Key, however, may be guidance. Markets are on the fence with half of a 25bps cut priced for the next meeting on November 4th. The RBA has an easing bias toward conditions over the coming year, but a hold now and a cut at the next meeting would extend the pattern of cutting at meetings when it delivers a full Statement on Monetary Policy with fresh forecasts that are due at the February, May, August and November meetings.
The fact inflation has risen back to 3% y/y with GDP growth beating expectations also counsels a hold. The economy grew by 0.6% q/q SA nonannualized in Q2 with a mild positive revision to Q1 growth at 0.3%.
BanRep—Holding On
Most expect Colombia’s central bank to hold its overnight lending rate at 9.25% on Tuesday. That includes our economists in Bogotá.
First up is consideration of the signals being sent by the Board that is made up by the Minister of Finance who presides over the Board, and six members including the Governor. The decision to hold at its last meeting on July 31st was supported by four members as only one advocated a 25bps cut and two favoured a 50bps cut. This divide may stand or strengthen in favour of a hold at this meeting.
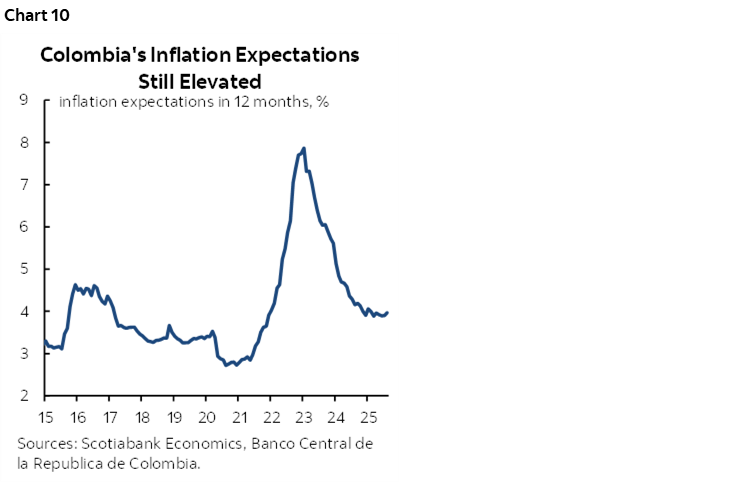
One major reason for this is that inflation data since that decision has been somewhat warmer that consensus expected. July ticked higher to 4.9% y/y and August again moved higher to 5.1%. Core CPI has been holding around 4.9% y/y. Both readings are far above BanRep’s 3% +/-1% target range. Inflation expectations also remain elevated and sticky (chart 10)
RBI—Economists Versus Markets
A hold would surprise markets more than economists when the Reserve Bank of India offers its latest decision on Wednesday. Markets are roughly 80% priced for a cut, but the majority of economists leans toward a hold.
The RBI has the cover to cut given that inflation remains low at close to 2% y/y. The government has been applying some measures aimed at encouraging growth—such as a GST cut-but US tariffs are a downside risk to the economy.
GLOBAL MACRO
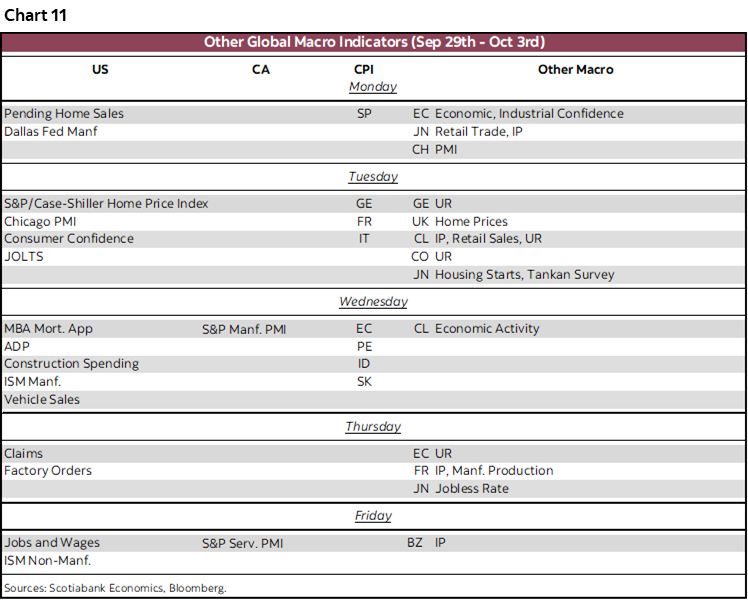
A wave of global macro releases lies ahead with the biggest ones from China, Europe and the US. The rest will be covered in daily notes throughout the week and are highlighted in chart 11. Jay Parmar pitches in with some thoughts on them below.
In China, the focus will be on the PMIs (Monday), offering an early insight into how the economy ended Q3. The state PMI, which is more reflective of activity at state-owned enterprises, is holding steady near the 50 mark that separates expansion from contraction and is expected to remain broadly flat. Meanwhile, China's more exporter-oriented private PMI is expected to soften slightly, following a strong pace of service activity due to summer travel demand. The manufacturing PMI in this report may continue to hover around the neutral line.
ECB policymakers will receive one final inflation reading for September ahead of the October 30th meeting. However, this print is unlikely to carry much weight, as the ECB is widely expected to keep its policy rate unchanged.
Spain kicks off the week's inflation releases on Monday, followed by France, Germany, and Italy on Tuesday. The eurozone aggregate will be published on Wednesday. Headline inflation is expected to rise to 2.2% y/y from 2.0% in August, while core inflation is projected to hold steady at 2.3%. The key question is whether elevated service inflation will continue to follow the recent downward trend.
The US refreshes ISM PMIs starting with Wednesday’s manufacturing reading and then Friday’s services gauge after we get (may) get payrolls. In addition to Friday’s payrolls, a government shutdown on Wednesday could delay the release of construction spending and factory orders but the rest of the week’s data is from private groups.
DISCLAIMER
This report has been prepared by Scotiabank Economics as a resource for the clients of Scotiabank. Opinions, estimates and projections contained herein are our own as of the date hereof and are subject to change without notice. The information and opinions contained herein have been compiled or arrived at from sources believed reliable but no representation or warranty, express or implied, is made as to their accuracy or completeness. Neither Scotiabank nor any of its officers, directors, partners, employees or affiliates accepts any liability whatsoever for any direct or consequential loss arising from any use of this report or its contents.
These reports are provided to you for informational purposes only. This report is not, and is not constructed as, an offer to sell or solicitation of any offer to buy any financial instrument, nor shall this report be construed as an opinion as to whether you should enter into any swap or trading strategy involving a swap or any other transaction. The information contained in this report is not intended to be, and does not constitute, a recommendation of a swap or trading strategy involving a swap within the meaning of U.S. Commodity Futures Trading Commission Regulation 23.434 and Appendix A thereto. This material is not intended to be individually tailored to your needs or characteristics and should not be viewed as a “call to action” or suggestion that you enter into a swap or trading strategy involving a swap or any other transaction. Scotiabank may engage in transactions in a manner inconsistent with the views discussed this report and may have positions, or be in the process of acquiring or disposing of positions, referred to in this report.
Scotiabank, its affiliates and any of their respective officers, directors and employees may from time to time take positions in currencies, act as managers, co-managers or underwriters of a public offering or act as principals or agents, deal in, own or act as market makers or advisors, brokers or commercial and/or investment bankers in relation to securities or related derivatives. As a result of these actions, Scotiabank may receive remuneration. All Scotiabank products and services are subject to the terms of applicable agreements and local regulations. Officers, directors and employees of Scotiabank and its affiliates may serve as directors of corporations.
Any securities discussed in this report may not be suitable for all investors. Scotiabank recommends that investors independently evaluate any issuer and security discussed in this report, and consult with any advisors they deem necessary prior to making any investment.
This report and all information, opinions and conclusions contained in it are protected by copyright. This information may not be reproduced without the prior express written consent of Scotiabank.
™ Trademark of The Bank of Nova Scotia. Used under license, where applicable.
Scotiabank, together with “Global Banking and Markets”, is a marketing name for the global corporate and investment banking and capital markets businesses of The Bank of Nova Scotia and certain of its affiliates in the countries where they operate, including; Scotiabank Europe plc; Scotiabank (Ireland) Designated Activity Company; Scotiabank Inverlat S.A., Institución de Banca Múltiple, Grupo Financiero Scotiabank Inverlat, Scotia Inverlat Casa de Bolsa, S.A. de C.V., Grupo Financiero Scotiabank Inverlat, Scotia Inverlat Derivados S.A. de C.V. – all members of the Scotiabank group and authorized users of the Scotiabank mark. The Bank of Nova Scotia is incorporated in Canada with limited liability and is authorised and regulated by the Office of the Superintendent of Financial Institutions Canada. The Bank of Nova Scotia is authorized by the UK Prudential Regulation Authority and is subject to regulation by the UK Financial Conduct Authority and limited regulation by the UK Prudential Regulation Authority. Details about the extent of The Bank of Nova Scotia's regulation by the UK Prudential Regulation Authority are available from us on request. Scotiabank Europe plc is authorized by the UK Prudential Regulation Authority and regulated by the UK Financial Conduct Authority and the UK Prudential Regulation Authority.
Scotiabank Inverlat, S.A., Scotia Inverlat Casa de Bolsa, S.A. de C.V, Grupo Financiero Scotiabank Inverlat, and Scotia Inverlat Derivados, S.A. de C.V., are each authorized and regulated by the Mexican financial authorities.
Not all products and services are offered in all jurisdictions. Services described are available in jurisdictions where permitted by law.