Next Week's Risk Dashboard
- Federal Reserve to cut 25bps…
- …and increase implied easing in the dots…
- …as it gambles on the balance of dual mandate risks…
- …amid concern over political meddling
- BoC to cut — cases for and against
- Why the BoC should just leave CORRA alone
- Canadian CPI — a high bar to derail a cut
- BoE on extended hold?
- UK jobs, CPI unlikely to influence BoE’s decision
- BoJ to wait it out at least until fresh forecasts
- Norges Bank’s cut guidance may have to wait longer
- CBCT in no rush
- BI could surprise amid political turmoil
- BCB on an extended hold
- SARB — what did you say your target was?
- Aussie jobs — establishing a new trend
- Other: US retail sales, Aussie jobs, NZ GDP, Canadian & LatAm releases
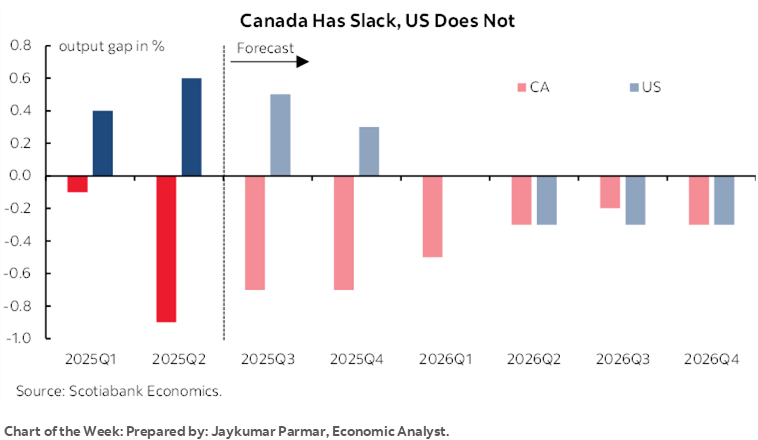
Chart of the Week
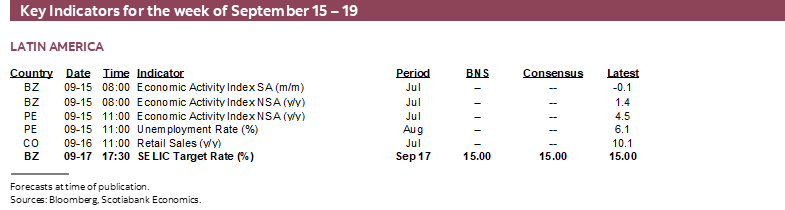
The coming week will be packed with central bank decisions and significant data risk across markets. Decisions will be delivered by the Federal Reserve, Bank of Canada, Bank of England, Bank of Japan, Norges Bank, and central banks in Brazil, Taiwan, Indonesia and South Africa. Key data includes Canadian CPI, UK CPI, job market readings from Australia and the UK, US retail sales, and growth readings from several LatAm economies and New Zealand. The strongest focus here will be placed upon the Fed and BoC decisions.
Federal Reserve—It’s All In The Dots—Until Next Time
The two-day FOMC meeting is expected to culminate in a decision to cut the fed funds policy rate by 25bps on Wednesday at 2pmET when the statement lands. The Committee will also release a fresh Summary of Economic Projections including a new ‘dot plot’ of policy rate expectations to provide a complete refresh of the forecasts of individual members. Chair Powell’s customary press conference will commence thirty minutes later and last for probably around 45 minutes, maybe more or less.
Almost all forecasters expect a 25bps rate cut. Fed fund futures are priced for -25bps and a touch more as some market participants retain a low probability of an outsized 50 move. That seems implausible.
Our forecast is for the FOMC to embark upon a steady easing path marked by six consecutive quarter-point rate cuts before landing at a trough of 3% by 2026Q2. That would leave the policy rate toward the upper end of most estimates of neutral.
Such a view is delivered with high trepidation over whether it’s the right thing to be delivering. Here’s the case.
Chair Powell clearly pivoted at his Jackson Hole speech on August 22nd. The messaging in Powell’s speech offered strong shades of a tilt back toward de-emphasizing concerns about inflation risk in favour of maximum employment which was Powell’s bias for too long coming out of the pandemic. Here’s the proof in several snippets of what he said. The money quote was this one with emphasis added:
"Putting the pieces together, what are the implications for monetary policy? In the near term, risks to inflation are tilted to the upside, and risks to employment to the downside—a challenging situation. When our goals are in tension like this, our framework calls for us to balance both sides of our dual mandate. Our policy rate is now 100 basis points closer to neutral than it was a year ago, and the stability of the unemployment rate and other labor market measures allows us to proceed carefully as we consider changes to our policy stance. Nonetheless, with policy in restrictive territory, the baseline outlook and the shifting balance of risks may warrant adjusting our policy stance."
On labour markets, Powell’s speech flagged revisions but more importantly a bias toward erring on the side of ensuring the recent softness does not have further and deeper legs to it and in favour of acting pre-emptively which places the emphasis on the concluding part of this quote:
"This slowdown is much larger than assessed just a month ago, as the earlier figures for May and June were revised down substantially. But it does not appear that the slowdown in job growth has opened up a large margin of slack in the labor market—an outcome we want to avoid."
and
"Overall, while the labor market appears to be in balance, it is a curious kind of balance that results from a marked slowing in both the supply of and demand for workers. This unusual situation suggests that downside risks to employment are rising. And if those risks materialize, they can do so quickly in the form of sharply higher layoffs and rising unemployment."
Powell also shifted his stance on inflation risk. He was incrementally more sanguine on inflation risk including tariff effects and generally dismissive toward a sustained bout of inflation risk:
"A reasonable base case is that the effects will be relatively short lived—a one-time shift in the price level. Of course, "one-time" does not mean "all at once." It will continue to take time for tariff increases to work their way through supply chains and distribution networks. Moreover, tariff rates continue to evolve, potentially prolonging the adjustment process. It is also possible, however, that the upward pressure on prices from tariffs could spur a more lasting inflation dynamic, and that is a risk to be assessed and managed. One possibility is that workers, who see their real incomes decline because of higher prices, demand and get higher wages from employers, setting off adverse wage–price dynamics. Given that the labor market is not particularly tight and faces increasing downside risks, that outcome does not seem likely."
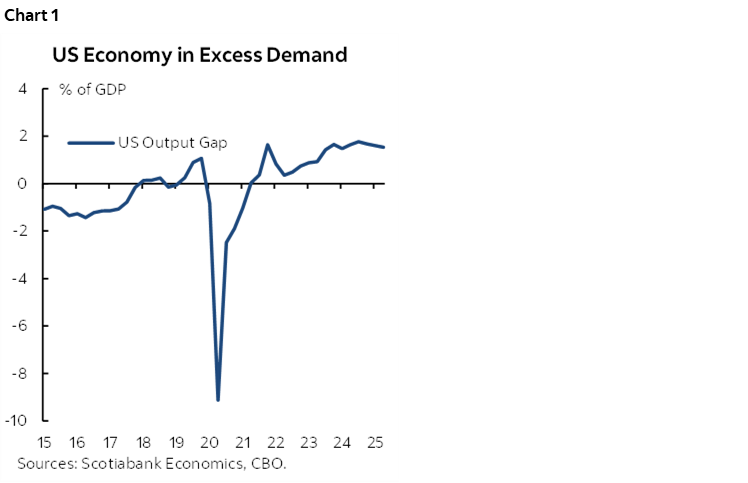
These points represented a major pivot for Powell who had previously indicated that he wanted to take his time to assess whether a suite of policy developments and broader factors would cause inflation to stray from the 2% target more seriously than the unemployment to stray from the roughly 4% full employment unemployment rate. In my opinion, this is still an open experiment that has not yet been settled not only given recent evidence on inflation (here) but also forward risks. The US economy lies in a state of excess aggregate demand (chart 1) and is facing inflation risk from tariffs and supply chain turmoil that may be more persistent than what official expect.
Nevertheless, developments since Powell’s abrupt pivot have reinforced the importance of the pivot including:
- another weak nonfarm payrolls report with just 22k jobs created in August that might have actually been even weaker than stated (recap here).
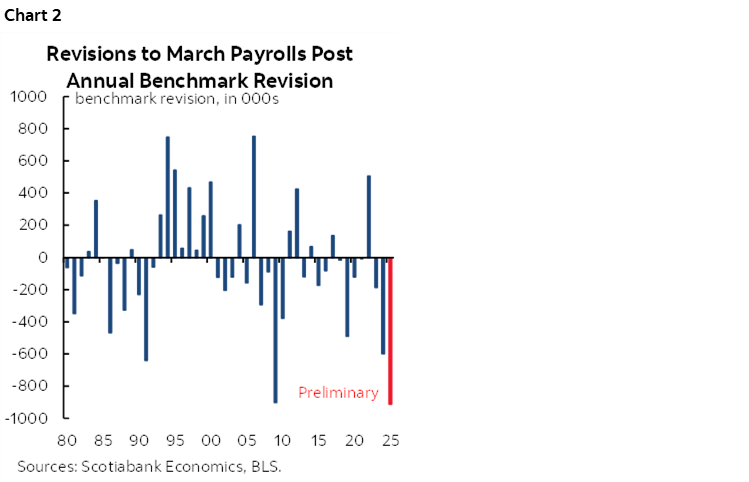
- a record of just under one million jobs wiped off nonfarm payrolls in the annual benchmarking revisions as at March 2025 (chart 2). That chopped in half the average monthly gain in nonfarm payrolls to about 75k over the April 2024 to March 2025 period and indicated a materially weaker job market even before the Trump administration began tightening immigration.
Throughout it all is rising political pressure on the Federal Reserve that is of deep concern. The Trump administration is stacking the Board with two dovish Governors to date (Waller, Bowman), another waiting in the wings for Monday’s Senate confirmation vote (Miller), risks surrounding another Governor’s stature as courts weigh in on whether Trump can fire Lisa Cook or not especially given the revelation she properly disclosed her mortgage as a vacation property, and ultimately the coming appointment of a shadow Fed chair weeks from now.
Further, the five-year reviews of the regional Fed presidents occur by late February and must be approved by the Board, making them vulnerable to replacement. Regional presidents are appointed by the local boards (not the Trump administration), but the Fed’s Board appoints ‘class C’ directors to each district bank and those class C directors choose their local board chair and deputy chair who may then influence the choice of President. Go here for a further explanation. Ergo, an insidious backdoor way of stacking the regional Presidents with dovish candidates may exist should plan A to stack the Board not bear enough fruit to Trump’s liking.
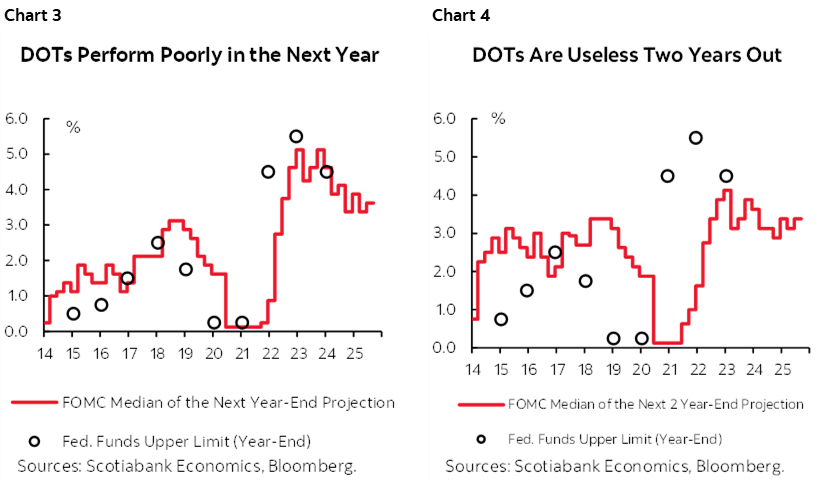
Because of the high potential for meddling with the functioning of the Federal Reserve, markets may be wise to fade the dot plot that is offered at this meeting and not just because the further out one goes, the worse the dot plot performs (charts 3, 4). Notable changes from the June dot plot are likely. For one, the seven members who put down no cuts this year are likely to abandon ship in whole or as a majority. A key uncertainty is whether the median shifts 50bps of cuts this year to 75bps or more. With new information since June, it seems more likely than not that the median Committee member will add to easing. 75bps of cuts could imply cutting at each remaining meeting assuming the median member does not support an outsized move along the way. More than 75bps of cuts implies openness to at least one outsized move which seems unlikely.
As for next year, the Committee already had 75bps of cuts in its projections from now to the end of 2026. To leave it at that would be a hawkish signal to markets. More likely is that they will add a little more to easing given developments since June. And once again it’s highly unlikely that we should attached much significance to the Committee’s dispersed views on the neutral rate; the June estimates were all over the map (chart 5).
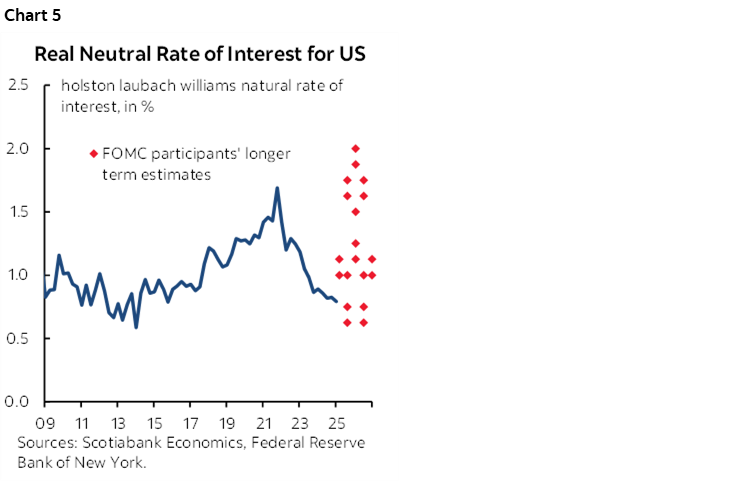
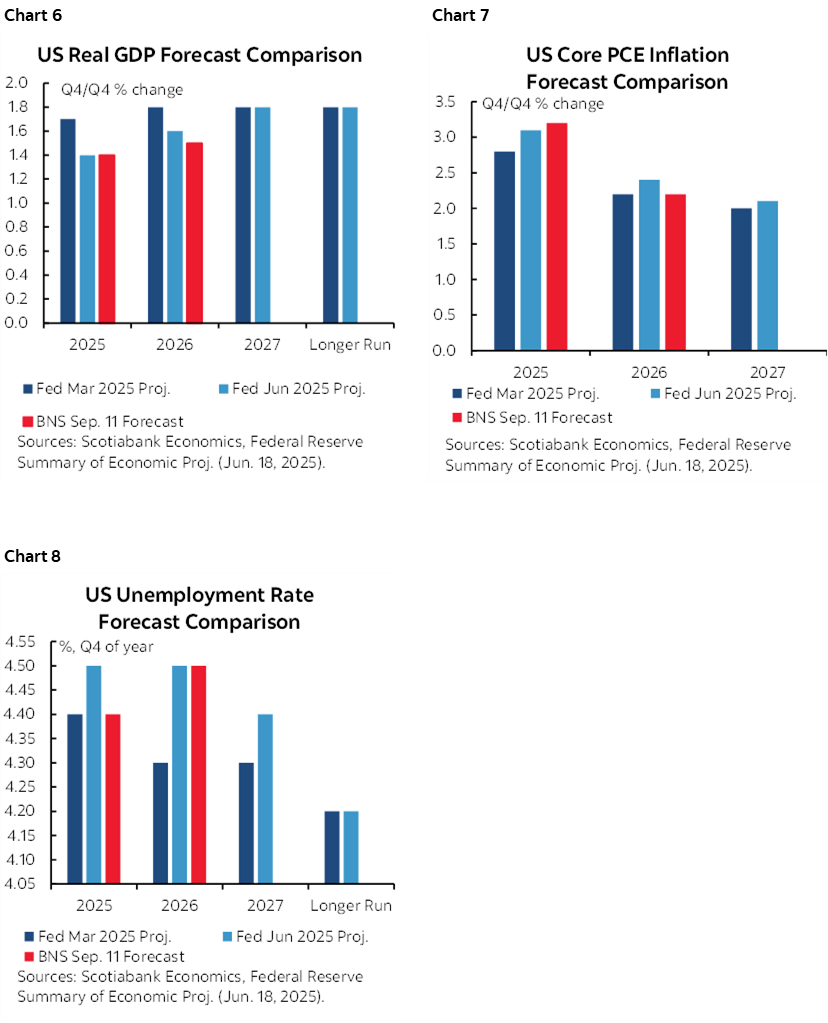
Charts 6–8 compare our latest forecasts for US GDP, the unemployment rate and core PCE inflation to the FOMC’s June Summary of Economic Projections. The Committee may well not go as far on revisions as our forecasts would imply.
BANK OF CANADA—WEIGHING THE CUT VERSUS HOLD CASES & WHAT TO DO ABOUT CORRA
We expect the BoC to cut by 25bps on Wednesday and sound open to further easing in keeping with our forecast for 50bps of cuts this year until taking them back later next year. The statement arrives at 9:45amET and will be followed by a press conference hosted by Governor Macklem forty-five minutes later. The next MPR including updated scenarios or forecasts is due at the October decision. The BoC has demonstrated that it does not need an MPR to deliver a rate change.
Be Patient with CORRA
No other major policy shifts are expected at this meeting.
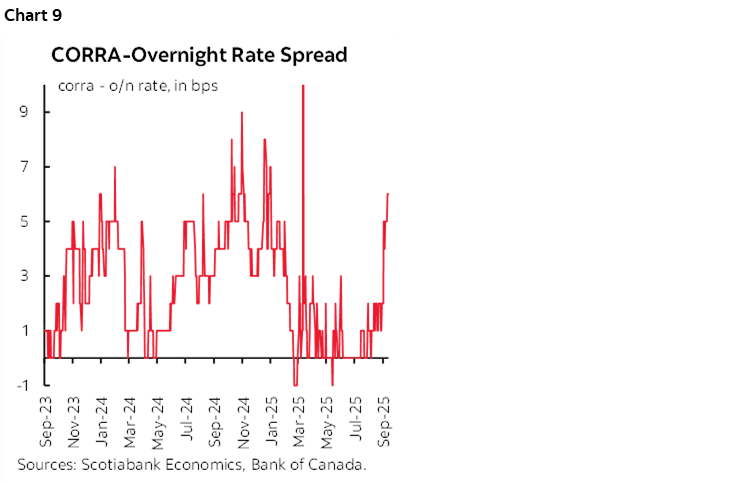
An issue of distant secondary concern relative to what they may do on the policy rate concerns developments across relative rates in funding markets. It may be too early for the BoC to react to the rise of the CORRA market rate above its policy rate to about 6bps (chart 9). As an aside, more ink has been splashed on this one topic by the street than what really matters: the policy rate.
For one thing, the wider spread is a very recent development concentrated in the first few days of this month. The BoC isn’t that reactionary. Further, they could be at risk of overreacting to a temporary situation if they roll out more aggressive policy options and therefore at risk of compounding funding market distortions and uncertainties.
The BoC may see the CORRA overshoot as a function of funding market developments amid rising speculation in favour of pricing rate cuts as it did when this issue flared in 2024 and earlier this year. They issued staff research papers in 2024 explaining their staff’s position that the earlier distortions were due to market positioning (here and here). One of the authors (Boran Plong) is now employed on Scotiabank’s fixed income team. The synchronous increase in pricing for rate cuts and widening of the CORRA spread suggests something similar has happened now.
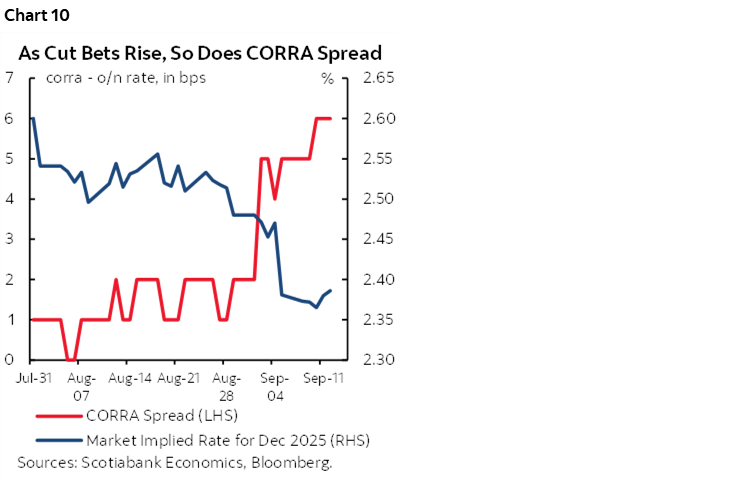
Back then, market speculation toward policy easing was in full force as the policy rate went down by 225bps within ten months. Something similar is happening today (chart 10). Today, however, the effects on funding markets and CORRA may be more limited and temporary if further policy rate adjustments are more limited and more about tweaking. I don’t find there to be the conditions for returning to a 1-handled or emergency rate setting. Therefore, the BoC may be more inclined to look through these distortions as transitory (a word that admittedly still makes many shudder).
Market desks have observed that CORRA and US SOFR are moving somewhat synchronously as an added wrinkle. An integrated N.A. funding market may be importing US pressures into Canada. This requires monitoring into fairly common concerns that repo funding pressures may soon intensify further in the US. This effect could be less transitory than domestic funding market influences.
Having said that, US funding market pressures spilling into Canada may not be the BoC’s fight. It would be more likely that the Federal Reserve would act in response to US funding market pressures and Canada would benefit vicariously without necessarily having to adjust Canadian funding market tools.
If the BoC feels otherwise than to monitor and bide its time, then it has multiple tools it could invoke if it believes that CORRA is more permanently unmoored from the policy rate and needs to bring it in line.
It's possible that the BoC’s estimate of optimal settlement balances of $50–70 billion needs to be revisited if funding market pressures intensify and are longer lived. It may have to reset its target with implications for when to resume purchases of bills and bonds. That point may be arriving sooner than the vague prior guidance for it to occur at some point into 2026 on bonds, and later this year for bills.
Repo operations, receiver general auctions, another cut to the deposit rate that widens its negative spread to the overnight rate to more than -5bps, and moral suasion or jawboning are among other options. My hunch is that they’ll manage funding markets with a combination of repo and jawboning that indicates they are mindful of conditions and prepared to take action if necessary in future.
Yet it’s unlikely that any further such actions would be introduced this week. The BoC’s past playbook has preferred an approach that is more gradually communicated and spelled out. For instance, it’s likely that the BoC would insert a policy speech by Deputy Governor Gravelle who oversees the Financial Markets Department at the bank if it felt a need to make significant changes. Upon witnessing the insertion of such a speech it may have an announcement effect on funding markets; why deliver a speech on balance sheet plans to announce you’re changing nothing.
Further, deeper solutions like cutting the deposit rate spread further below the -5bps to the overnight rate at present could backfire if this is a temporary shock to funding markets. If the funding pressures subside and the deposit rate spread has been widened, then the BoC could face unwanted swings and volatility that could wind up pressuring funding markets below the overnight rate.
For now, my two cents have me leaning toward riding this out, not overreacting, and using temporary tools like overnight and term repo operations to massage the market effects of CORRA overshooting the policy rate. Then re-evaluate as needed but be very careful.
Both Cases for the Policy Rate
Our BoC forecast change was first announced here. Both of the cases for a hold and a 25bps cut will be presented below and multiple points in each section have counterpoints in the other which makes it important to read both scenarios and competing points. We don’t see merit to upsizing and believe the case for a cut outweighs a hold. That conclusion is arrived at in terms of what the BoC is likely to do since the overriding imperative is to (hopefully) make the correct call, but my bias remains that they should hang tight. High uncertainty around projections and inflation risk merit high caution toward overdoing it on the policy rate while retaining the real possibility that relief could be temporary before hikes return.
The Cut Case
The crux of the argument is that prior to recently, speculation toward further BoC rate cuts was on a lark. We’ve received new information on multiple counts that merit a forecast change.
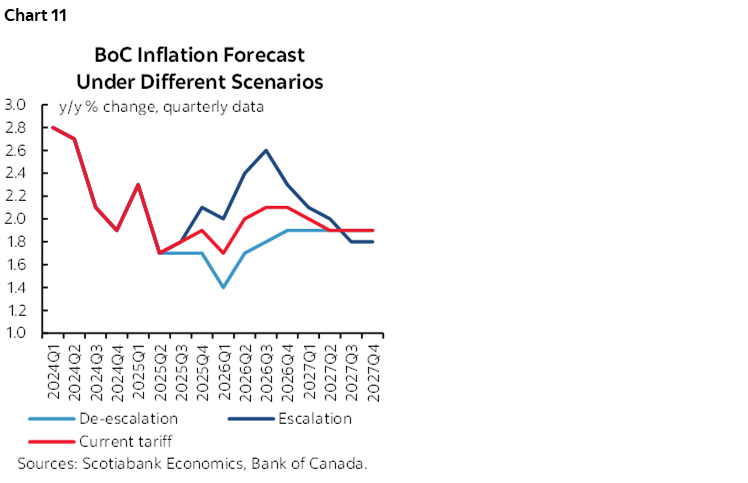
- The BoC previously showed inflation falling back to 2.1% y/y in 2026Q4 and 1.9% in 2027Q4 given that the ‘current tariff scenario’ they provided may be the most likely one at this point (chart 11). They would likely be more concerned about downside than upside risks to this given fresh domestic and US developments explained below. Insurance easing against the risk of undershooting 2% inflation in future may dominate in the nearer term.
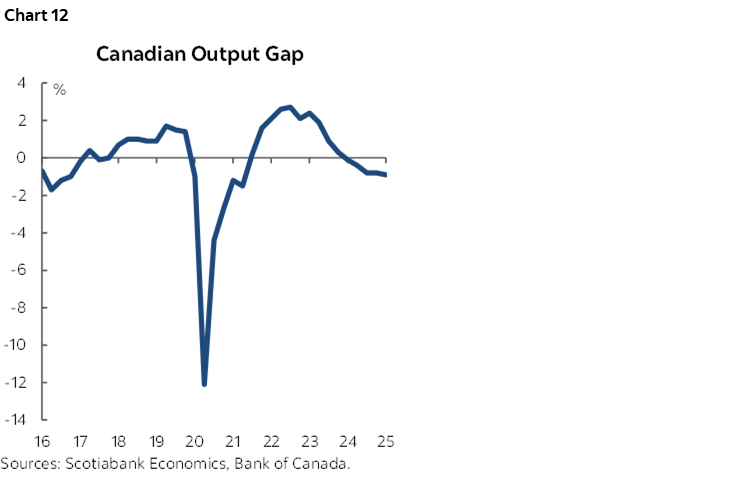
- For some time now there has been a small amount of slack in the economy as measured by output gaps that reflect the balance between demand and supply (chart 12). The July MPR estimated slack at around -½% of potential GDP with some measures suggesting it could be greater. Excess supply conditions could make it more challenging to steer inflation to land on 2% without undershooting over time.
- There may be slightly more slack now. The economy contracted by 1.6% q/q SAAR in Q2 which was weaker than we had anticipated and is tracking very soft growth in Q3 given evidence that is available so far.
- Another indication of modest slack is that the industrial capacity utilization rate fell to 79.3% in Q2 versus a cyclical peak well over 80%. Further downward pressure is likely and which limits industrial pricing power.
- The job market has weakened. Over 100k jobs were lost in July and August and only 38k jobs have been created this year to date. The unemployment rate has risen to 7.1% from a cyclical trough of 4.8% three years ago. Estimates of the equilibrium rate of unemployment are six-handled but marked by high uncertainty while nevertheless indicating some mild degree of labour market slack.
- Developments in the US are material and indicate a weakening external sector that could negative impact Canada. Up to now, our argument had been that the tariff shock to Canada was small in weighted terms after taking into account high USMCA/CUSMA compliance. Therefore, as long as the US economy held it together, Canadian exports could be buoyed as the income pull effect on exports offsets the price effect. That’s less clear now as the US job market stumbles and growth risks mount with the Fed in easing mode. Since the BoC’s July MPR, the US has shifted away from tariffs in fits and starts toward concrete tariff announcements against multiple countries. The relative certainty of those tariff rates is likely to increase concern about harm to the US economy. Canada is highly trade dependent especially on the US and so weakness creeps in through the backdoor.
- Canada’s tariff retaliation is (mostly) gone which lessens risk of import price pass through into Canadian inflation which makes it slightly more feasible for the BoC to ease. Canada doesn’t need to retaliate to the same degree since the US imposed draconian tariff rates on many trade partners and will damage its own outlook accordingly.
- Economic policy uncertainty and US tariffs against some Canadian exports are drags on growth.
- It’s also unclear where the balance may lie in the October federal budget. We’re told it will apply austerity—likely on operating spending—while ramping up investment spending. Where the net lies, when, and by how much is highly uncertain as it has taken too long to present fiscal plans at a point of high uncertainty. That probably means the BoC can’t afford to wait given lags in policy effects.
- Mortgage resets continue to work through the economy. They are pressuring some households who are clamouring for further relief.
- Further, if the BoC were not to cut this week, then absent really clear and dovish forward guidance that they are typically loath to provide, the result could tighten financial market conditions perhaps at an inopportune moment. The BoC is getting a free pass from markets to cut. Markets are not always right—in fact, they’re very often not as we’ve seen in US and Canadian rates throughout this year—but the BoC would require high confidence in its view to ignore information distilled in markets that may reflect all publicly known information.
The Hold Case
While not our call, I can’t dismiss the case for the BoC to hold this week.
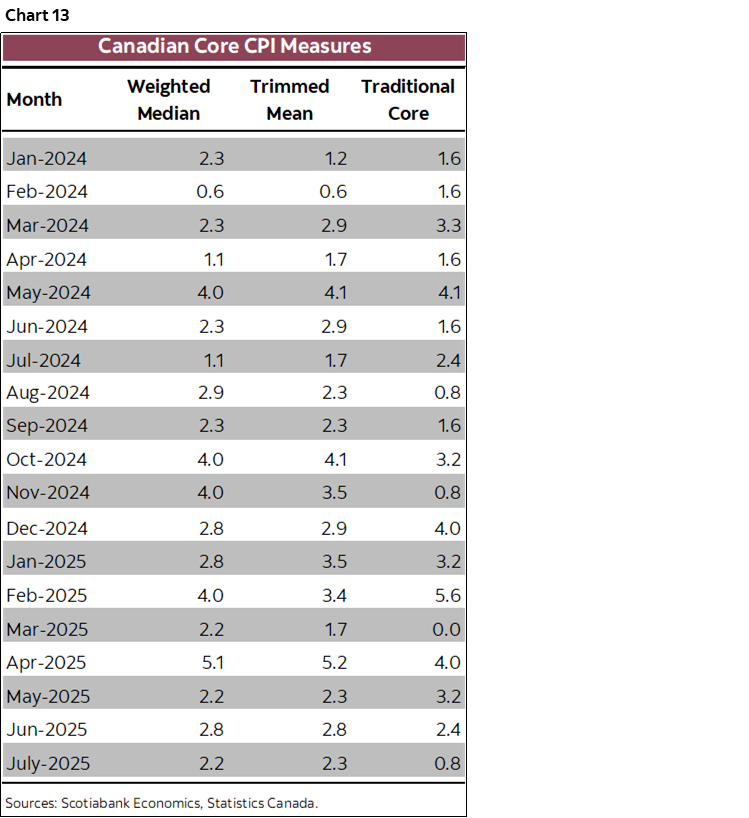
- core inflation remains sticky at elevated trend readings (chart 13). We’ll get another update on Tuesday. The BoC’s prima facie mission is to secure stable inflation around a 2% target. To ease may superimpose high confidence in its concerns about the outlook over being data dependent.
- Output gaps play a limited role in inflation forecasting. Output gaps are difficult to estimate, prone to errors, difficult to project, and there are many other complex drivers of inflation.
- Monetary policy easing can take 12–24 months to have its full effects. We’re only just past the one-year mark for the first cut and six-month point for the last cut. More time may be needed for GDP to respond amid the risk of overdoing it with further easing.
- The reason the BoC was easing up to March of this year was in anticipation of excess supply and a negative output gap. To keep easing when they observe such slack would compound an expectations driven policy move alongside a contemporaneous policy bias and risk doubling up on easing. It cut by 225bps from June 2024 to March 2025 and may judge this has been enough with time needed for excess supply to close off.
- The real policy rate is close to zero. The 2.75% nominal rate is within the bands of most estimates of the neutral rate—the BoC’s range is 2.25%–3.25%—and may be either slightly restrictive or slightly easy.
- financial conditions remain supportive. TSX valuations are up by over 18% year-to-date with a forward p/e ratio of about 18 times. CAD is soft with USDCAD at about 1.385 (about 72 cents US). Canada’s sovereign yield curve has been below the US Treasury yield curve for a long time as the BoC cut earlier and faster and exited QE earlier than most while rapidly shifting to 100% roll off of maturing bonds through quantitative tightening.
- Much of the rise in the unemployment rate has been because of an overshoot of temporary residents as immigration policy tightens. BoC policy can’t really address this. Immigration policy can, should, and may be doing so.
- Wage pressures are acute. The three-month moving average of monthly growth in average hourly earnings of permanent employees—a commonly followed yardstick—has been close to 5% m/m SAAR. That’s well over twice the inflation target and a form of cost-push inflation risk.
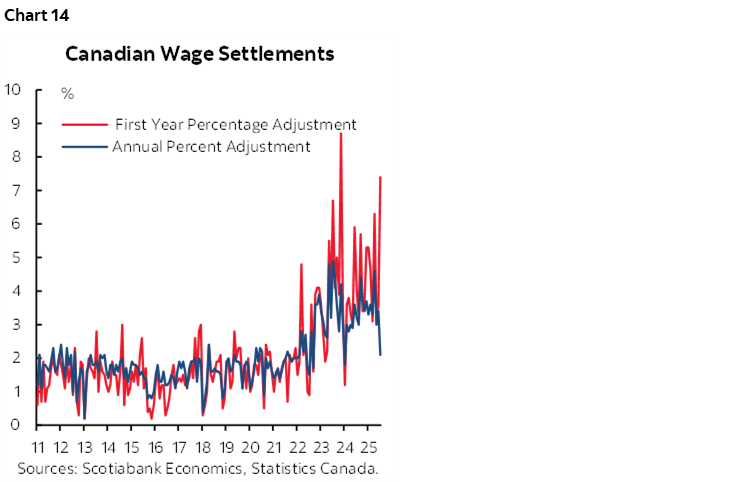
- Despite job market slack, such wage pressures may not subside. They could persist for years. Canada is a very different labour market compared to the US given about one-third of Canadian workers are unionized and subject to collective bargaining agreements versus about 10% in the US. Therefore, wage settlements as agreements from 3–4 years ago expire matter a lot more in Canada than in the US. Canada’s labour market model is between the US and Europe. As wage settlements explode (chart 14) and with over a million more workers facing expiring agreements, this may hardwire momentum in future actual wage data.
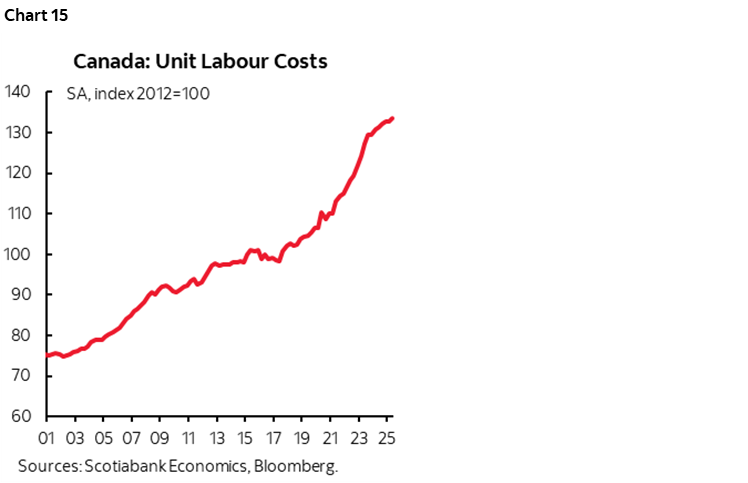
- Now, with the exception of you the dear reader, the average Canadian worker is undeserving of wage gains. Most economists would argue that persistent gains in wage growth above the rate of inflation can only be justified by productivity gains and yet labour productivity—measured as output per hour worked—has fallen outright in 17 of the last 20 quarters. The result has been soaring productivity-adjusted employment costs (chart 15). Canada doesn’t need Trump to damage its economy. Its workers and businesses are harming their own longer-run competitiveness. When wages serially exceed productivity, the result is self-reinforcing to inflation risk by squeezing company profit margins through higher costs and lower revenue growth, inviting a complex set of responses that may include passing on the costs to end consumers and other businesses.
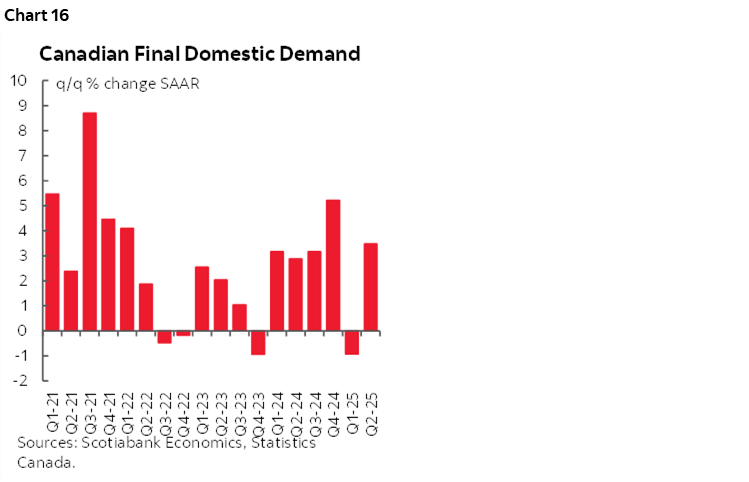
- Final Domestic Demand is a better indication of the strength of the domestic economy (chart 16). It grew by 3.4% q/q SAAR in Q2. GDP contracted by 1.6% in Q2 because of the reversal of inventory and net trade tariff-frontrunning effects in Q1 when GDP grew by 2.0%. The BoC’s policy rate has greater control over internal conditions than external conditions in the economy and therefore they may—as they’ve done at times in the past—choose to point to evidence of a robustly growing domestic economy not in need of further rate assistance.
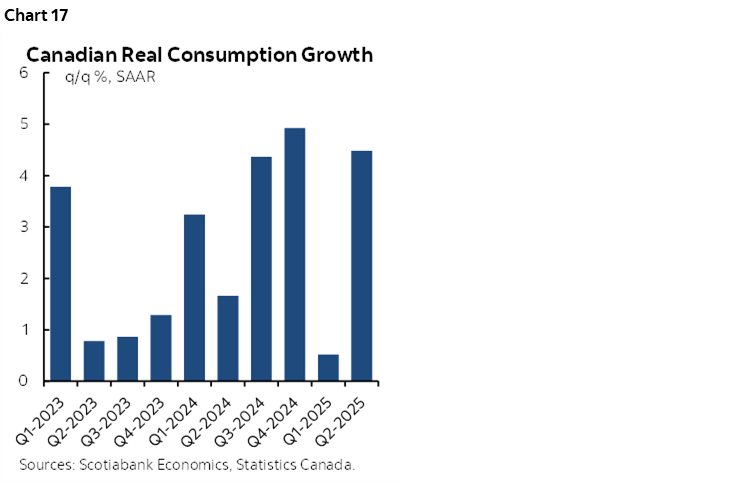
- interest sensitive sectors are responding and prior policy easing should perhaps be given more time to work. Consumption was up by a whopping 4.5% q/q SAAR in Q2 and the trend has been way more resilient than the hyped up fear about mortgage resets (chart 17). Housing contributed a small amount to growth. Home sales have increased for three consecutive months, housing starts have surged over the past four months toward the upper bound of readings in recent years, and retail sales volumes are tracking a modest gain. It could all be temporary, or not, and the BoC may wish to take further time to evaluate the answer.
- The tariff shock against Canada is small. About 90% of Canadian exports to the US are compliant with the CUSMA/USMCA trade deal which lowers the 35% tariff rate and the combined sector-specific tariff rates down to a weighted average of only about 5½%. That is the lowest tariff hit against any of America’s main trading partners.
- Mortgage resets are a micro shock, not a macro shock and the BoC has done more than enough to address the risks. The majority of households in Canada don’t have a mortgage, of those who do it’s only a minority who are the most pressured, and so far there is at best a tiny effect on mortgage delinquency rates that remain very, very low as the term structure of interest rates fell sharply from the prior peak and lending policies adapted alongside behavioural adjustments by debtors.
- CAD has appreciated since early this year but remains undervalued as a shock absorber.
- The long-promised Federal budget may deliver meaningful stimulus. We can’t judge this without seeing it. As of now, it sounds like an austerity focus for short-term spending and long-tailed gradual commitment to investment projects that won’t be of material help to the economy for years to come. We don’t, however, know this for certain and the fact there are likely to be additional forms of shorter-term stimulus is something the BoC should be mindful toward. We don’t want to see monetary and fiscal policies overdoing it all again.
Lastly, see my Canadian CPI section for not only a view on this week’s update for August but also views on longer-tailed risks to inflation versus the tendency of some perennially dovish forecast shops in Canada to dismiss inflation risk in serial fashion.
CANADA CPI—IS CORE STILL SETTLING IN THE TARGET RANGE?
Canada updates CPI for the month of August on Tuesday—the day before the BoC delivers its policy decision.
I’ve estimated total CPI to be up by 0.1% m/m in seasonally unadjusted (NSA) fashion as per the polling convention. That would imply a lift of about 0.3% in seasonally adjusted terms. In turn, this could buoy the year-over-year rate to 2% from 1.7% previously and partly due to a shift in year-ago base effects.
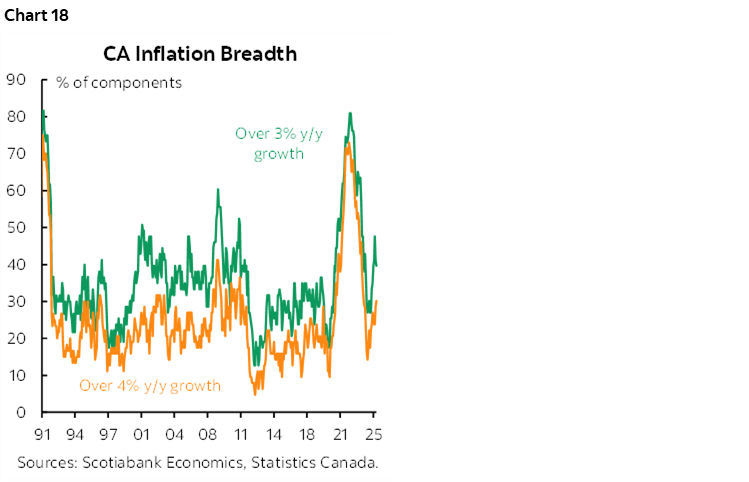
In terms of the NSA reading, August is typically a month in which there is low average seasonality in price swings. Gasoline prices may contribute up to 0.1% to CPI given an estimated 1½% m/m NSA rise. Food is likely to be a minimal influence. Shelter is estimated to be up to a 0.1% addition. There is high uncertainty around much of the rest of the basket. Watch for breadth of price increases that has been trending up (chart 18).
Key, however, is what will happen to the BoC’s core inflation gauges. They were all over the map in July when traditional core (ex-food and energy) was just 0.8% m/m SAAR, while both trimmed mean CPI and weighted median CPI were up by about 2¼% m/m SAAR.
The preferred way of looking at the core gauges is in terms of m/m pressures. That’s because the trimmed mean and weighted median gauges are very slow to move. They are not spot y/y calculations, but rather weighted, compounded m/m estimates that only factor in one new month at a time plus whatever revisions that Statcan chooses to make to the monthly seasonal adjustments. By the time these measures incorporate new information, it may be too late to evaluate inflationary pressures at the margin.
A compromise is to smooth the m/m readings. A three-month moving average of trimmed mean and weighted median arrives at a figure of about 2½% m/m SAAR as at July. We’ll see what happens with August but the sensitivity of the m/m calculations to slight changes combined with the absence of enough price data in advance makes it practically impossible to estimate the readings. Still, I would be more surprised by as weak or weaker readings than the July release than I would be by a resurgence of core inflationary pressures.
Still, since Governor Macklem just gave a speech titled “Flexible inflation targeting in a shock-prone world” (here) it serves as a reminder that he may comforted by the fact that the various readings are within the 1–3% policy target range. A risk is if he rejects this argument that quoting the roughly 3%+ y/y trimmed mean and weighted median measures that are misleading in my opinion.
Some shops are holding off on their rate calls until seeing CPI. We feel we have enough information to merit not waiting as data dependency shifts down the list of considerations relative to the forward-looking considerations explained in the Bank of Canada section of this report.
A large spike in core inflation measures would resurrect concern that the BoC has never cut on the back of such a reading. Whether that perspective influences the decision now or a careful bias remains to be seen but it may be more likely to have the latter effect given my prior arguments.
In any event, the forces driving inflation are much longer term than anything to be settled by a handful of short-term readings. As trade barriers go up, border frictions rise, inventory-to-sales ratios get padded to multi-decade highs and workers demand escalating wages absent productivity, a confluence of factors centered around multi-year supply chain disruptions merits high caution by central bankers so that they don’t repeat their mistakes.
BANK OF ENGLAND—PAUSING AMID UNCERTAINTY
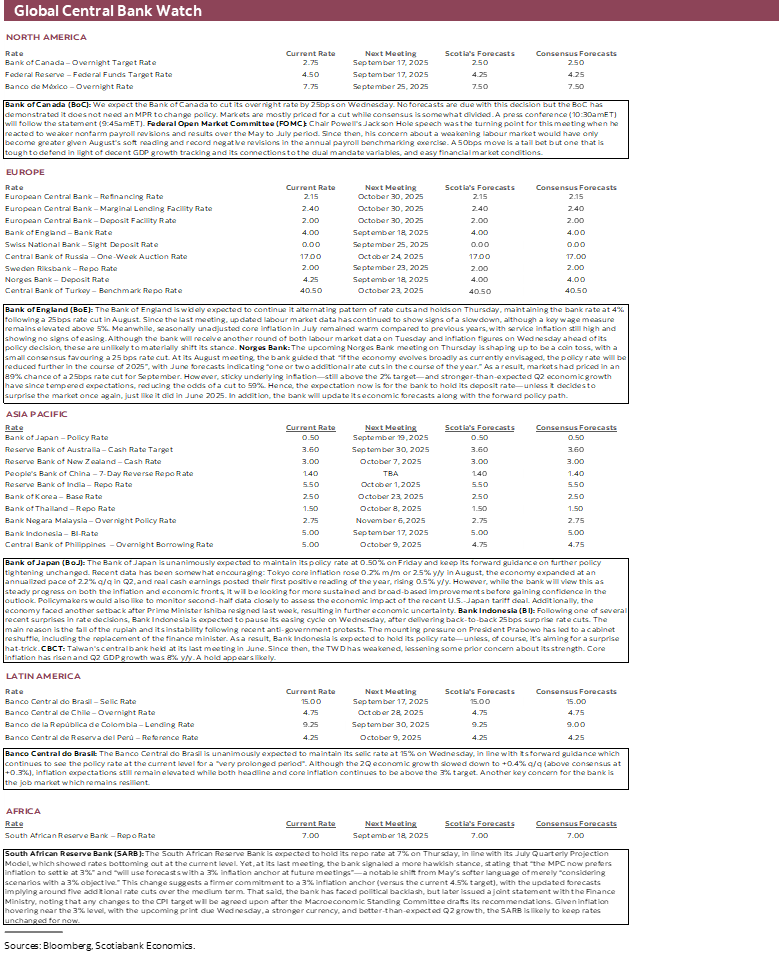
Markets and consensus unanimously expect the Bank of England to leave Bank Rate unchanged at 4% on Thursday. One reason is that the BoE has adopted the gradual mantra that has been executed by an alternating series of cuts and holds since August of last year. The extension of this pattern after cutting in August is a hold now.
It’s unlikely that fresh figures on jobs and inflation this week will influence this pattern (see data section later). Still, inflation remains too warm with ongoing heat across services. Governor Bailey expressed frustration toward the mixed set of activity and inflation readings after 125bps of cuts to date when he emphasized what is “now considerably more doubt about exactly when and how quickly we can make those further steps.” Markets have no further easing priced for this year’s remaining three meetings.
Other MPC members have expressed similar caution. Megan Greene noted signs that the “disinflationary process is slowing down.” Catherine Mann noted that “a more persistent hold on Bank Rate is appropriate right now.” Alan Taylor noted “we are in a fragile moment.” Deputy Governor Lombardelli said that neutral may be at the upper end of the 2–4% range estimated by the BoE and with Bank Rate already at 4%.
NORGES BANK—ABOUT THAT GUIDANCE…
Norges Bank may cut by 25bps on Thursday. Consensus mostly leans that way, but markets are somewhat on the fence between a hold and a cut. Why?
At its August meeting, the bank guided that “if the economy evolves broadly as currently envisaged, the policy rate will be reduced further in the course of 2025”, with June forecasts indicating “one or two additional rate cuts in the course of the year.” Chart 19.
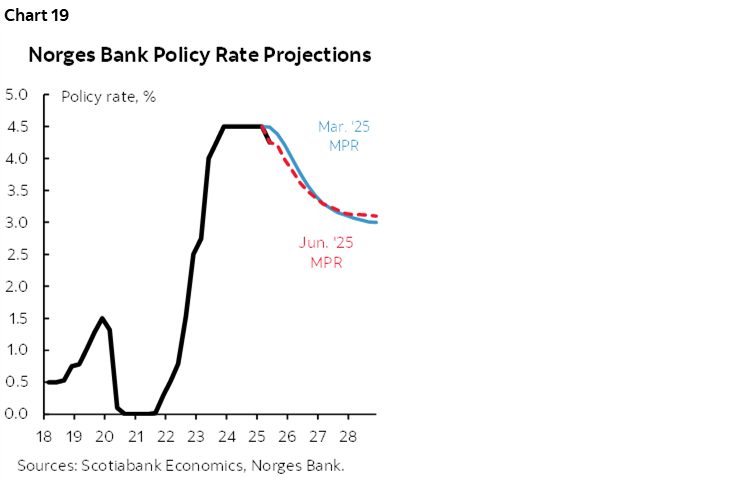
With three meetings left this year, Norges may opt to retain some optionality on its prior guidance and whiff this time.
Further, since this guidance was offered, CPI inflation was sticky with August’s readings for total and underlying CPI inflation both above 3% y/y. GDP growth strongly exceeded expectations for Q2 (0.6% q/q SA nonannualized, 0.3% consensus, upward revisions).
BANK OF JAPAN—PAUSE FOR REFLECTION
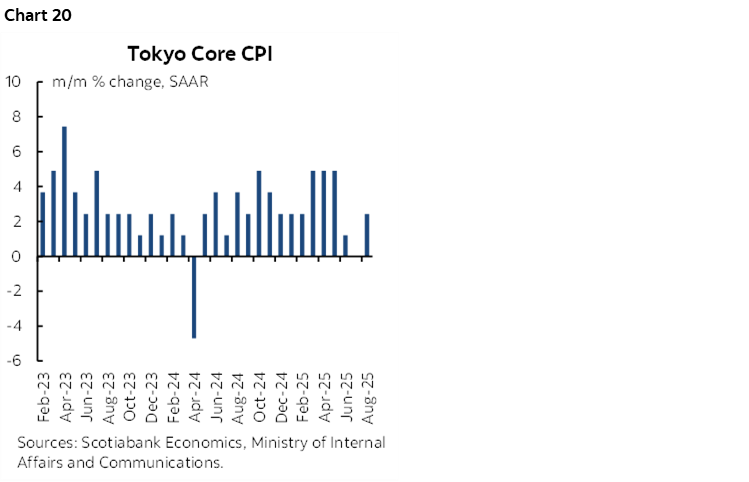
Consensus and markets unanimously expect the Bank of Japan to leave its target rate unchanged at 0.5% on Friday. Markets begin to more significantly lean toward pricing a hike by the December meeting or later. Hints in favour of an ongoing tightening bias are also likely.
One uncertainty is underlying progress on core inflation. The Tokyo core CPI gauge was quite strong in earlier months before pressures subsided in June, July and August (chart 20). Yen appreciation since January stumbled over the period since Spring and further time may be taken to evaluate import price pressures, tariff effects, and oil prices as key drivers of inflation. The BoJ may also wish to have clearer indications about the next Shunto spring wage negotiations and give some distance from Prime Minister Ishiba’s resignation to evaluate future potential policy measures from government before its next full forecast update on October 30th after the last one in July.
BCB—OK, WE LISTENED!
Banco Central do Brasil is widely expected to remain on hold at a Selic rate of 15% on Wednesday.
The reason is simple. Its prior guidance stated a desire to remain on hold for a "very prolonged period" following 450bps of hikes since September of last year. Progress is being made on inflation but more is needed (chart 21).
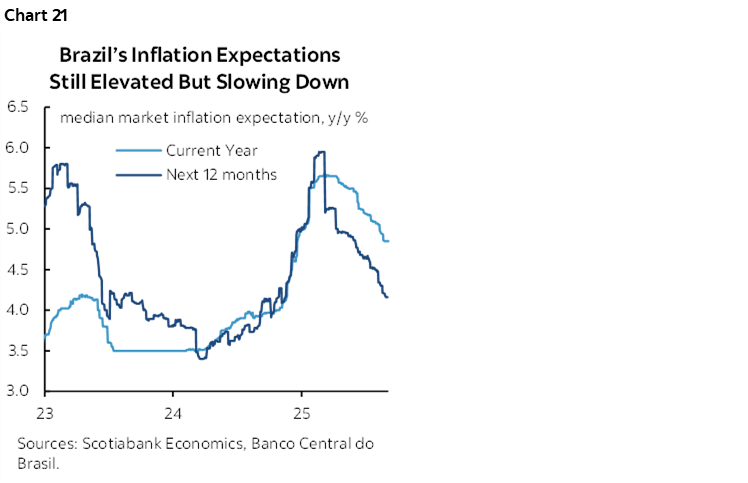
That’s not the same as saying nothing interesting is happening to the outlook. Political risk and tariff risk remain acute not least of which after former President Bolsonaro was found guilty of an attempted coup and sentence to 27 years in prison. That invited threats from the Trump administration to retaliate in defence of Trump’s kindred spirit.
CBCT—IN NO RUSH
The Central Bank of China Taiwan is widely expected to be on hold on Thursday at a benchmark rate of 2%. It has been on hold since March of 2024. Since its last decision in June, the TWD has weakened, lessening some prior concern about its strength, but CBCT may wish to give more time to evaluate tariff effects and dollar stability since the TWD is still about 9% weaker to the dollar since April. Further, core inflation has risen and Q2 GDP growth was 8% y/y.
BANK INDONESIA—NERVOUS HOLD
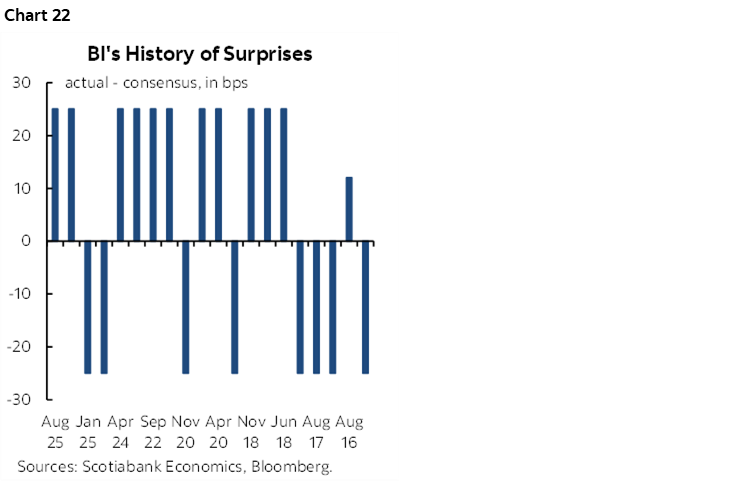
Everyone in consensus expects Bank Indonesia to hold its policy rate at 5% on Wednesday. Uh oh.
This is one central bank with a proclivity toward surprises (chart 22). Bank Indonesia is expected to pause its easing cycle on Wednesday, after delivering back-to-back 25bps surprise rate cuts. The currency has been slightly weakening of late partly due to anti-government protests that sparked market turmoil. The catalyst was the firing of Indonesia’s finance minister in the wake of social unrest caused by long simmering inequality concerns and policy missteps including tone deaf housing allowances given to lawmakers. Cut to inject some confidence, or hold to stabilize the currency?
SARB—WHAT’S YOUR TARGET?
The South African Reserve Bank issues a policy decision on Thursday with consensus somewhat divided. A majority of forecasters expect the repo rate to hold at 7% but a sizeable minority expects a 25bps cut.
SARB’s July Quarterly Projection Model showed rates bottoming out at the current level after it cut by 25bps. It then muddied the waters with confusing guidance on its inflation target that may be further clarified at this meeting. Still, after Q2 GDP growth exceeded expectations, it may take a sharp surprise in Wednesday’s CPI update for August to motivate a cut.
GLOBAL MACRO
As for the rest, the main highlights will offer a suite of readings from the UK, US, Australia, Canada, NZ and several LatAm markets.
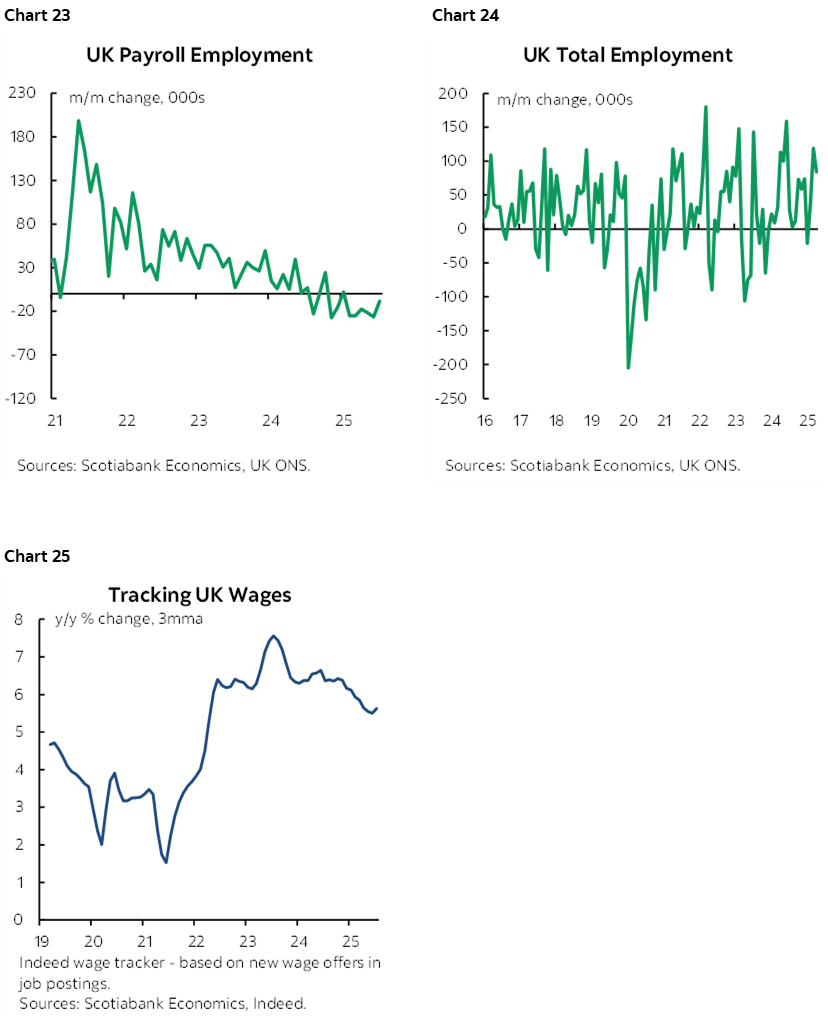
UK job market conditions (Tuesday) and CPI (Wednesday) will both be updated before the Bank of England’s policy decision. They are unlikely to affect the call described earlier. Still, the labour market has been shedding mixed signals. Payroll employment has been falling (chart 23) while total employment that has an extra one-month lag has been more resilient and weighted more toward smaller employers (chart 24). Trend wage growth has remained somewhat above the BoE’s 2% inflation target and productivity (chart 25).
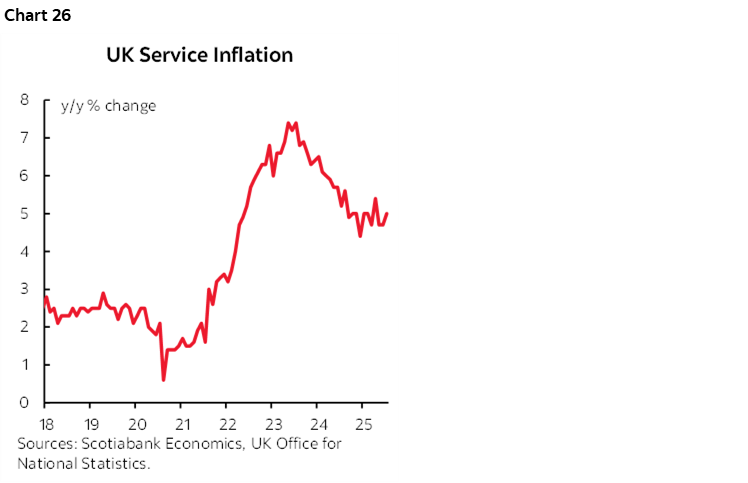
As for UK CPI, it’s unlikely that we’ll see sudden material relief to stubborn service inflation (chart 26). Most forecasters expect the year-over-year total CPI rate to hold in around 3¾%.
The main data focus in the US will be on Tuesday’s retail sales figures just before the Fed the next day. Auto sales will be a downward influence, requiring a solid gain in sales ex-autos to keep the headline in the black when the prior month’s 0.5% gain was a tough act to follow.
Other Canadian releases will include expected strong gains in manufacturing shipments and wholesale sales in July (both Monday). Existing home sales will try to make it four monthly gains in a row (also Monday). Housing starts may be pushing their luck given four straight months at the 280–290k monthly annualized pace but we’ll see if they can continue to deviate from building permit volumes when August’s figures are released on Tuesday. Finally, retail sales may end the week on a sour note with nominal sales expected to drop by about 1% m/m SA based on advance Statcan guidance and weak auto sales figures since then.
LatAm markets face a light line-up with just Brazil’s central bank decision and light data. Monthly economic activity indices serve as GDP proxies and will be updated by Peru and Brazil (Monday) and Colombia (Wednesday).
Australia’s job market situation is also due for a refresh on Wednesday. This one could be the trend setter or breaker. After no job growth over May and June, July created 25k jobs with full-time up 61k. The RBA will keenly follow whether July was the aberration or whether that was the prior two months.
The RBNZ’s next policy decision is not until October 8th, but Q2 GDP growth on Wednesday may reinforce expectations for a cut. The economy is expected to post a mild contraction of around –¼% q/q SA nonannualized.
DISCLAIMER
This report has been prepared by Scotiabank Economics as a resource for the clients of Scotiabank. Opinions, estimates and projections contained herein are our own as of the date hereof and are subject to change without notice. The information and opinions contained herein have been compiled or arrived at from sources believed reliable but no representation or warranty, express or implied, is made as to their accuracy or completeness. Neither Scotiabank nor any of its officers, directors, partners, employees or affiliates accepts any liability whatsoever for any direct or consequential loss arising from any use of this report or its contents.
These reports are provided to you for informational purposes only. This report is not, and is not constructed as, an offer to sell or solicitation of any offer to buy any financial instrument, nor shall this report be construed as an opinion as to whether you should enter into any swap or trading strategy involving a swap or any other transaction. The information contained in this report is not intended to be, and does not constitute, a recommendation of a swap or trading strategy involving a swap within the meaning of U.S. Commodity Futures Trading Commission Regulation 23.434 and Appendix A thereto. This material is not intended to be individually tailored to your needs or characteristics and should not be viewed as a “call to action” or suggestion that you enter into a swap or trading strategy involving a swap or any other transaction. Scotiabank may engage in transactions in a manner inconsistent with the views discussed this report and may have positions, or be in the process of acquiring or disposing of positions, referred to in this report.
Scotiabank, its affiliates and any of their respective officers, directors and employees may from time to time take positions in currencies, act as managers, co-managers or underwriters of a public offering or act as principals or agents, deal in, own or act as market makers or advisors, brokers or commercial and/or investment bankers in relation to securities or related derivatives. As a result of these actions, Scotiabank may receive remuneration. All Scotiabank products and services are subject to the terms of applicable agreements and local regulations. Officers, directors and employees of Scotiabank and its affiliates may serve as directors of corporations.
Any securities discussed in this report may not be suitable for all investors. Scotiabank recommends that investors independently evaluate any issuer and security discussed in this report, and consult with any advisors they deem necessary prior to making any investment.
This report and all information, opinions and conclusions contained in it are protected by copyright. This information may not be reproduced without the prior express written consent of Scotiabank.
™ Trademark of The Bank of Nova Scotia. Used under license, where applicable.
Scotiabank, together with “Global Banking and Markets”, is a marketing name for the global corporate and investment banking and capital markets businesses of The Bank of Nova Scotia and certain of its affiliates in the countries where they operate, including; Scotiabank Europe plc; Scotiabank (Ireland) Designated Activity Company; Scotiabank Inverlat S.A., Institución de Banca Múltiple, Grupo Financiero Scotiabank Inverlat, Scotia Inverlat Casa de Bolsa, S.A. de C.V., Grupo Financiero Scotiabank Inverlat, Scotia Inverlat Derivados S.A. de C.V. – all members of the Scotiabank group and authorized users of the Scotiabank mark. The Bank of Nova Scotia is incorporated in Canada with limited liability and is authorised and regulated by the Office of the Superintendent of Financial Institutions Canada. The Bank of Nova Scotia is authorized by the UK Prudential Regulation Authority and is subject to regulation by the UK Financial Conduct Authority and limited regulation by the UK Prudential Regulation Authority. Details about the extent of The Bank of Nova Scotia's regulation by the UK Prudential Regulation Authority are available from us on request. Scotiabank Europe plc is authorized by the UK Prudential Regulation Authority and regulated by the UK Financial Conduct Authority and the UK Prudential Regulation Authority.
Scotiabank Inverlat, S.A., Scotia Inverlat Casa de Bolsa, S.A. de C.V, Grupo Financiero Scotiabank Inverlat, and Scotia Inverlat Derivados, S.A. de C.V., are each authorized and regulated by the Mexican financial authorities.
Not all products and services are offered in all jurisdictions. Services described are available in jurisdictions where permitted by law.