Next Week's Risk Dashboard
- Canadian Budget — Making the Correct Choices?
- Canada to roll out immigration, stablecoin plans
- US Supreme Court commences its IEEPA tariff review
- New York’s mayoral election — Dems pivoting the wrong way?
- Canadian jobs preview
- US nonfarm preview — The government is shut, but we aren’t
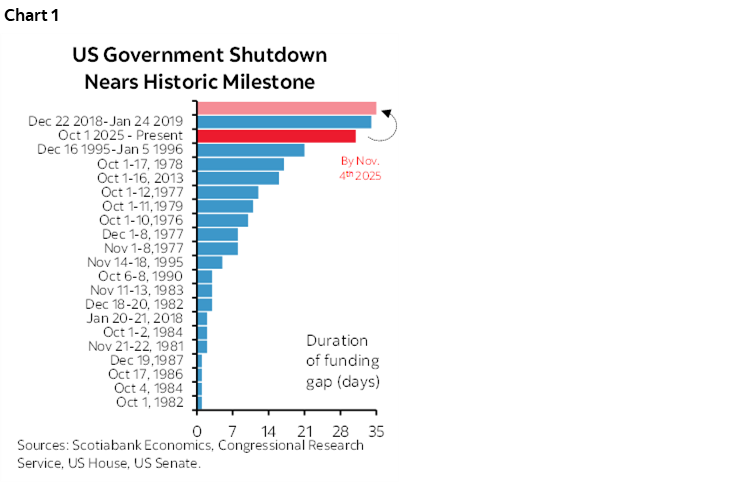
- US government shutdown to set a new all-time record
- BoC’s Macklem to reinforce latest pre-budget messages
- RBA can’t cut with inflation like this
- BoE on hold amid stubborn inflation
- Banxico to cut in support of growth
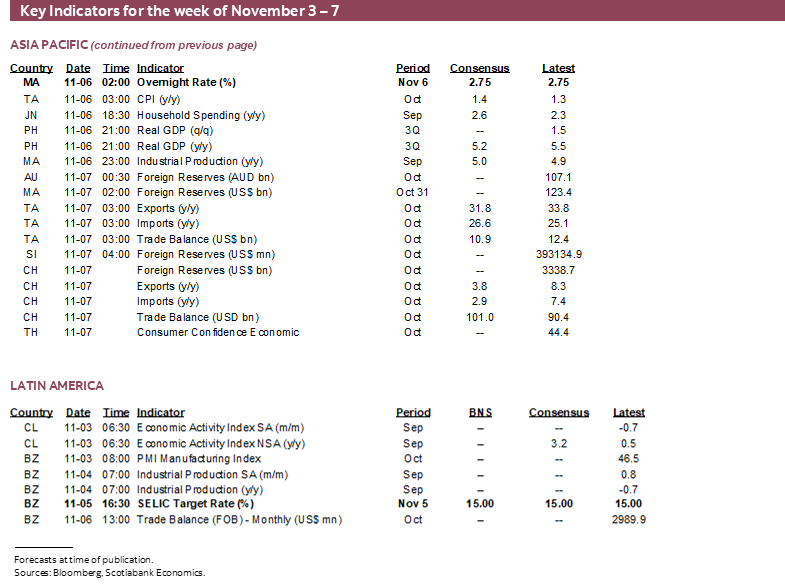
- Bank Negara — Growth needs no help
- Riksbank — You’re no fun!
- Norges — You neither!
- BCB not making enough inflation progress
- RBNZ to reassess financial stability right after jobs
- Global indicators: Asia-Pacific & LatAm CPI, NZ jobs, limited US data
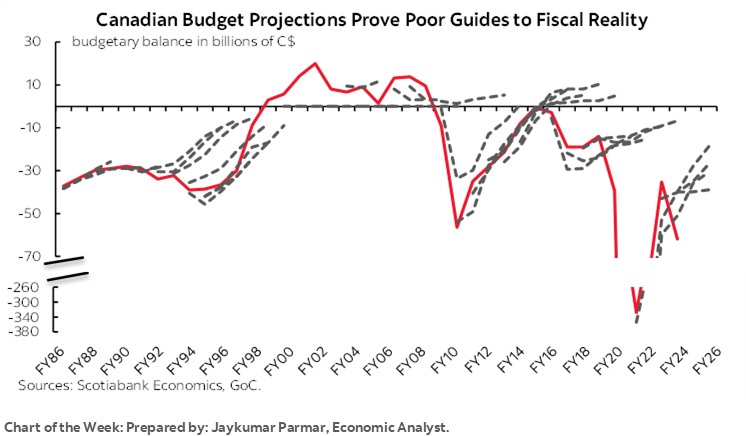
Chart of the Week
A parallel challenge is that the US Supreme Court commences its review of the IEEPA tariffs on Wednesday. There are other options for applying tariffs, but eventually striking down use of the IEEPA would be a major blow to the Trump administration and, by corollary, raise the risk of overdoing it on fiscal stimulus in Canada.
Seven central banks will also weigh in this week plus we’ll hear from BoC Governor Macklem again and the RBNZ rolls out its latest financial stability assessment.
Previews of Canadian jobs and—even though we won’t get it—US nonfarm payrolls are also provided. By Tuesday, the US government shutdown will be the longest on record (chart 1) as President Trump returns from Asia to try and hash our agreement that then trigger a lagging wave of backed up macro reports over future weeks.
CANADIAN FEDERAL BUDGET—MAKING THE CORRECT CHOICES?
This is what the cottage industry of fiscal policy wonks lives for especially in a country with a bigger role played by government than elsewhere by various metrics. It’s show time on Tuesday when Minister of Finance Champagne stands in Parliament to begin delivering his Budget speech after markets shut. That’s when the embargo on the highly controlled release will lift and the contents immediately spill onto financial market screens.
I’d encourage readers to review Rebekah Young’s budget preview here. She’ll also be in the embargoed lock-up on Budget day that I don’t miss doing in past years, and she will release a note with the details sometime into the evening.
I’ll also offer my own perspectives largely at a more macro and more normative level. Key will be independent appraisals of the chosen path, the relative attractiveness of other options, and the risks. The fun only just begins when the embargo lifts and media outlets immediately spill all of the contents in real time which makes today’s budget coverage vastly different from many years ago.
Deficits and Fairy Tales
For starters, take whatever numbers are put down on paper as mere suggestions. That’s true even in more normal times. Forecasts for the budget balance have a terrible track record even—or perhaps especially—when they come from Ottawa.
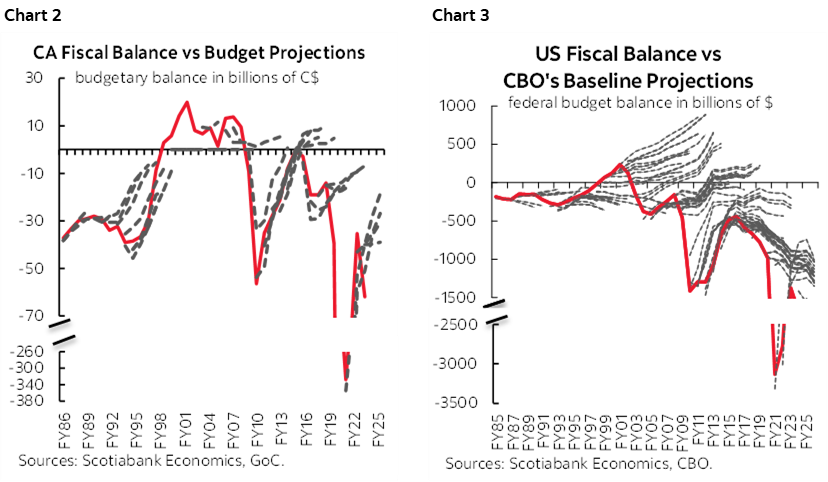
Chart 2 shows the pattern. Even outside of periods characterized by massive sudden shocks—like the pandemic—the projections tend to miss inflection points and frequently err on the overly optimistic side. Maybe the latter point is because of excess reliance on macroeconometric models that are biased toward achieving general equilibrium in the economy over the medium-term absent additional shocks. Maybe it’s because plans change along the way. Or maybe it’s just because of politicized bias behind years of false promises to return to balance. Oh, and by the way, it’s not unique to Canada (chart 3).
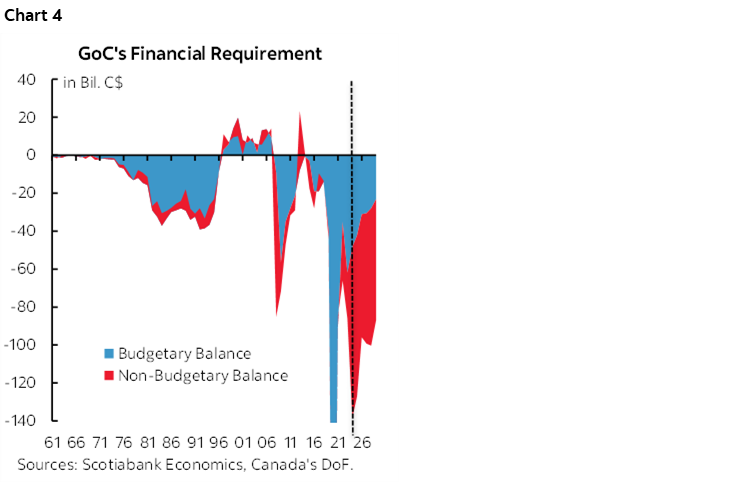
Off-Budget Items and Financing Will Balloon
A fair portion of what Ottawa announces will not be crystallized in deficit numbers. That’s because many of the investments are expected to use loans, guarantees, and equity positions etc. These non-budgetary transactions will drive a deepening negative balance—and hence even greater funding requirements to at least the highest since the pandemic. Chart 4 uses last December’s FES 2024 numbers as one indication of how large they’ve been and the non-budgetary balance portion is likely to rise sharply higher this time around.
A Dicey Budgeting Path
That typical historical pattern may be more inflamed today. A prime focus of Ottawa’s grand master plan for the economy is to place heavy emphasis upon spending on infrastructure and defence. This has merit. Investing in large scale projects in Canada has too often been a bad joke for too long. Building large scale projects is a cumbersome, unwieldy process in Canada that entails slow approvals that Carney is smartly seeking to compress to two years if he’s successful, while navigating through the Courts and various interest groups.
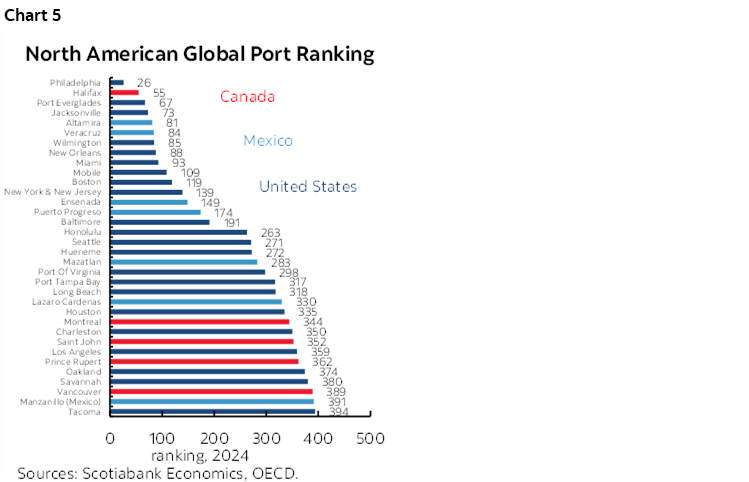
The Carney administration’s efforts to free up the process and facilitate some types of projects has some appeal. There can be significant multiplier effects to wise investments in these areas and positive externalities across the rest of the economy. More reliable power generation benefits everyone and facilitates growth. Unleashing the country’s natural resource potential has enormous appeal; it’s better for a democracy like Canada to supply the world than for the world to rely on undemocratic despots in other parts of the world and Canada has left too much potential in the ground. Better highways benefit trade and commerce across many industries. Better ports benefit exporters and quite frankly Canada’s ports rank poorly (here, chart 5) and tend to be much slower at adopting new technologies than the world’s leading ports. That’s a terrible handicap for an exporting nation and labour attitudes are often to blame; good luck fixing that.
It can’t, however, be the only focus and there are very high risks around such plans. We need details that have been sorely absent to date, but that will further inform targeted projects beyond limited initial lists, and information on who owns, who finances, who regulates, who administers and the guesswork around costs and timelines.
The concern centres around how states have a poor track record at picking winners and losers while overtly or passively directing capital to what elected officials and bureaucrats think are the priorities. Canada’s not the Soviet Union of yesteryear, but it has its own checkered history when it comes to big projects. Here’s a recent example that is all-too-familiar to Torontonians as it enters its 14th year with a current cost estimate of about C$13 billion compared to the starting estimate of $5 billion.
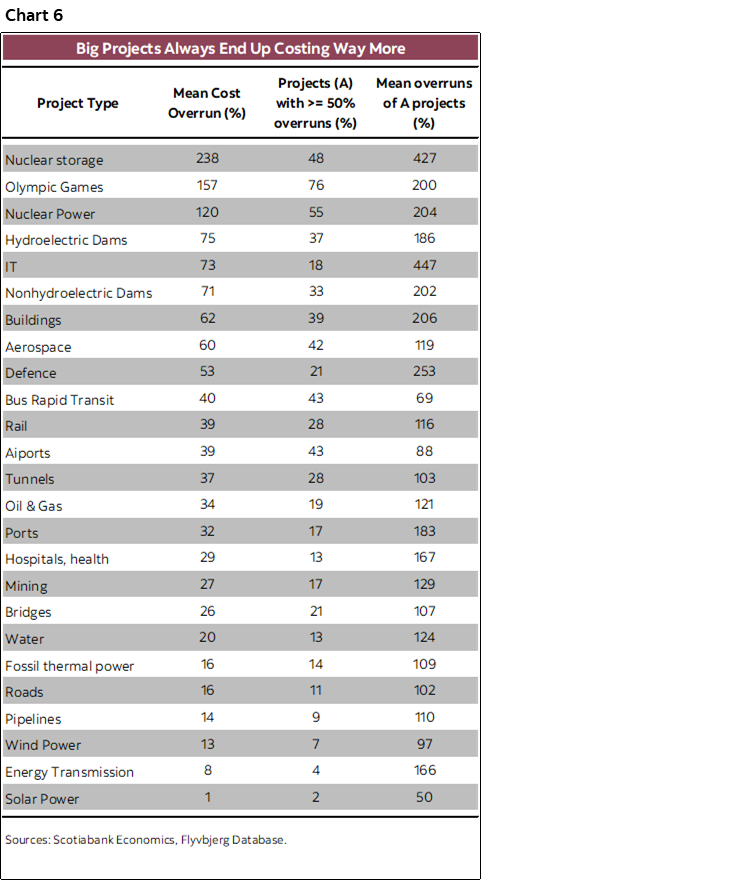
It can also be a very expensive route that magnifies budgeting uncertainty. Chart 6 draws on a global data base that shows that such projects are characterized by massive cost overruns. The initial cost estimates are mere placeholders and the final tally can be 2, 3, 4 or more times higher. It’s like when you get a quote for a kitchen reno from a grinning tradesperson that winds up over budget and taking much longer to do, only multiplied by countless billions over time. It’s a different world than when the railways were built or the St. Lawrence Seaway in oh so many ways.
Layer on to that evidence the fact that Canada is particularly bad at running procurement programs—as frequently emphasized by the Auditor General—and at managing large scale project costs and timelines. Ask any company with experience dealing with governments and special interest groups on the latter. Maybe the new Defence Investment Agency will improve procurement insofar as defence spending is concerned, or maybe it’s just another layer of bureaucracy with the deck stacked against it.
Then layer on the underlying macroeconomic uncertainty independent of policy plans. The PBO’s budget sensitivities are provided here. Most estimates suggest that every one percentage point disappointment or positive surprise on real GDP adds/subtracts about $5–6 billion per year from the deficit. We have mild growth in our numbers, but if we’re wrong, then a recession or much stronger than expected growth could easily add or subtract a multiple of that sensitivity. A price level surprise up/down would lower/add about $3 billion to the deficit, though the effects are not purely additive. A rate shock of one full percentage point higher/lower would add/subtract about $2–3B per year from the deficit.
When looking at the deficit estimates it’s not the current year figure that matters. It’s the path. The normally very high uncertainty around forecasting that path is especially high today because of the points I’ve made above. My bias is to err on the side of much bigger for much longer deficits than what may be shown on Tuesday; it would counter Ottawa’s serial optimism on the balance and adjust for today’s realities and plans. That bias extends to believing that over time, Federal government will not succeed in stabilizing its net debt ratio that is likely to remain on an upward path.
Tough Choices. Now Answer Them.
None of the choices will be made in a bubble. They will involve trade-offs and both PM Carney and FinMin Champagne have been very transparent in saying so.
We just don’t know how they will make trade-offs. For instance, I’ve long emphasized that targeting defence and loosely related security and infrastructure spending at 5% of NGDP by 2035 leaves a lot of blanks unfilled. We don’t know the path or even the commitment beyond merely promising to make such spending while appeasing Trump at least during his term in office and then who knows.
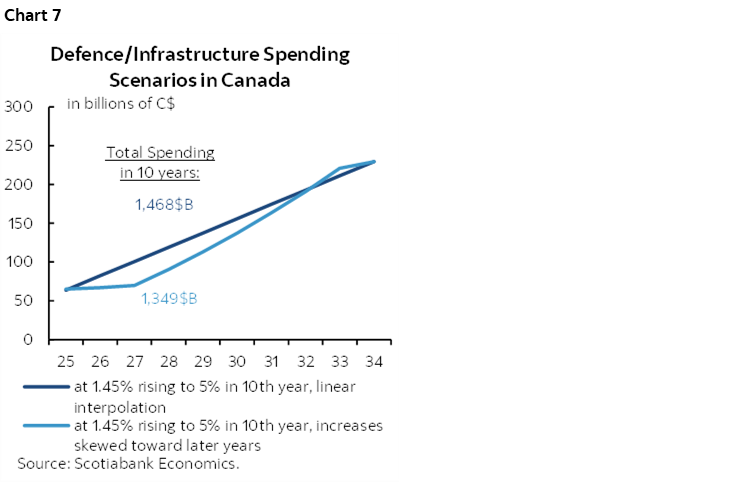
But if we grow NGDP at a longer-run average pace of around 4% (2% real GDP, 2% inflation) and assume the path toward spending 5% of NGDP by 2035 will be filled in by linear interpolation, then chart 7 shows the results. It would entail spending nearly an extra cumulative C$1.4 trillion over the next decade. The chart also shows a delayed path that is more back-end loaded but arrives only a slightly lower cumulative estimate.
You either need to slash program spending by this amount to make way for the added spending, or hike taxes, or float much bigger deficits for a lengthy period of time.
And while I’ve long argued that public sector bloat needs to be reined in by tens of thousands of jobs, doing so would be a drop in the bucket in terms of overall finances. Granted, they are part of 7½% per annum operating budget cuts planned for the first fiscal year rising to 15% within two years thereafter assuming they stick to guidance, but such amounts could easily be swamped by the grander plan.
About Those Tax Cuts
The Carney administration frequently touts the fact it cut taxes early in its mandate following the April election. That’s true. But meaningful tax relief that is consistent with a productivity agenda that encourages more investment and more savings and better performing financial markets has not been offered. In fact, far from it.
We’ll be watching for any further policy proposals on taxes including anything on stronger inducements to invest. The likely need for the Liberals to curry favour with the NDP for its support in passing the budget likely lowers further any hope of material tax reforms especially given the large scale downsizing of the unionized federal civil service.
What the government has done is to lower the marginal personal tax rate by one percentage point to 14% effective July 1st on the first C$57,375 of income. They called it the middle-class tax cut, although that depends on how you define middle class especially in expensive cities like Toronto or Vancouver to name two. The impact is small; the government estimates maximum tax savings of $420 per person and $840 per couple per year for the full year of 2026.
Cutting taxes for the lowest income bracket helps low earners with a high marginal propensity to spend which supports lower end consumption. There is some merit in doing so given the challenges facing finances particularly across lower income households and because consumption may be the main game in town as the export drivers of growth are likely to be weak.
But this kind of tax cut does not address competitiveness challenges and if anything keeps discouraging saving and investment. The share of Canada’s economy represented by short-term spending by households and governments is sky high; in fact, at about 87% right now, it’s at the highest since 1979 (chart 8). The country never wants to take a step back from this model of pouncing on soft patches for consumption in favour of a program designed to raise living standards over time. Ergo declining living standards.

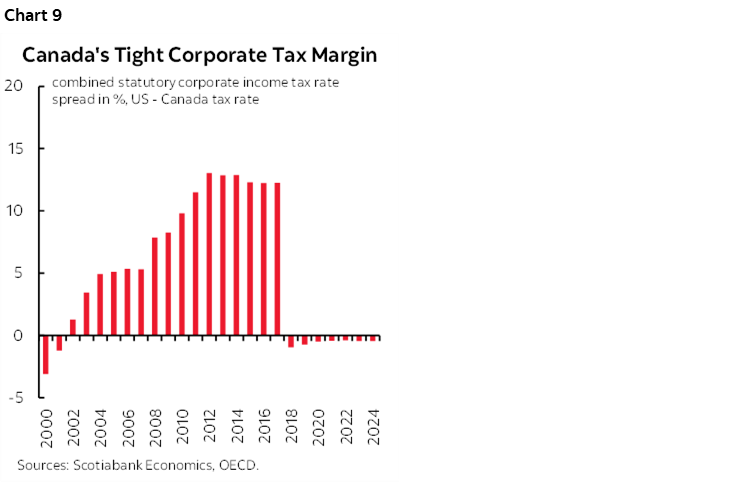
As evidence, Canada lost its corporate tax advantage years ago (chart 9). Corporations are never the ones to pay this tax; you and I do. Corporations are paper shells. The taxes they pay get passed on through incidence effects to some combination of customers, shareholders, workers, and suppliers. Uncompetitive corporate tax policy hinders the appetite for investment in Canada. When global trade wars are driving massive upheaval within supply chains and the concomitant upward pressure on costs, one effective way to help them adjust and invest in Canada given today’s unique shocks could be corporate tax relief.
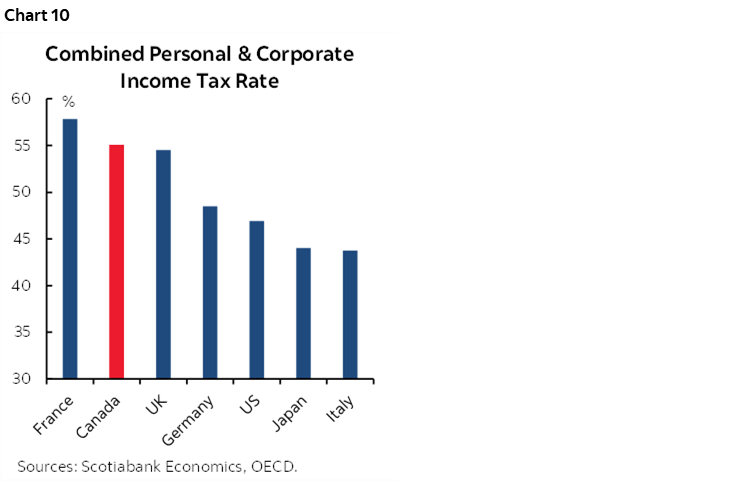
Further, Canada has the second highest combined personal and corporate tax rate on investment income in the G7 behind only France that nobody should want to emulate (chart 10).
What’s missing is therefore a tax agenda designed to foster innovation, relief for supply chain cost pressures, and international competitiveness in attracting both direct (plant and equipment) and indirect (portfolio flows) investment. Anything that heaps additional costs—like competing for scarce labour—may only compound those challenges.
Respect the Bond Market
You’ve heard the usual lines about Canada that lean against having concerns about how bond markets may behave in response to sorely needed fiscal plans and details.
For one, Canada is AAA rated in a world in which that’s a rarity; within a reasonably defined peer group, only Germany, Australia, New Zealand and Norway enjoy S&P’s highest rating and the US is a notch below.
For another, Canada has lower borrowing costs across the curve than the US and especially the UK but also some others like France and Italy. A flaw here is that one reason for this is a much weaker economy than, say, the US.
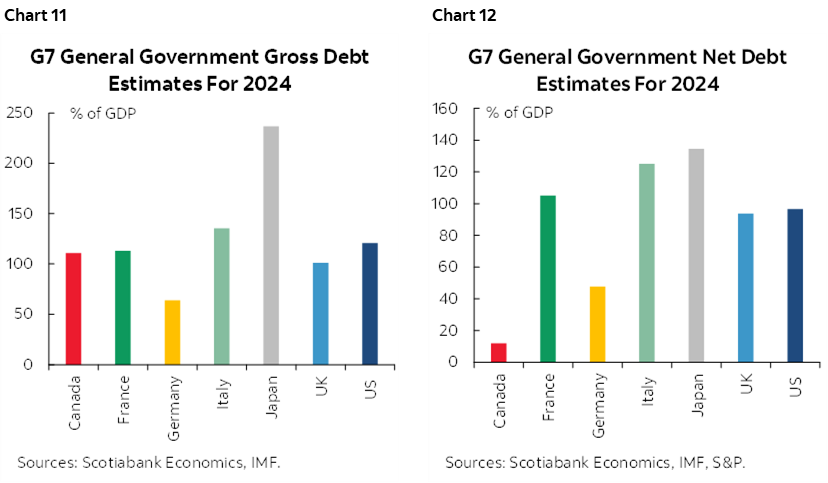
Then there are the debt comparisons in charts 11 and 12. Canada is no lightweight on gross debt to GDP but has very low net debt to GDP. Be careful with the latter, as its implications can cut both ways. It’s a plus to have a lot of financial assets because it can signify funded liabilities and rainy day funds. And yet the financial assets held in government pensions, or sinking funds, or a provincial sovereign wealth fund are not immediately available in times of crisis.
The current context is what matters. We’re in an environment in which everyone is doing it—abandoning fiscal prudence that is. The Europeans are massively ramping up defence spending. The US fiscal path is simply unsustainable over time. All (almost) NATO members are targeting 5% of NGDP on defence. Markets are onto this and hence why we’re in a period of rolling sovereign debt shocks. Ask the short-lived UK PM Liz Truss. Or UK PM Starmer and his Chancellor of the Exchequer Rachel Reeves on the path to the Autumn Budget on November 26th which has them walking a fine line between raising taxes or drawing the ire of the gilts market. Or French President Macron where political paralysis is tying his administration’s hands in terms of addressing fiscal reforms and hence why France pays a handsome premium over Germany to borrow in international markets.
Everyone is floating more debt. The global savings-investment imbalance is being tilted toward heavy government debt issuance. To a point, that’s fine, although more government competition for private savings could be delivered only at a higher cost through higher bond yields. Beyond that point lies the unknown balance where global government debt issuance goes too far and draws a coordinated round of bond market sell offs.
It would be naïve if not arrogant for a country like Canada to be dismissive toward the global forces in this regard. Canada could find it harder to attract funding as various forces further compress the negative spread in its borrowing costs relative to the US. Expectations for Fed and BoC easing have rippled through the whole term structure of rates in both countries, lowering their term yields. The Fed’s anticipated ending of Quantitative Tightening has helped. Expectations for softening growth also playing a factor given historical correlations between 10s and NGDP expectations. Lower yields are also a bit of a restoration of the traditional safe havens as gold has shed about US$500/oz from its peak and taken a step toward restoring historical connections with real bond yields that had broken down.
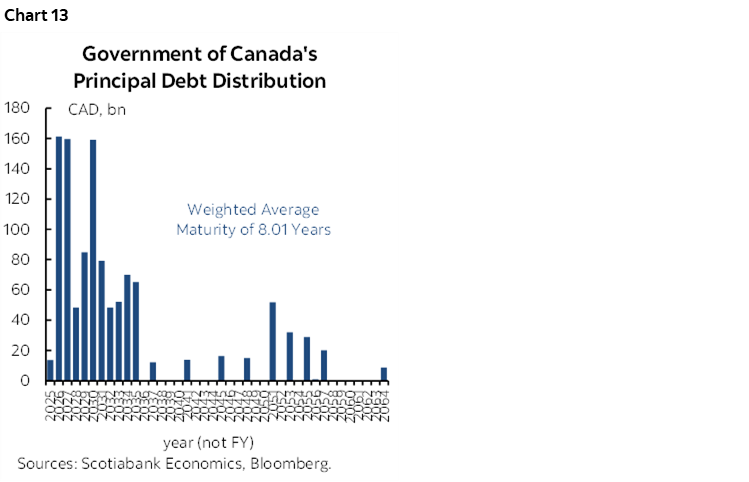
But issuance concerns will only really begin to be further informed after the budget and as markets digest global debt issuance over time. Net new debt issuance figures will be digested in the context of high rollover flows of maturing debts in the next few years (chart 13). The weighted average maturity of this debt is about eight years. A key detail will be the debt management strategy and how it seeks to influence this distribution. Also weigh this in the context of the BoC’s ongoing retrenchment from the bond market as it is not expected to return to making gross bond purchases in the normal conduct of monetary policy operations until at least late next year.
Where Canada is at a disadvantage is on regulations. Part of the reason behind why US Treasury yields have narrowed some of the spread over Canadian government bond yields is due to anticipation of US Bank buying of Ts through easier regs. Reducing the Supplementary Leverage Ratio for GSIBs (the largest banks) is estimated to bring in more than US$2 trillion of bank buying into Treasuries. The US Genius Act’s parameters placed around stablecoin (cybercurrency backed by fiat money, in this case the USD) are expected to unleash further Treasury buying. Canada is behind on both counts. Behind on real time payments systems and open banking compared to the UK.
The combination of all of these forces will lead us to further compress the expected negative differential of Canadian borrowing rates across the curve relative to the US.
The Immigration Plan
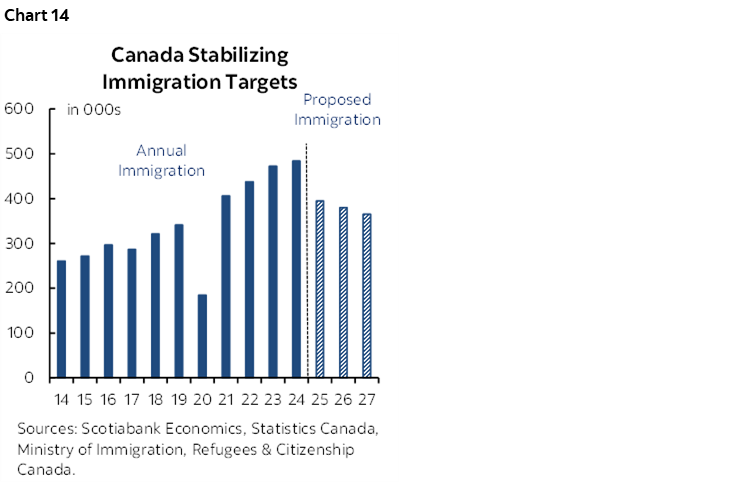
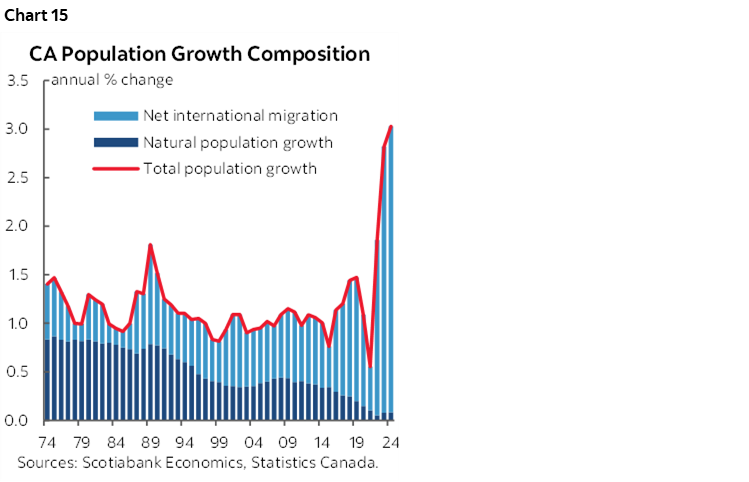
Another key feature of the broader fiscal, security and border plans that will be rolled out will be what is announced for immigration policy. Last year, Canada proposed cuts to immigration quotas shown in chart 14. Most of the cuts were to the temps/nonpermanent category (temporary foreign workers, international students etc), but permanent resident targets were also cut.
Population growth is now grinding to a halt at close to zero. This is payback for the massive surge that had occurred (chart 15) during a period in which frankly immigration policy was being thoroughly mismanaged in Canada through combined actions of federal and provincial governments, educational institutions and businesses.
What we don’t know is the longer-range plan and whether there may be further adjustments to the previously announced quotas. My hunch is that Canada is more likely to return toward higher immigration targets before the US where the challenges differ and the politics are much less favourable.
Last, watch for any plan to capitalize upon the US policy shift against top talent including through charging US$100k for H-1B visas.
Election Risk?
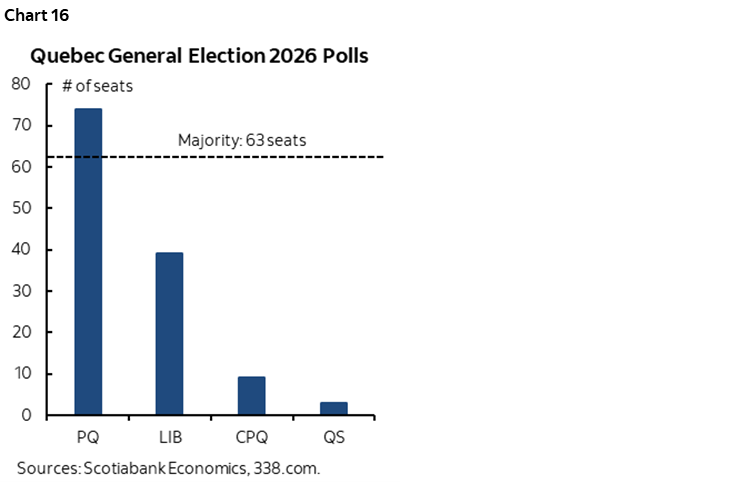
No, I’m not talking about Quebec’s provincial election next October with the separatists polling well and threatening to hold a referendum on separation should they win (chart 16). We’ll deal with that when we get closer to it and in the context of sensitive trade developments such as agriculture policies, so park it in the back of your minds for now. My bias is that there is little appetite for a referendum in today’s older Quebec population than in 1995 or 1980, especially given how long it took to recover, and especially during today’s troubled times, but politics could change rapidly.
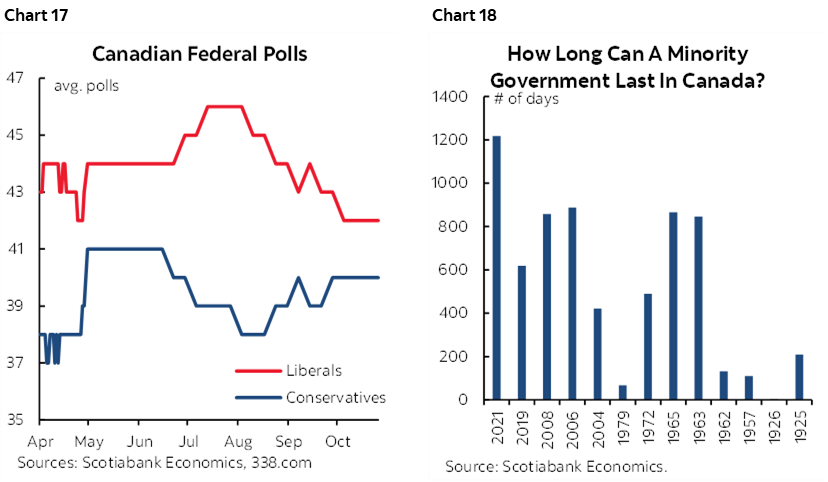
I’m speaking to the fact that the Liberal House Leader has been saying for some time that the minority government is struggling to feel out enough support among the opposition to pass its budget. If it can’t succeed in passing the budget, then the government may seek a stronger mandate in an election.
This is a tail risk in Canada at the moment—as nobody wants an election now—but watch the politics as closely as the Budget and its interpretations. Should an election be held, then current polling leans toward a similar outcome to what happened on April 28th with another Liberal minority. That could well backfire and create a protracted period of high uncertainty. Chart 17 and this site provide ongoing poll tracking. Chart 18 shows that most minority governments are short tenured.
TARIFF DEATHKNELL?
On Wednesday, the US Supreme Court will begin hearings into its review of US tariffs launched under the auspices of the International Emergency Economic Powers Act (IEEPA). At issue is whether President Trump abused the original intent of the legislation that allowed a President to point to an unusual and extraordinary threat to US national security, foreign policy or its economy that arises externally.
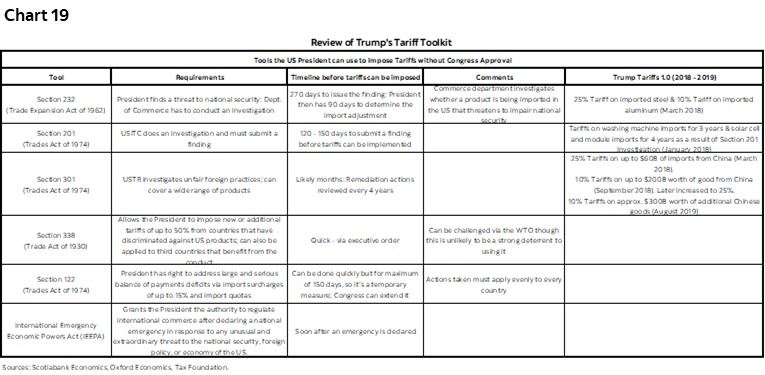
Here is a cheat sheet of US tariffs including specific references to those that have been applied under the IEEPA provisions. Here is a useful rolling timeline of trade policy developments in the US.
Both sides will be present at hearings, but when the Court reaches a decision is unclear. Given the urgency of the matter one would think they will act expeditiously, especially since we’ve been dealing with it throughout this year. Welcome to the US legal system, however, as the Court is generally expected to take several months and likely well into 2026 to arrive at a decision.
As a reminder, even if the Court strikes down use of the IEEPA and even if it orders tariffs collected to date to be reimbursed, this does not remove the ability to shift to other tools in order to impose tariffs. The IEEPA is more flexible, but chart 19 summarizes the others. The nuclear option would be to abrogate US duties under international trade agreements outright which would surely draw the ire of US businesses, workers and intense lobbying efforts.
NEW YORK’S MAYORAL ELECTION—DEMS PIVOTING FURTHER LEFT?
New Yorkers fancy themselves as residing at the centre of the universe. In some respects, they will be on Tuesday when the mayoral election is held.
This may be a litmus test before next November’s US midterms. The leading candidate is Zohran Mamdani (chart 20) and he is drawing upon the far left faction within the divided Democrats for his support particularly from public personas like Bernie Sanders and Alexandria Ocasio-Cortez (AOC). Judging by this cast, the Dems are pivoting further left to counter President Trump after voters arguably rejected left of centre policy stances by the Biden administration and Kamala Harris.

Most economists would say that while Mr. Mamdani’s heart and intentions may be in the right place, his policies are not. He supports rent controls, minimum wage hikes, free transit that harkens back to the days after the Russian Revolution, and vague ideas to lower grocery prices. The voter base risks being fooled on the wisdom of such policies.
Key will be whether New York’s politics resonate nationally or push more voters away from the Democrats. We’ll see if the pundits look back in retrospect and wish the Dems had merely sailed up the middle.
CANADIAN JOBS—FEWER NEEDED
Canada updates job market conditions with the Labour Force Survey for October on Friday. It’s one of two readings before the next Bank of Canada decision on December 10th which dampens some of its significance to markets. So does the fact that the BoC just set a very high bar against returning with further easing in its latest communications (here).
After a surprise 60k jobs were created in September it’s reasonable to expect some payback in the context of present macroeconomic uncertainties. Much of that gain was narrowly focused on Alberta but had otherwise solid details even if the gain in manufacturing jobs was kind of sus.
My guess is a loss of about 25k. Plus or minus a bazillion. The 95% confidence band around whatever number the survey spits out is about +/-57k. The unemployment rate may be stable through offsetting effects on the pool of labour.
One added reason (other than coming off the prior large gain) is that October’s seasonal adjustment factor tends to shave unadjusted jobs (chart 21) and when combined with what is likely to be on the low end of seasonally unadjusted figures for like months of October (chart 22) the most probable outcome is a material drop in seasonally adjusted jobs.

Further, surveys like the Ivey PMI and the CFIB’s small business hiring plans measure point toward downside risk to jobs over coming months.
Also keep a keen eye on the numbers Ottawa’s budget provides for public sector layoffs and how they seek to achieve them such as through attrition or outright packages.
If such expectations are anywhere close to reality, then they would restore a weak pattern for employment markets. Canada lost about 41k jobs in July, then another 66k in August before regaining 60k in September.
Hours worked may also be dented by the teacher’s strike in Alberta and Canada Post workers returning to work but at less than seasonally regular hours.
Several other points need to be noted before jumping to conclusions on the BoC.
For one, there isn’t much slack in the job market relative to estimates of the natural rate of unemployment. The OECD pegs that at about 6¼%. Further, much of the rise in the UR over recent years has been due to an overshoot of the number of temporary residents. As this category is gradually curtailed it should tighten the market.
For another, the monthly breakeven rate for job growth is probably between 0k and 10k now. The breakeven rate is the monthly pace of job growth that would keep the unemployment rate of 7.1% stable over the rest of 2025–26. I’ve assumed low labour force growth of about ½% per year with risks more slanted toward less than that. This is due to tighter immigration policy. Canada doesn’t necessarily need to grow employment in order to keep the labour force relatively tight.
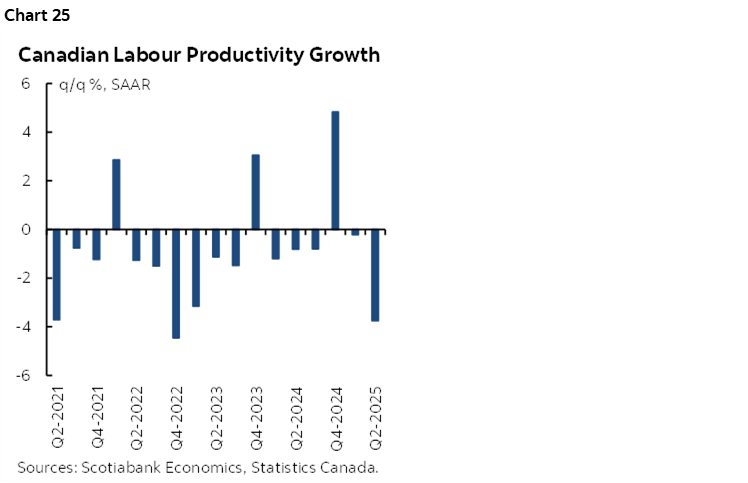
That being the case, we may not see material relief for wage growth. Average hourly earnings of permanent employees are running at 3.6% y/y and less than that more recently (chart 23). That’s an incomplete picture of wage growth in Canada. Since one-third of the workforce is governed by collective bargaining decisions, the lagging catch-up pay being sought by unions is important to consider as it drives persistent gains materially above the rate of inflation (chart 24). The average contract period is usually around four years which means a large portion of the workforce will receive sustained gains in the years ahead.
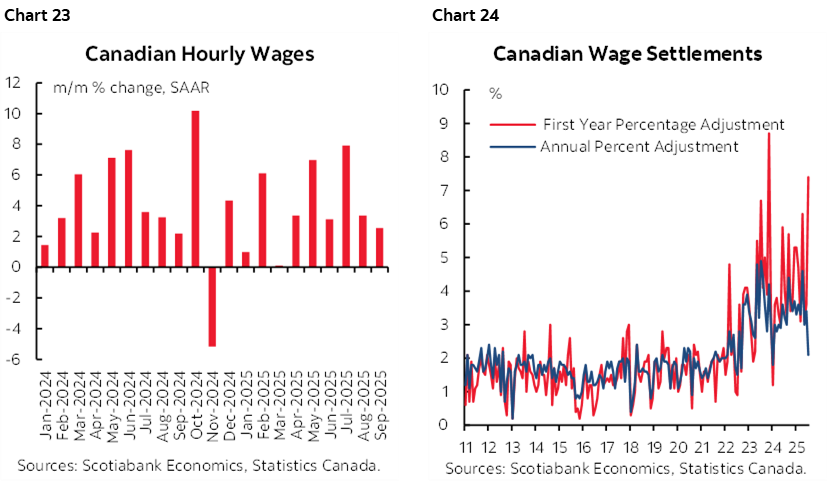
Unlike the US, Canada does not have the labour productivity readings to support this (chart 25). Its labour is losing international competitiveness.
NONFARM PAYROLLS—IF ONLY…
Nonfarm payrolls for October were to have been released on Friday November 7th. The US government shutdown makes that impossible since there is not immediate traction toward reopening, and it will take perhaps weeks thereafter to be ready to release not only October but also the delayed September numbers.
But just because the government is shut doesn’t mean we are. We still have a job to do, albeit with more imperfect information than usual.
I’ve loosely estimated a nonfarm payroll decline of 90k in October in addition to the earlier estimate for September (-20k). We’re missing a lot of inputs, but our tracking draws upon a softer than usual seasonally unadjusted change compared to normal months of October (chart 26) combined with a seasonal adjustment factor assumed to be close to the October 2024 level (chart 27) to result in higher probability of a sharp drop in seasonally adjusted payrolls than a small gain (chart 28).
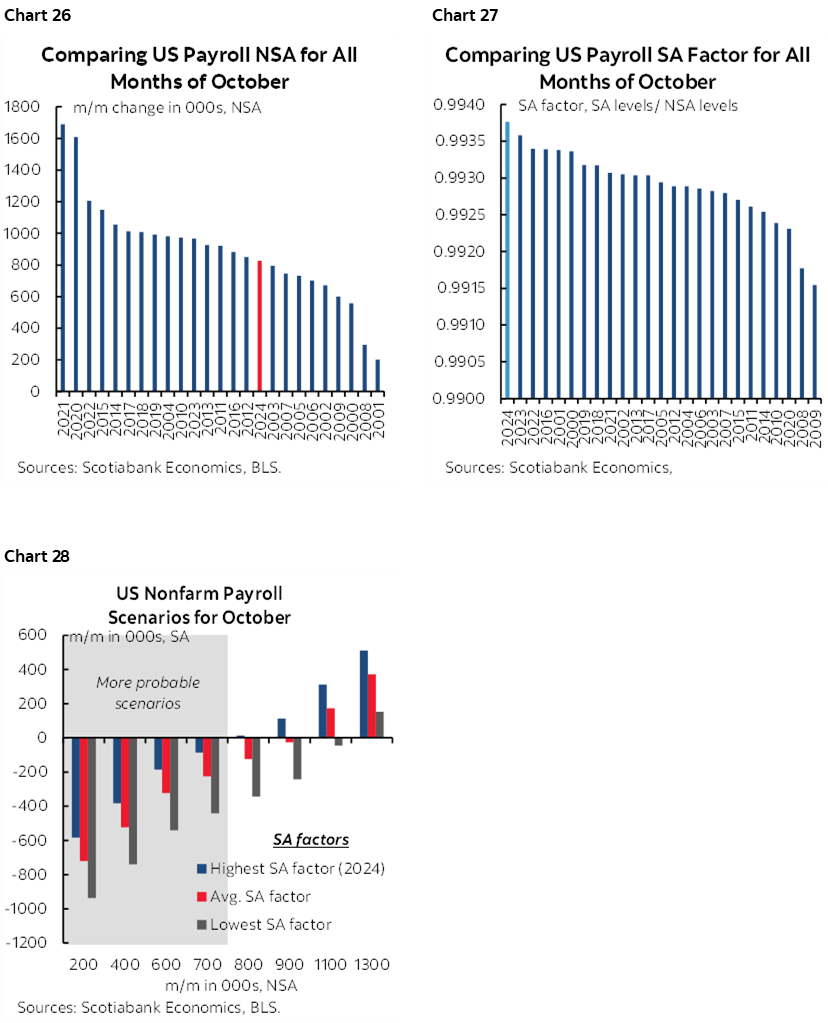
We may revise this estimate as we get more information including whether we get September payrolls before October’s or simultaneously.
CENTRAL BANKS—ONLY ONE STANDOUT
Seven central banks offer up decisions over the coming week alongside additional communications from some others.
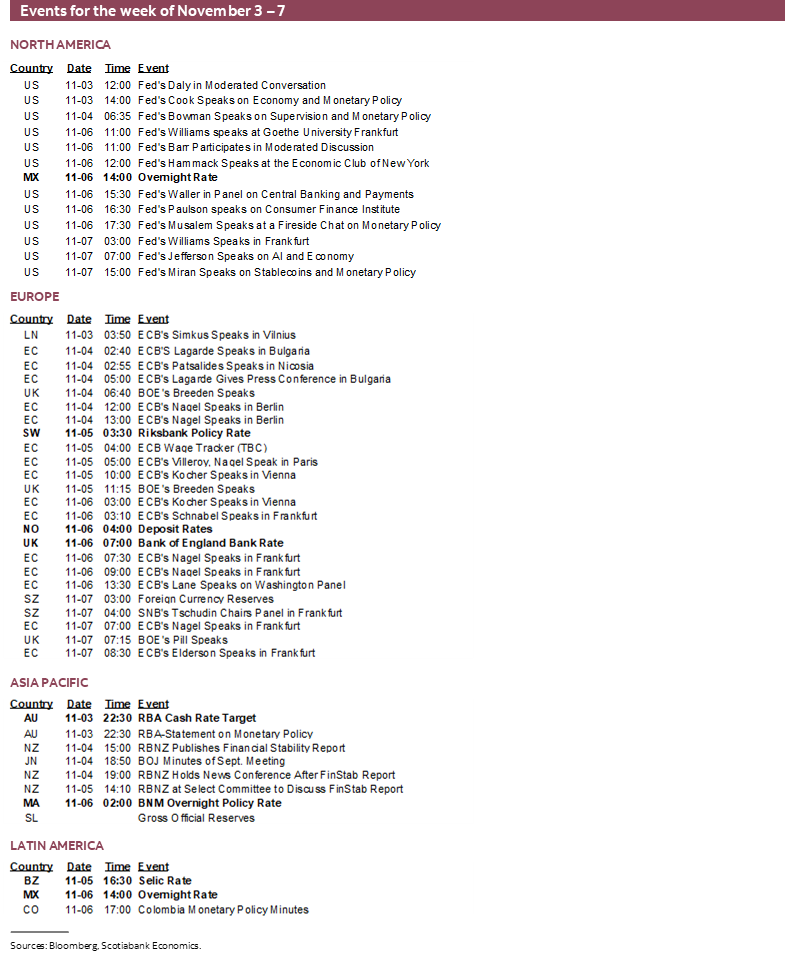
BoC’s Macklem Returns
Bank of Canada Governor Macklem returns on Monday to deliver a fireside chat in one of the BoC’s favourite hangouts in Toronto. There will be no press conference or published remarks or audience Q&A, just chit chat. It’s unlikely that he’ll have any materially new to say after this past week’s full suite of communications.
RBA to Hold
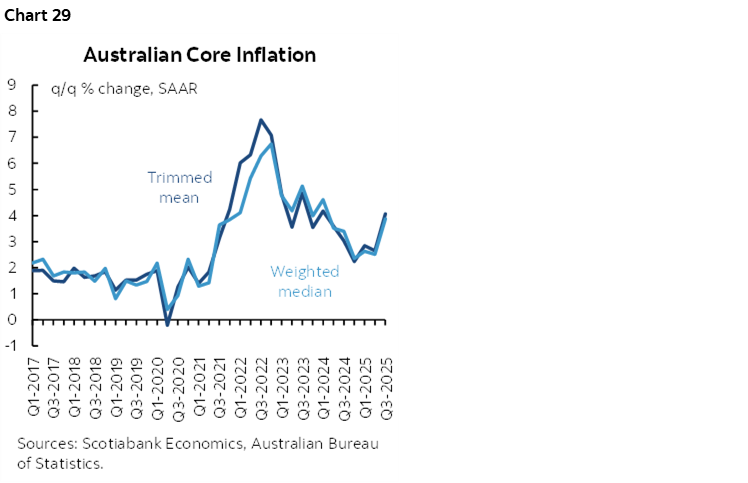
Everyone expects the Reserve Bank of Australia to be on hold on Monday night (ET) with the policy cash rate set at 3.6%. Markets are fully priced for this. The recent acceleration of underlying inflation keeps the lid on further easing for now and with markets pricing no action for the next several meetings (chart 29).
Riksbank—You’re No Fun!
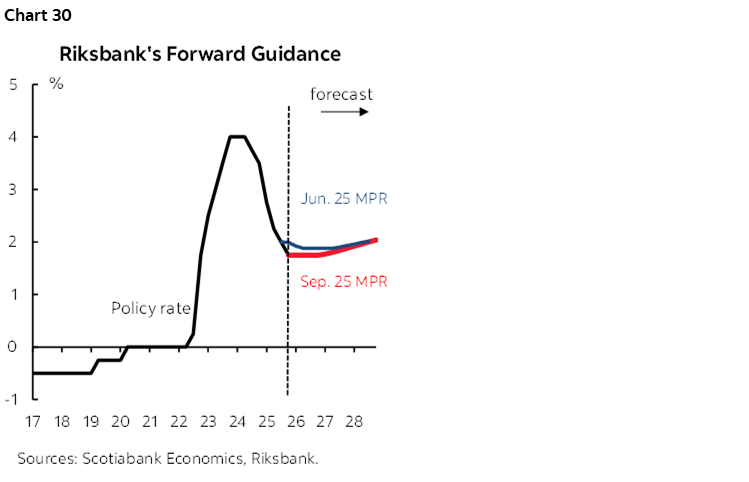
Sweden’s central bank is widely expected to keep its repo rate unchanged at 1.75% on Wednesday morning. Markets have no action priced for several meetings. The prior statement on September 23rd bluntly stated that “if the outlook for inflation and economic activity holds, the policy rate is expected to remain at this level for some time to come.” Explicit forward guidance points to the next move eventually being up but not for a while (chart 30). That takes some of the fun out of forecasting at least in the short-run but so be it.
BCB—Give it More Time
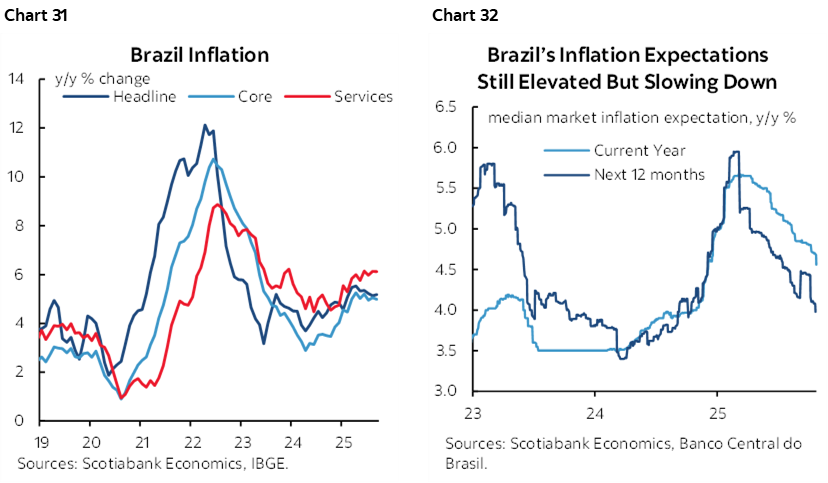
Brazil’s central bank is also widely expected to hold its Selic rate unchanged at 15% on Wednesday afternoon. Neither actual inflation (chart 31) nor inflation expectations (chart 32) are combining to provide comfort to begin easing after a tightening campaign raised the policy rate by 450bps starting last September through to June.
Bank Negara—No Need for Assistance
Add Malaysia’s central bank to the list of expected pauses when they opine on Thursday. The overnight rate is expected to remain at 2.75%. It came off the sidelines to cut 25bps in July and then held in September. Stronger than expected economic growth in Q3 when GDP grew by 5.2% y/y (4.2% consensus) was likely enough to cement a hold at this meeting. CPI inflation then mildly surprised higher at 1.5^ y/y but has recently been on a gentle upward trend.
Norges Bank—Taking Its Time
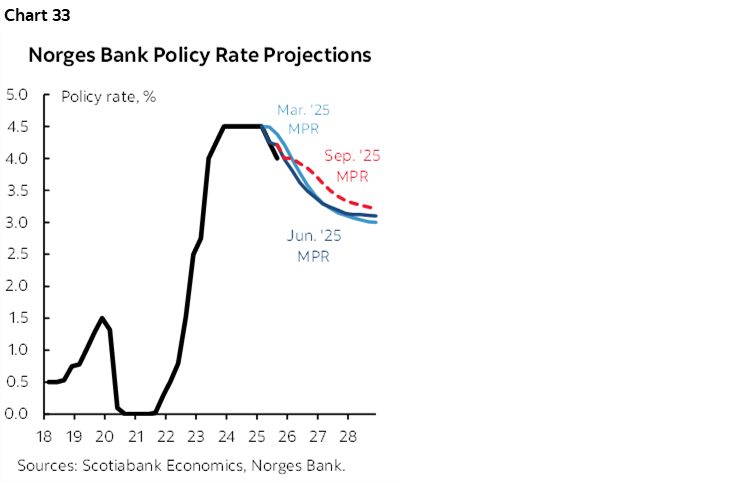
Norway’s central bank won’t break the streak of central banks staying on hold this week. Markets have nothing priced for rate changes over the next three meetings. Norges is among the few central banks that provides explicit forward guidance. They said in September that “if the economy evolves broadly as currently projected, the policy rate will be reduced further in the course of the coming year.” That indicated no rush to the easing bias, and its formal rate projection shows one cut in each of the next three years (chart 33).
BoE—Hold On There a Minute
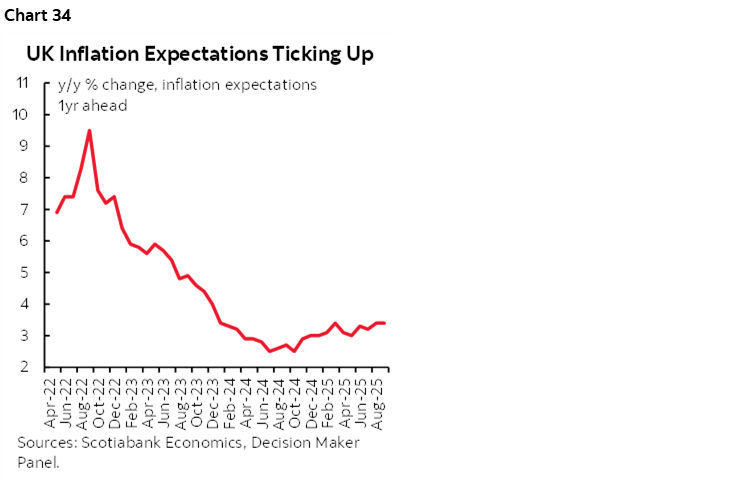
Nope, not this one either. Add another hold to the list. Consensus expects Bank Rate to stay at 4% and OIS markets are 75% priced for a hold with a modest chance of a cut. A hold would break the oscillating pattern of cuts and holds that was consistent with the BoE’s preference toward ‘gradual’ adjustments. Chief Economist Huw Pill noted in a recent speech that “The need to recognize the stubbornness of inflationary pressures is becoming more pressing.” Core inflation was 3.5% y/y in September with headline CPI at 3.8% and services inflation was even higher at 4.7% while expectations are rising (chart 34).
Banxico—Focus on Growth
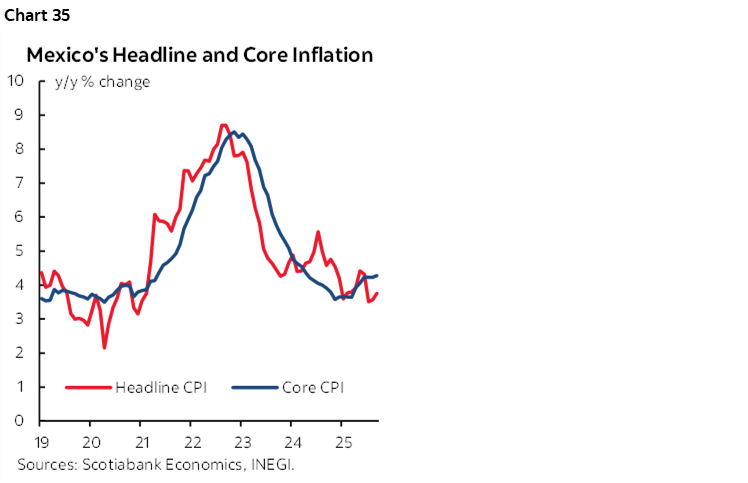
Finally! Here’s one that’s not boring! Mexico’s central bank is expected to cut its overnight rate by 25bps when it weighs in on Thursday. September’s policy statement maintained an easing bias. It repeated that “the Board will assess further adjustments to the reference rate.” Deputy Governor Heath dissented in favour of holding. The fact that the economy mildly contracted in Q3 with GDP falling -0.3% q/q SA nonannualized may have the central bank choosing to prop up growth despite inflation still running above target at 3.6% y/y (chart 35). Those residual inflation concerns and dissenting views are part of why the pace of easing was slowed from 50bps cuts until June to quarter point reductions since then.
RBNZ—Stability Concerns
RBNZ watchers will be treated to another Financial Stability Report on Tuesday. This is not a policy decision, but its assessment of stability risks can indirectly matter to its policy stance. The last report was way back on May 6th. At the time it said trade restrictions were the key risk to stability and that’s likely to be repeated.
GLOBAL MACRO—A FEW MORE NUGGETS
A round of global inflation reports peppered across Latin America and Asia will be the main source of data risk to regional markets.
The list of suspended US data releases will continue to grow, but a number of private industry reports will maintain some interest. ISM manufacturing for October (Monday) and ISM-services (Wednesday), vehicle sales during October (Monday), Challenger layoffs in October (Thursday) and UMich Consumer Sentiment for November (Friday) will marginally add to a fresher understanding of the health of the US economy. Payrolls won’t come out as scheduled on Friday.
New Zealand’s job market has been soft for some time with slight employment declines in four of the past six quarters. Q3 jobs and wages will be refreshed on Tuesday just before the RBNZ hosts the press conference for its stability report.
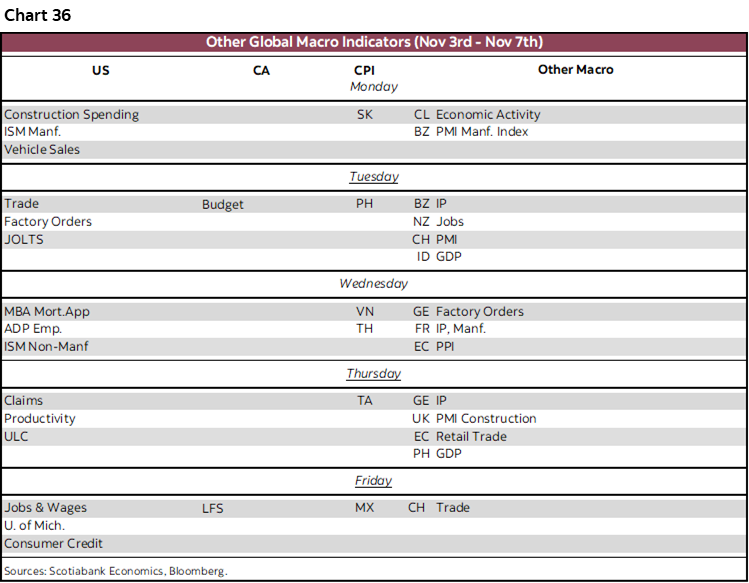
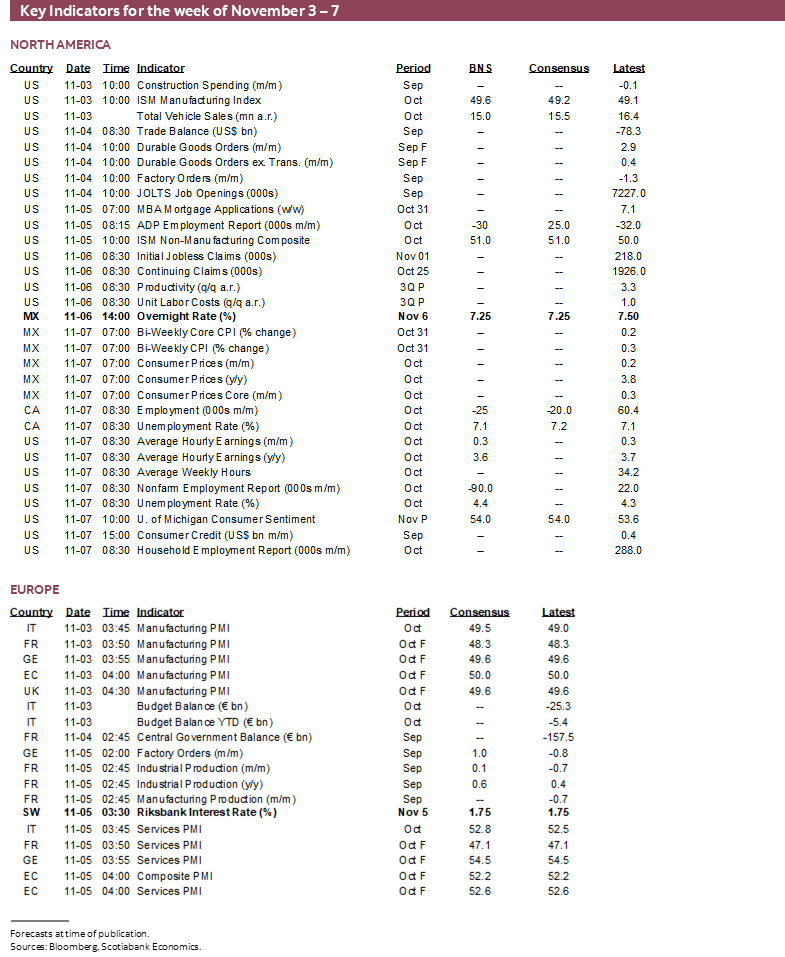
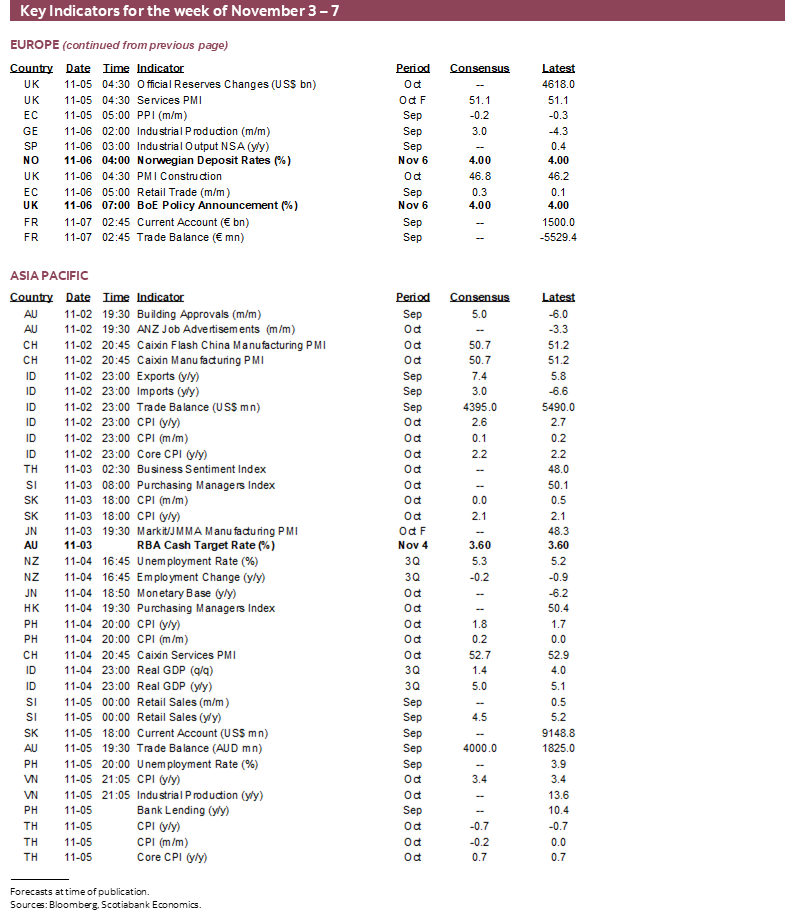
Please see chart 36 for a summary of global readings with more information in daily notes over the course of the week.


DISCLAIMER
This report has been prepared by Scotiabank Economics as a resource for the clients of Scotiabank. Opinions, estimates and projections contained herein are our own as of the date hereof and are subject to change without notice. The information and opinions contained herein have been compiled or arrived at from sources believed reliable but no representation or warranty, express or implied, is made as to their accuracy or completeness. Neither Scotiabank nor any of its officers, directors, partners, employees or affiliates accepts any liability whatsoever for any direct or consequential loss arising from any use of this report or its contents.
These reports are provided to you for informational purposes only. This report is not, and is not constructed as, an offer to sell or solicitation of any offer to buy any financial instrument, nor shall this report be construed as an opinion as to whether you should enter into any swap or trading strategy involving a swap or any other transaction. The information contained in this report is not intended to be, and does not constitute, a recommendation of a swap or trading strategy involving a swap within the meaning of U.S. Commodity Futures Trading Commission Regulation 23.434 and Appendix A thereto. This material is not intended to be individually tailored to your needs or characteristics and should not be viewed as a “call to action” or suggestion that you enter into a swap or trading strategy involving a swap or any other transaction. Scotiabank may engage in transactions in a manner inconsistent with the views discussed this report and may have positions, or be in the process of acquiring or disposing of positions, referred to in this report.
Scotiabank, its affiliates and any of their respective officers, directors and employees may from time to time take positions in currencies, act as managers, co-managers or underwriters of a public offering or act as principals or agents, deal in, own or act as market makers or advisors, brokers or commercial and/or investment bankers in relation to securities or related derivatives. As a result of these actions, Scotiabank may receive remuneration. All Scotiabank products and services are subject to the terms of applicable agreements and local regulations. Officers, directors and employees of Scotiabank and its affiliates may serve as directors of corporations.
Any securities discussed in this report may not be suitable for all investors. Scotiabank recommends that investors independently evaluate any issuer and security discussed in this report, and consult with any advisors they deem necessary prior to making any investment.
This report and all information, opinions and conclusions contained in it are protected by copyright. This information may not be reproduced without the prior express written consent of Scotiabank.
™ Trademark of The Bank of Nova Scotia. Used under license, where applicable.
Scotiabank, together with “Global Banking and Markets”, is a marketing name for the global corporate and investment banking and capital markets businesses of The Bank of Nova Scotia and certain of its affiliates in the countries where they operate, including; Scotiabank Europe plc; Scotiabank (Ireland) Designated Activity Company; Scotiabank Inverlat S.A., Institución de Banca Múltiple, Grupo Financiero Scotiabank Inverlat, Scotia Inverlat Casa de Bolsa, S.A. de C.V., Grupo Financiero Scotiabank Inverlat, Scotia Inverlat Derivados S.A. de C.V. – all members of the Scotiabank group and authorized users of the Scotiabank mark. The Bank of Nova Scotia is incorporated in Canada with limited liability and is authorised and regulated by the Office of the Superintendent of Financial Institutions Canada. The Bank of Nova Scotia is authorized by the UK Prudential Regulation Authority and is subject to regulation by the UK Financial Conduct Authority and limited regulation by the UK Prudential Regulation Authority. Details about the extent of The Bank of Nova Scotia's regulation by the UK Prudential Regulation Authority are available from us on request. Scotiabank Europe plc is authorized by the UK Prudential Regulation Authority and regulated by the UK Financial Conduct Authority and the UK Prudential Regulation Authority.
Scotiabank Inverlat, S.A., Scotia Inverlat Casa de Bolsa, S.A. de C.V, Grupo Financiero Scotiabank Inverlat, and Scotia Inverlat Derivados, S.A. de C.V., are each authorized and regulated by the Mexican financial authorities.
Not all products and services are offered in all jurisdictions. Services described are available in jurisdictions where permitted by law.