Next Week's Risk Dashboard
- Don’t bank on nonfarm arriving this week
- The shutdown pits competing agendas over what to further subsidize
- Canadian jobs preview
- Mr. Carney goes to Washington
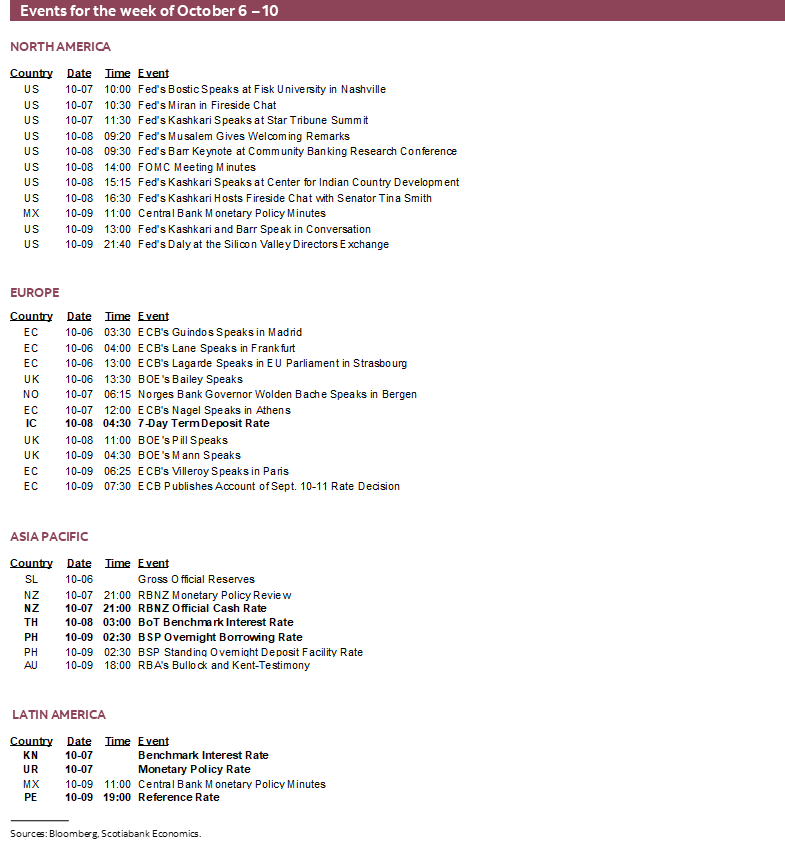
- What to watch for in the FOMC minutes
- RBNZ: 25 or 50?
- BCRP is probably done
- BSP may be done easing
- BoT expected to cut again
- Global macro
Chart of the Week
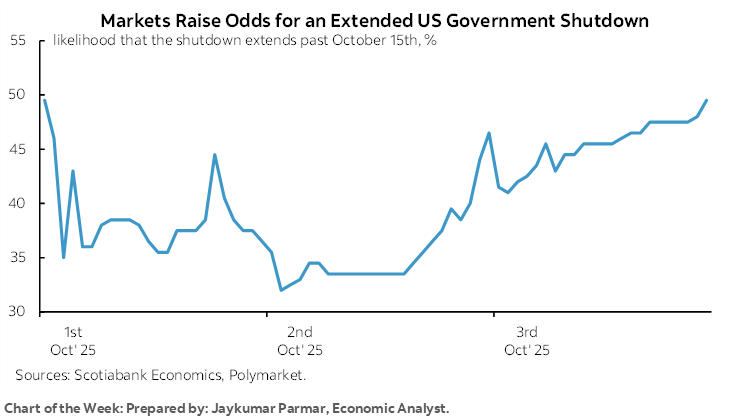
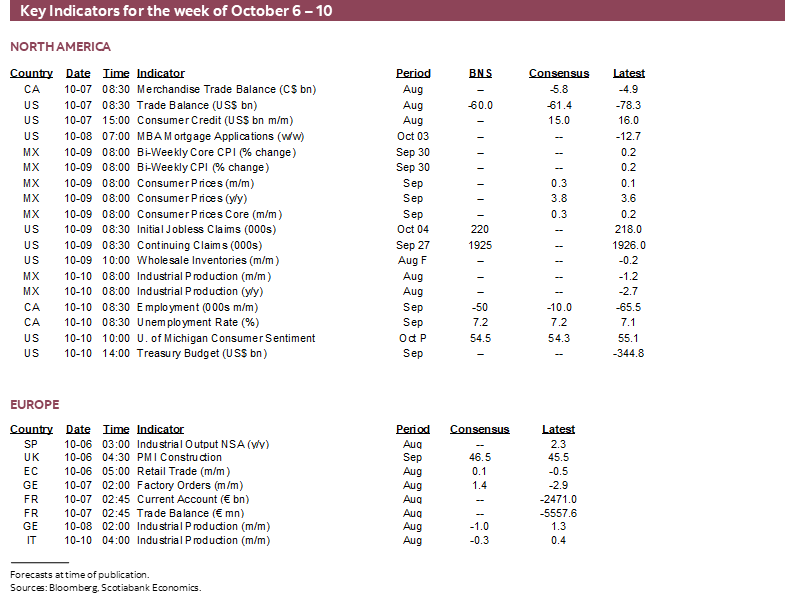
Whether or not the US government reopens and paves the way for the arrival of nonfarm payrolls will be the week’s most closely watched development.
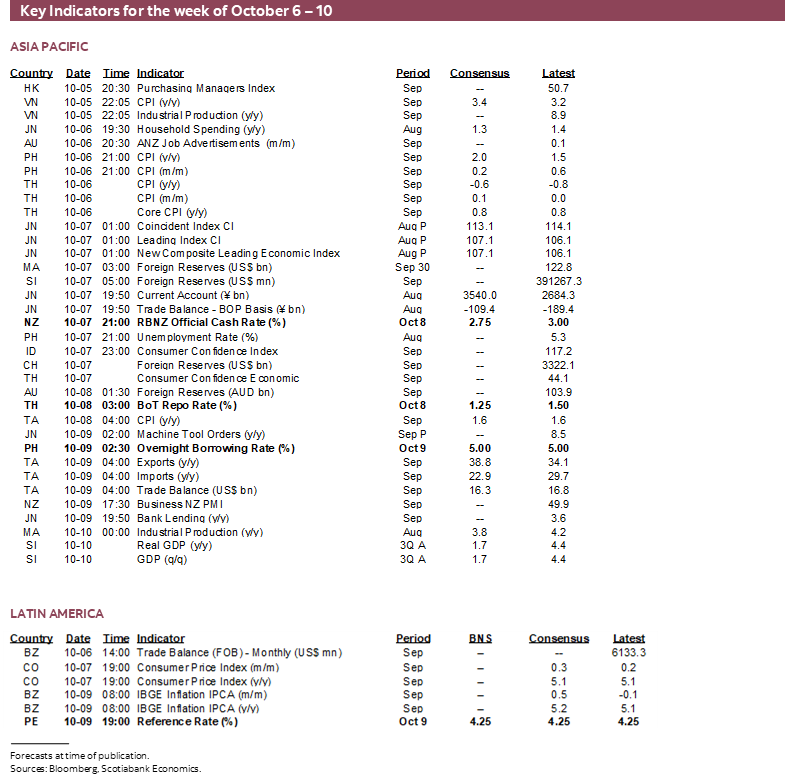
FOMC minutes could be informative on multiple counts, but the rest of the global line-up will focus upon other central banks. The BoC’s next decision may be informed by Friday’s Canadian jobs report, while more pressing decisions await the RBNZ decision whether to upsize, and decisions by central banks in Peru, Thailand and the Philippines. Canadian markets will also aim a keen eye at PM Carney’s visit to see Trump about trade negotiations on Tuesday.
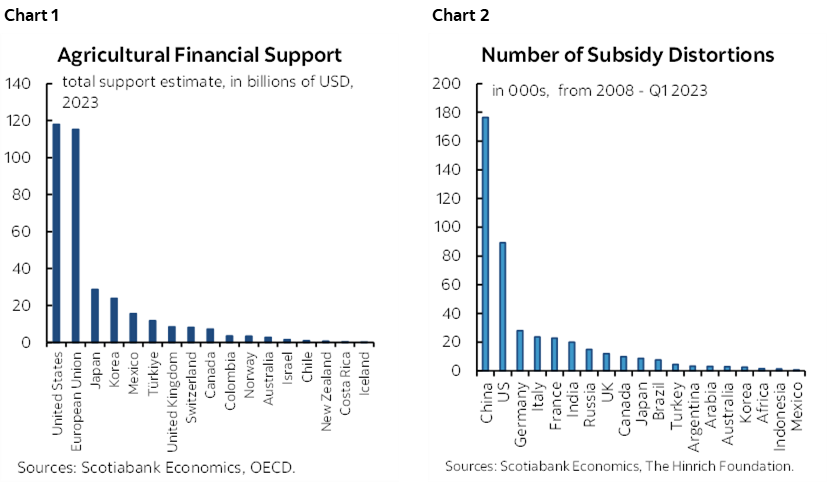
Also watch for any further developments around a) Trump’s threats to fire thousands of federal government workers, b) Trump’s musings on tariff-funded cheques to households that could cost hundreds of billions of dollars at $1–2k per person, and c) his promise of billions of extra support for US farmers. US farmers already receive more agricultural subsidies than anywhere else (chart 1) while the US ranks second on overall subsidies (chart 2). Dems might argue that this proves there is money for health care in their current spat with the administration and that ending the shutdown is a political choice around chosen subsidies.
NONFARM OR NO NONFARM?
Markets continue to anxiously await the next nonfarm payrolls reading for September. It’s not necessarily the case that payrolls will be released this coming week even if the US government reopens by early in the week.
For example, when the shutdown ended on Thursday October 17th, 2013, nonfarm was released the following Tuesday, October 22nd. The lengthy 35-day shutdown in late 2018 to early 2019 did not affect the release of payrolls because it was a partial shutdown. The December 1995 to January 1996 shutdown delayed the release of payrolls until January 19th after the shutdown ended on January 6th. The BLS now indicates that the data collection has been completed for this pass, but presumably the analysis, tables, and press release still need to be created and with the BLS shot on resources.
It's also unclear if more responses are coming in such that the longer the shutdown, the more data will have to be evaluated which dents the guidance from the BLS that they are ready with the data now. Chart 3 shows the collection rates on a typical first pass versus the ultimate collection rate as more data is collected.
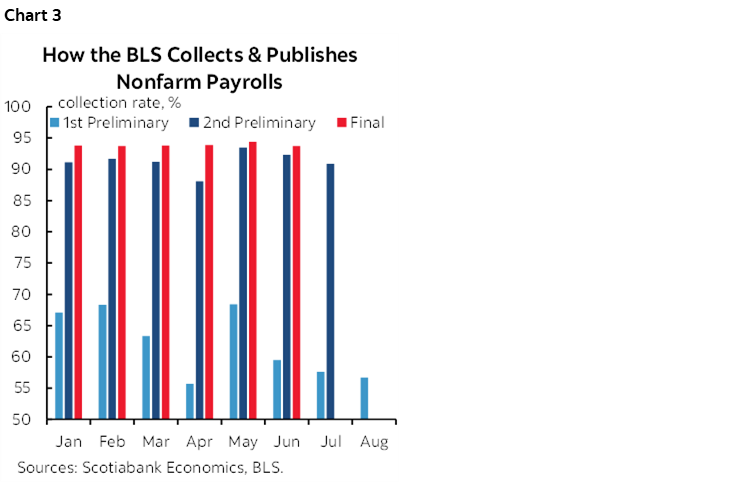
In any event, with the -32k drop in ADP payrolls indicating about a 10% chance of consensus being right about expectations for nonfarm private payrolls coming in at 65k or higher (chart 4), ADP is signalling high odds of a downside surprise to nonfarm. Further, job cuts in September were seasonally normal (often misreported as lower because it’s seasonally unadjusted data), but this year is tracking among the highest number of job cuts and lowest amount of gross hiring on record (charts 5, 6).
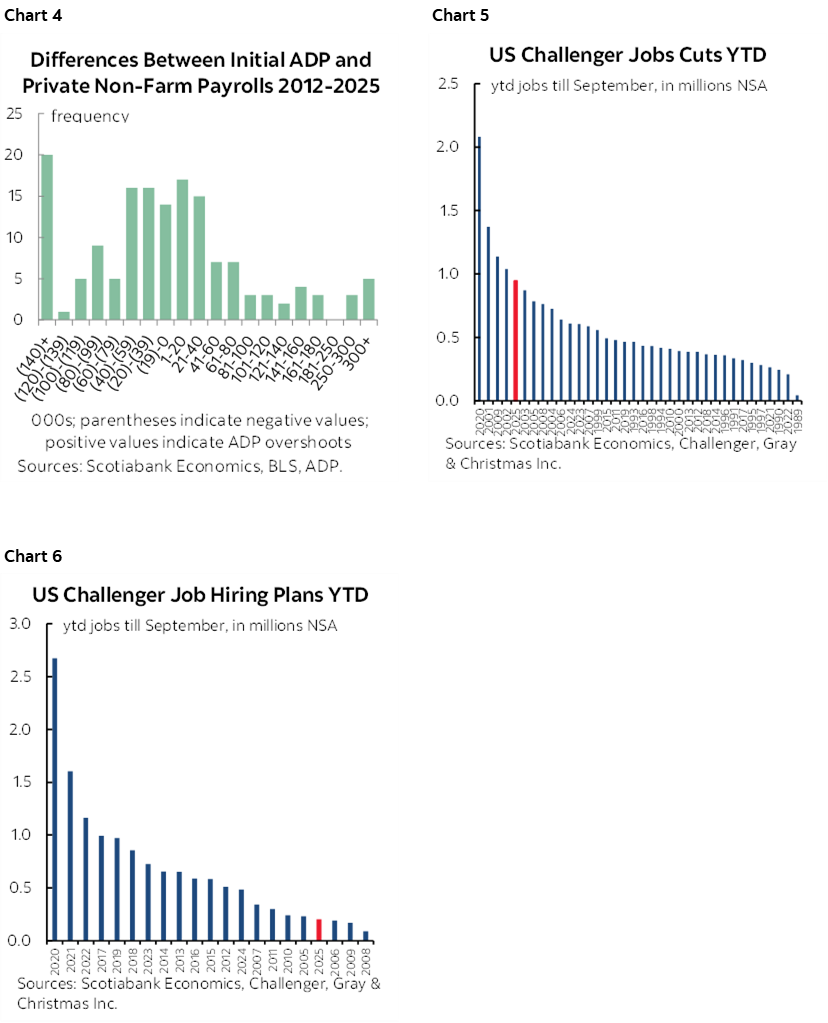
We have a picture of a weak US job market. That still leaves open how nonfarm’s quirks could stray from these and other readings. My estimate remains -20k.
CANADA’S JOB MARKET—COST CONTAINMENT
Canada offers up another set of job market readings on Friday that will be the last set of numbers before the next Bank of Canada decision on October 29th.
My September guesstimate is a drop of 50k jobs and an up-tick in the unemployment rate to 7.2%.
There is always high uncertainty around the estimate because it’s based on a household survey with a limited sample. In repeated sampling, 95 times out of 100 the high survey error factor translates into a wide bracket of +/-57k around the published estimate for the change in total employment. So, if, say, this week’s estimate is a drop of 50k, I’d be careful perversely celebrating my forecast because the true number may be more like anywhere from -107k to +7k.
Hence, we need to be very careful with jobs estimates even more so in Canada—where the most widely followed measures are from a household survey—than in the US—where the most widely followed nonfarm payrolls measure is full of quirks and oddities of its own.
But let’s give it a whirl. We’ve just had over 100k jobs lost back-to-back in July and August. Historically the odds favour another large dip the next month especially if the economy is slipping into recession which is uncertain at this point. Chart 7.
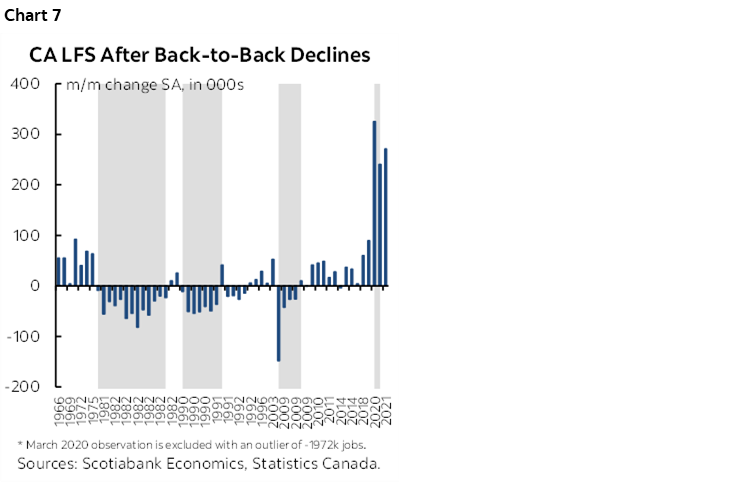
There are two reasons for the what-goes-down-can-keep-doing-down argument. One is that there is useful information in trend hiring attitudes drawn from the recent pattern. If employers lacked confidence to hire the prior month of two, then unless something changed, they might continue to lack confidence the next month.
Two is the way Statcan rotates its panel samples that keep dwellings in the sample for six consecutive months with one-sixth of the sample in the first month of the survey removed each time to make way for inclusion of the latest month. What this does is to arguably create persistence by repeatedly sampling the same regions and industries as most of the household sample stays the same each month. The risk is that it becomes a survey that feeds on gloom in the same regions and same industries, is slow to turn, and then feeds on persistent optimism at other times. One month’s jobs reading can wind up correlated to the next one which in this case means last month’s loss can perpetuate the next month. There has been past research on panel correlations to demonstrate this.
There are other supporting arguments for a drop.
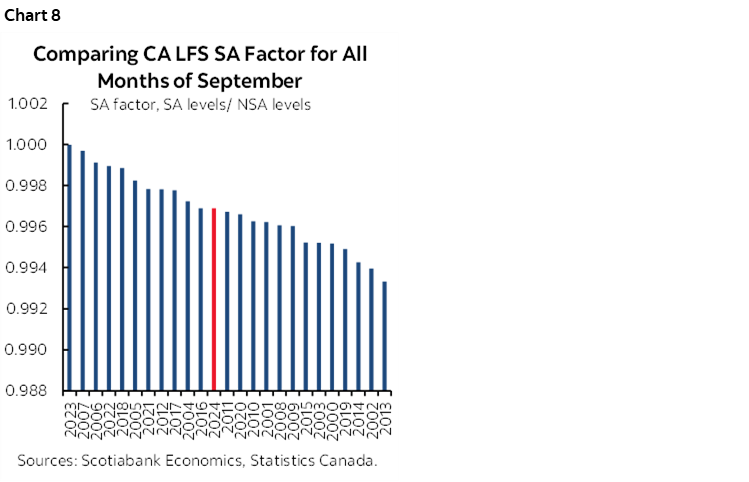
For one, seasonal adjustment factors for September are usually just below 1.0 and may continue to drift back toward the center of the historical range for like months of September (chart 8). The recency bias in how seasonal adjustment factors are calculated by using standard X12A methods may be gaining greater distance from the seasonal distortions of the pandemic. If so, then even a slight further dip would shave a meaningful amount from seasonally adjusted employment.
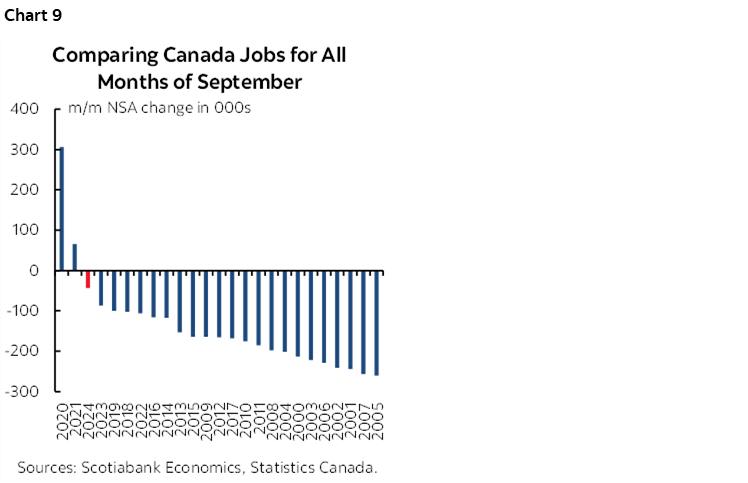
Further, September is usually a down-month for seasonally unadjusted employment (chart 9). If we get a 100k seasonally unadjusted drop combined with my assumption on the SA factor, then jobs would fall by about 50k m/m, seasonally adjusted. A 100k seasonally unadjusted dip is relatively conservative compared to like months in history.
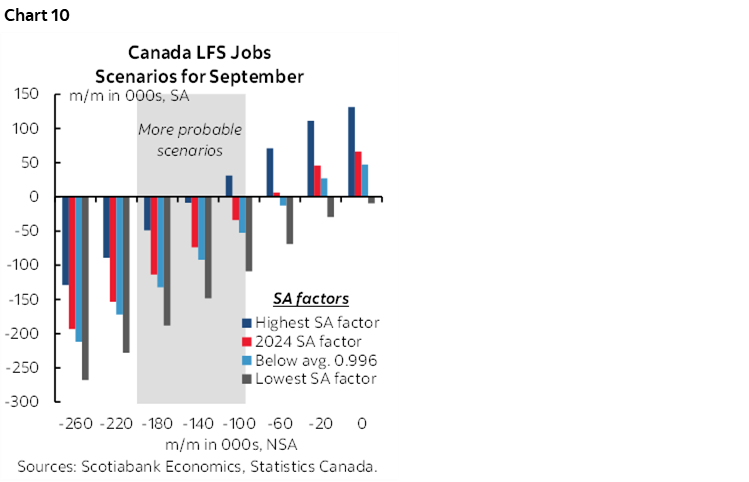
We may be at an inflection point that raises the odds of a worse number given the challenges facing the economy. I don’t find a drop of 50k SA and 100k NSA to be an unreasonable expectation; it could easily be quite a bit more. Chart 10 shows the range of possible outcomes for seasonally adjusted employment at different assumptions for the seasonally unadjusted outcome and the SA factor.
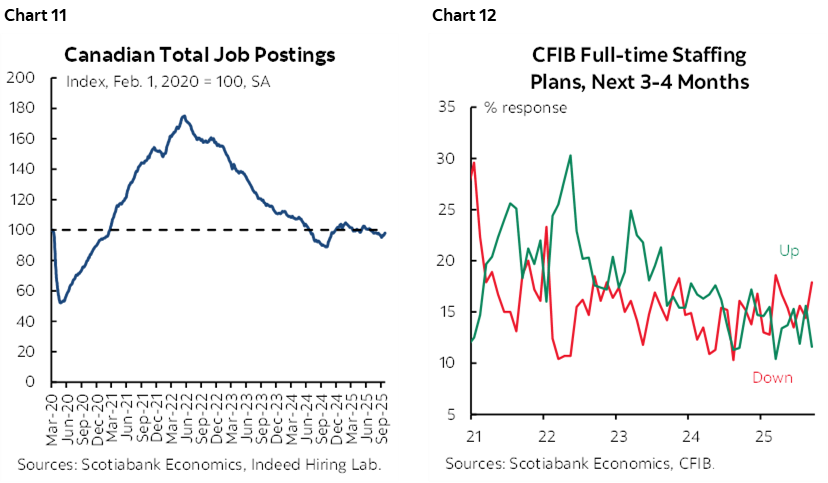
Other advance readings that might help with the call are fairly limited in Canada. ‘Indeed’ job postings have been trending a smidge below the long run average (chart 11). Small businesses are indicating less hiring appetite and more plans for letting workers go (chart 12). S&P PMIs indicated less appetite for hiring among manufacturers.
On the flip side is youth employment. Since temps took many of their seasonal jobs, the youth category did not demonstrate the same summer job gains as in past years; July, for instance, was the weakest month of July on record for summer jobs. What they didn’t gain as much as usual over the summer they may not lose as much as usual when the school bells ring. In plain English, youth employment might not show the same seasonally unadjusted drop in September and hence seasonally adjusted youth employment in September may perversely benefit from a dud of a summer job market. This could be an upside risk to total employment.
And yet corporate Canada is shell-shocked by tariffs and other supply chain challenges. In this environment that means cost containment. Cost containment means less hiring appetite.
CENTRAL BANKS—FOMC MINUTES AND FOUR DECISIONS
Four central banks will weigh in with updated decisions this week. In addition, we’ll get the minutes to the FOMC’s meeting on September 16th – 17th.
What to Watch for in the FOMC Minutes
A recap of that meeting is available here. There are several things to watch for in the minutes on Wednesday afternoon.
For one, there may be a more colourful debate at this one since newly minted Governor Miran—on loan from the Trump administration—brought his wrecking ball with him.
Also watch for further discussion on funding market challenges. The pressure is on the Fed to reassess conditions as SOFR spreads widen (chart 13). Key is that reserves in the banking system have fallen below US$3 trillion for the first time since early 2023 (chart 14). They knew at this meeting that reserves were tumbling, and they’ve fallen further since. At under US$3T, reserves are inching closer to the roughly $2¾ trillion ample reserves estimate of some Fed officials. One driver is reallocation of reserves to fund a surge of T-bill issuance (chart 15) is occurring to replenish the Treasury General Account used to fund the government after it was depleted during the latest debt ceiling fracas (chart 16). What that’s done is to deplete spare cash in the system such that there isn’t much being parked in overnight repo as one indication of tightened liquidity and pressure on spreads (chart 17).
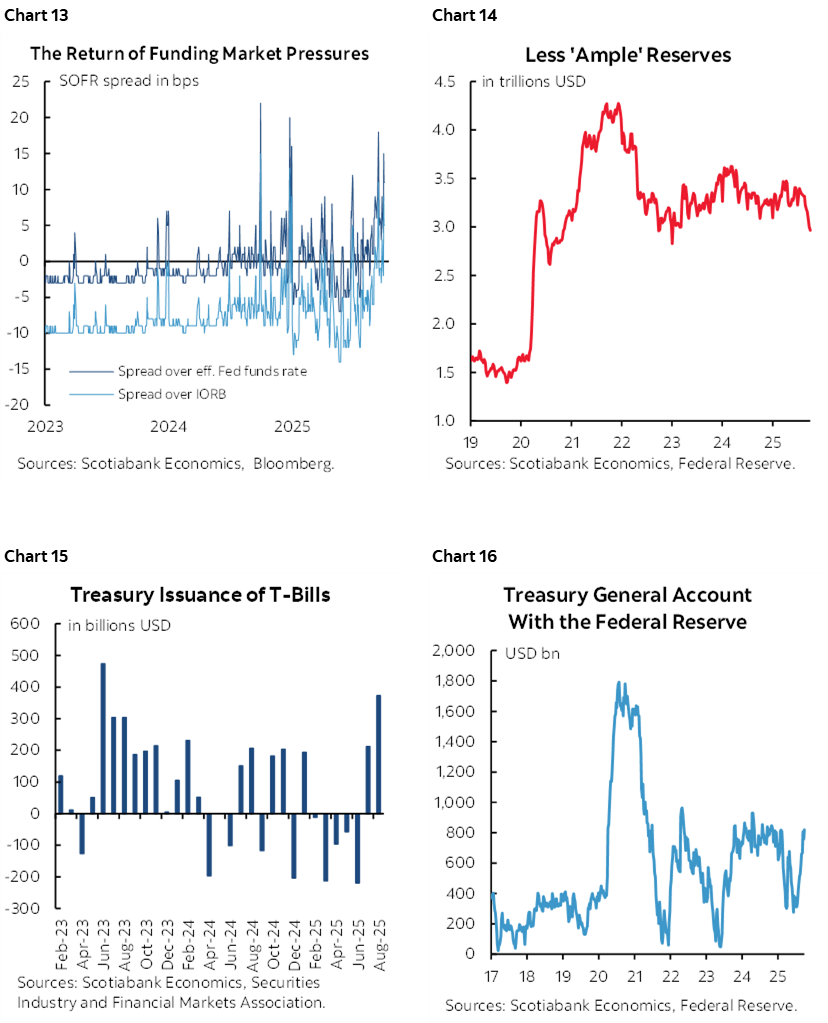
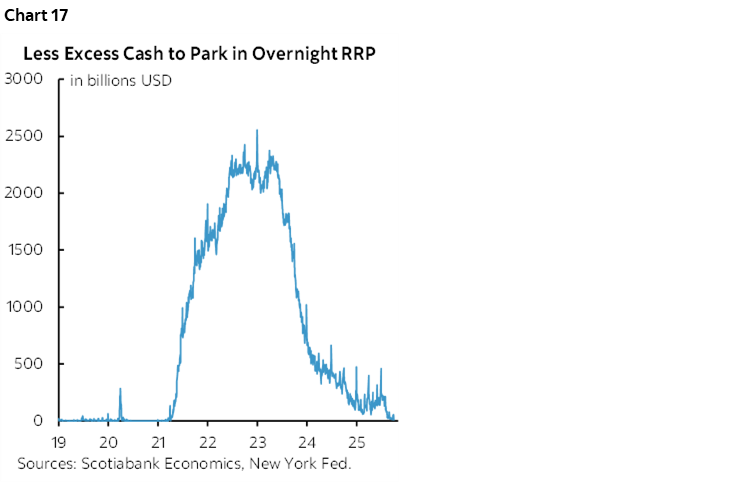
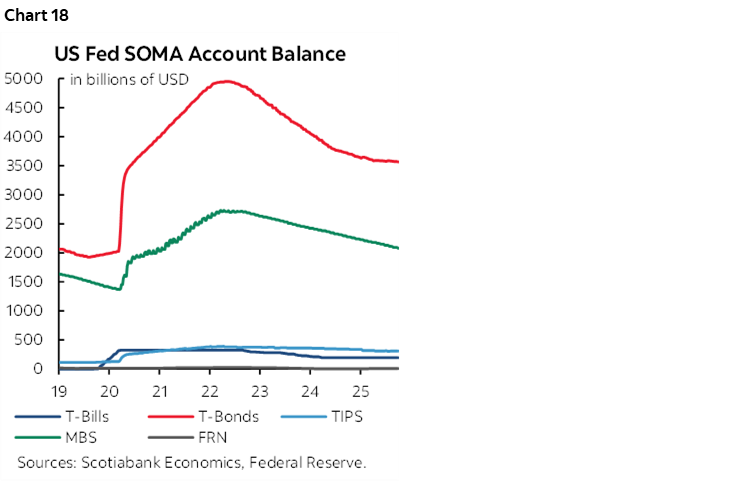
If this is temporary—until the TGA replenishment has stabilized, for instance —then perhaps the quantitative tightening that is driving the Fed’s SOMA holdings of Treasury securities and MBS lower (chart 18) need not be revisited before year-end. If the forces are judged to be more than just temporarily related to quarter-end funding pressures, tax season and TGS replenishment, then the Fed could move toward ending QT earlier than previously expected. The next major test could well be bank year-end funding.
The bottom line for now is that we don’t know the answer to this and will watch for any possible further discussion in the minutes.
Another topic may be further discussion about altering the policy rate benchmark. Dallas Fed President Logan recently laid out a whole speech on the topic (here). It’s a good speech for those with an interest in more technical aspects of the Fed’s framework. Amid so much confusion around the outlook, what the FOMC should do, and political meddling, it’s my belief that we should think very carefully about potentially adding extra confusion across the Fed’s varied stakeholders and this time on something as germane to its operations as what policy rate they are using!
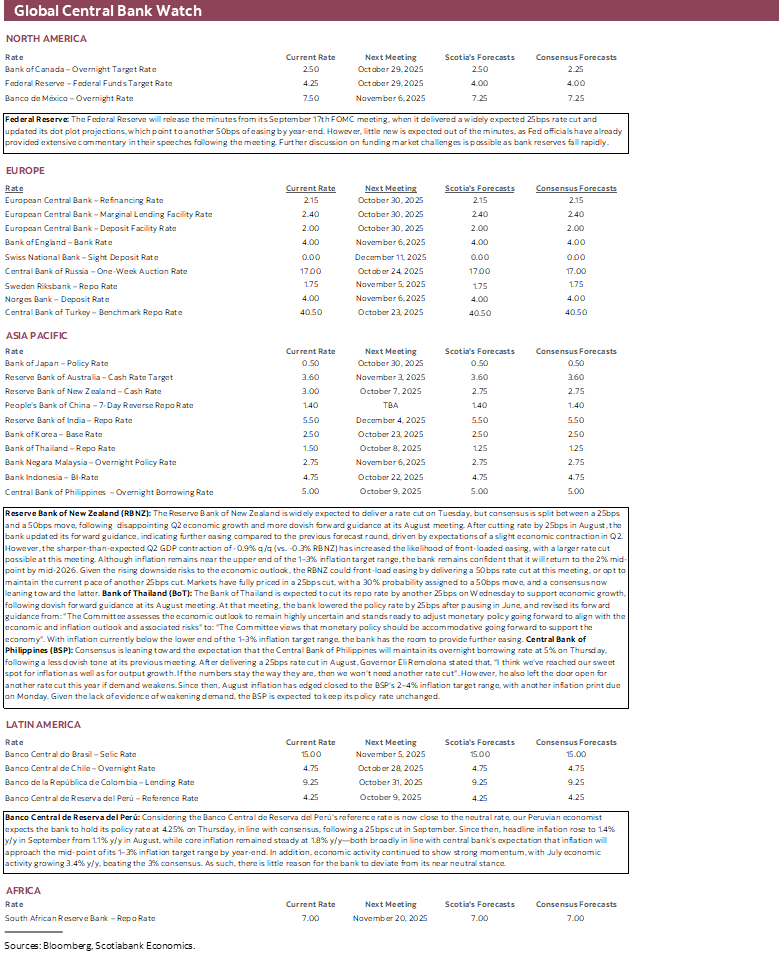
RBNZ—25 or 50?
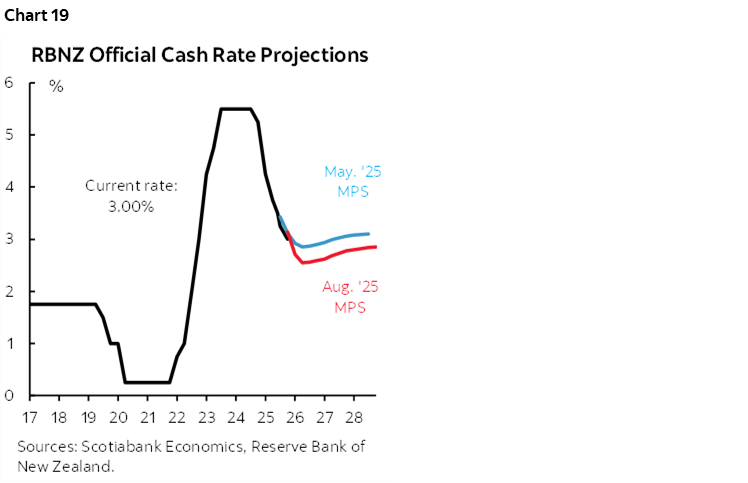
The Reserve Bank of New Zealand weighs in on Tuesday night (ET). Consensus is divided between a 25bps cut and double that amount with a slight leaning toward 25. Markets are also somewhat on the fence with about a third of a percentage point cut priced going in. Whatever they do, it may surprise one or the other camp. In this environment, the central bank may take a risk management approach toward which would be the nastier surprise; that may council upsizing.
Explicit forward guidance that was updated at the August meeting added to projected easing (chart 19). Since then, GDP shrank by -0.9% q/q SA nonannualized in Q2 which was materially weaker than consensus at -0.3% which was also the RBNZ’s forecast. A weakening economy that has registered no growth over the past year (-0.6% y/y) is opening up more disinflationary pressure which may allow the RBNZ to look through the fact that lagging inflation data remains above the 2% target at 2.7% y/y.
BCRP—Probably Done
Banco Central de Reserva del Perú offers another decision on Thursday. Most economists—including our Lima-based team—expect a hold with the policy reference rate held at 4.25%. Our house view is for an extended hold throughout the rest of this year and all of next.
Data since the September cut posted a mild acceleration of inflation to a still low 1.4% y/y and solid growth in a GDP proxy at 3.4% y/y (chart 20).
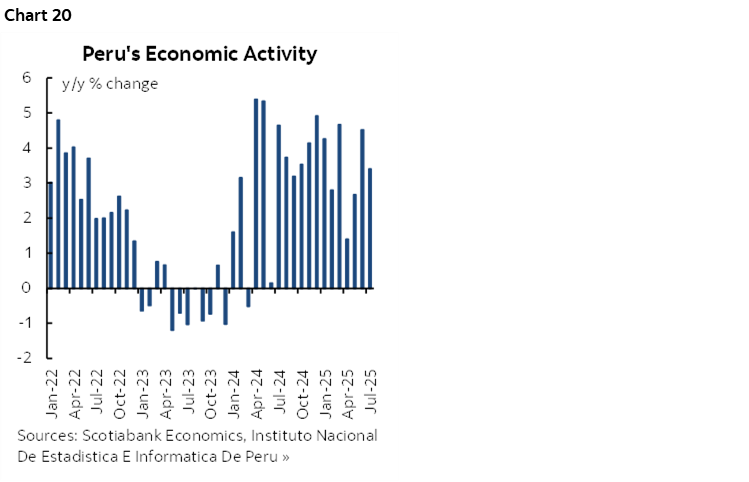
Given that BCRP was sounding like it was close to being done last month, the recent data might reinforce such a bias this week. Recall that the September BCRP statement said “With this decision, the interest rate is very close to its estimated neutral level. We forecast that inflation will be close to the centre of its target range around the end of the year.”
BSP—Done, Maybe
Bangko Sentral ng Pilipinas weighs in with another policy decision on Thursday. Consensus is somewhat divided with a majority expecting a hold at an overnight borrowing rate of 5% and a sizeable minority expecting a 25bps cut.
The hold camp is depending on guidance provided after the August cut when Governor Eli Remolona said "I think we've reached our sweet spot for inflation as well as for output growth. If the numbers stay the way they are, then we won't need another rate cut".
Remolona didn’t slam the door shut, however, and then August CPI picked up a bit to a still low 1.5% y/y. Another CPI update is due on Monday and could be influential.
Bank of Thailand—Down and Down
Most forecasters expect the Bank of Thailand to cut its benchmark rate by 25bps to 1.25% on Wednesday. A minority expect a hold, and one outlier thinks the BoT could upsize.
Key is that the bank adjusted forward guidance at its August meeting. Accompanying the cut at that meeting was guidance away from the relatively more circumspect remark that "The Committee assesses the economic outlook to remain highly uncertain and stands ready to adjust monetary policy going forward to align with the economic and inflation outlook and associated risks" to a more affirmative stance: "The Committee views that monetary policy should be accommodative going forward to support the economy".
GLOBAL MACRO—THIN GRUEL
Unless US nonfarm payrolls happen to get resurrected this week, the rest of the global line-up of indicator releases will have little else to offer beyond Canadian jobs.
The only notable US release may be the University of Michigan’s consumer sentiment gauge for October (Friday) including updated inflation expectations. Tuesday’s trade figures and Thursday’s jobless claims may not see the light of day given the shutdown.
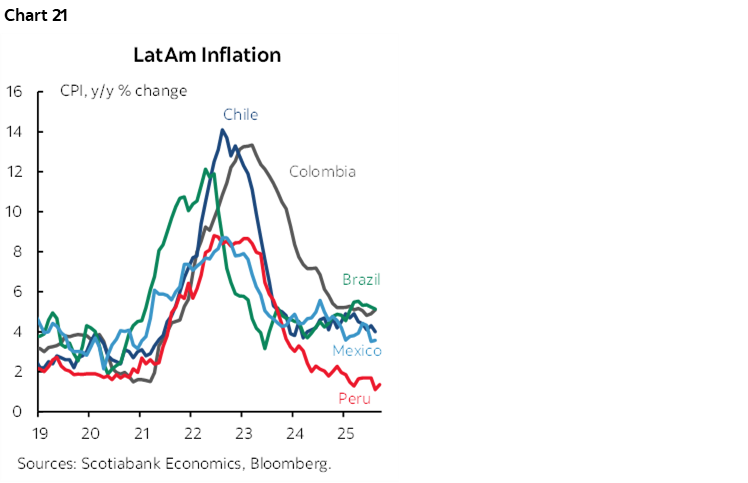
Various countries will update CPI figures for September with most of the focus upon releases out of Asia, Latin America (chart 21) and Nordic countries.
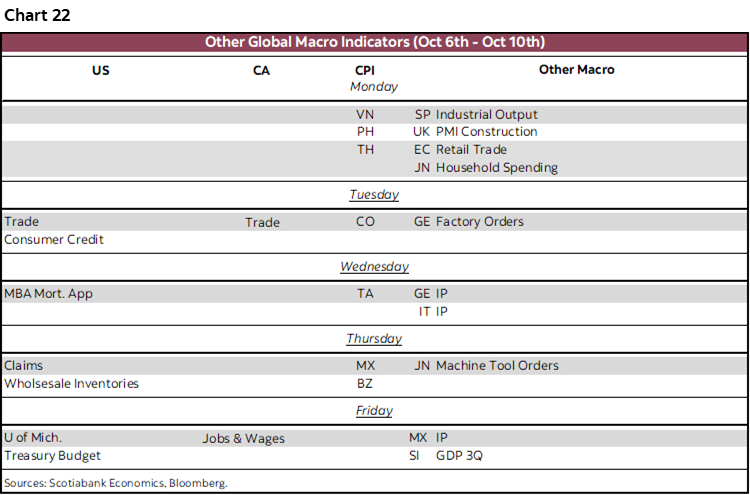
German factory orders and output and select Japanese indicators round out the calendar.
Chart 22 summarizes the main releases by day and country.
DISCLAIMER
This report has been prepared by Scotiabank Economics as a resource for the clients of Scotiabank. Opinions, estimates and projections contained herein are our own as of the date hereof and are subject to change without notice. The information and opinions contained herein have been compiled or arrived at from sources believed reliable but no representation or warranty, express or implied, is made as to their accuracy or completeness. Neither Scotiabank nor any of its officers, directors, partners, employees or affiliates accepts any liability whatsoever for any direct or consequential loss arising from any use of this report or its contents.
These reports are provided to you for informational purposes only. This report is not, and is not constructed as, an offer to sell or solicitation of any offer to buy any financial instrument, nor shall this report be construed as an opinion as to whether you should enter into any swap or trading strategy involving a swap or any other transaction. The information contained in this report is not intended to be, and does not constitute, a recommendation of a swap or trading strategy involving a swap within the meaning of U.S. Commodity Futures Trading Commission Regulation 23.434 and Appendix A thereto. This material is not intended to be individually tailored to your needs or characteristics and should not be viewed as a “call to action” or suggestion that you enter into a swap or trading strategy involving a swap or any other transaction. Scotiabank may engage in transactions in a manner inconsistent with the views discussed this report and may have positions, or be in the process of acquiring or disposing of positions, referred to in this report.
Scotiabank, its affiliates and any of their respective officers, directors and employees may from time to time take positions in currencies, act as managers, co-managers or underwriters of a public offering or act as principals or agents, deal in, own or act as market makers or advisors, brokers or commercial and/or investment bankers in relation to securities or related derivatives. As a result of these actions, Scotiabank may receive remuneration. All Scotiabank products and services are subject to the terms of applicable agreements and local regulations. Officers, directors and employees of Scotiabank and its affiliates may serve as directors of corporations.
Any securities discussed in this report may not be suitable for all investors. Scotiabank recommends that investors independently evaluate any issuer and security discussed in this report, and consult with any advisors they deem necessary prior to making any investment.
This report and all information, opinions and conclusions contained in it are protected by copyright. This information may not be reproduced without the prior express written consent of Scotiabank.
™ Trademark of The Bank of Nova Scotia. Used under license, where applicable.
Scotiabank, together with “Global Banking and Markets”, is a marketing name for the global corporate and investment banking and capital markets businesses of The Bank of Nova Scotia and certain of its affiliates in the countries where they operate, including; Scotiabank Europe plc; Scotiabank (Ireland) Designated Activity Company; Scotiabank Inverlat S.A., Institución de Banca Múltiple, Grupo Financiero Scotiabank Inverlat, Scotia Inverlat Casa de Bolsa, S.A. de C.V., Grupo Financiero Scotiabank Inverlat, Scotia Inverlat Derivados S.A. de C.V. – all members of the Scotiabank group and authorized users of the Scotiabank mark. The Bank of Nova Scotia is incorporated in Canada with limited liability and is authorised and regulated by the Office of the Superintendent of Financial Institutions Canada. The Bank of Nova Scotia is authorized by the UK Prudential Regulation Authority and is subject to regulation by the UK Financial Conduct Authority and limited regulation by the UK Prudential Regulation Authority. Details about the extent of The Bank of Nova Scotia's regulation by the UK Prudential Regulation Authority are available from us on request. Scotiabank Europe plc is authorized by the UK Prudential Regulation Authority and regulated by the UK Financial Conduct Authority and the UK Prudential Regulation Authority.
Scotiabank Inverlat, S.A., Scotia Inverlat Casa de Bolsa, S.A. de C.V, Grupo Financiero Scotiabank Inverlat, and Scotia Inverlat Derivados, S.A. de C.V., are each authorized and regulated by the Mexican financial authorities.
Not all products and services are offered in all jurisdictions. Services described are available in jurisdictions where permitted by law.