Next Week's Risk Dashboard
- US-China trade tensions escalate
- Another US earnings seasons kicks off…
- …that could further inform macro debates
- US stocks are richly priced by any measure
- Investment in the US is thriving — despite Trump
- Previewing delayed US CPI
- The folly of budget forecasting in Canada and the US
- Deficits matter — and don’t take Canada’s AAA for granted
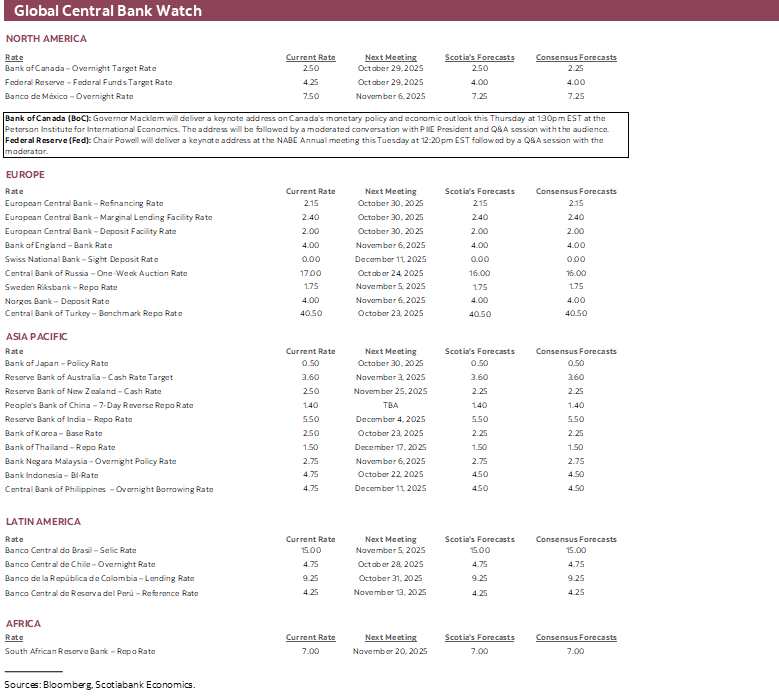
- Fed’s Powell to update perspectives sans data
- BoC’s Macklem takes the fight to Washington
- Australia’s softening job market set for an update
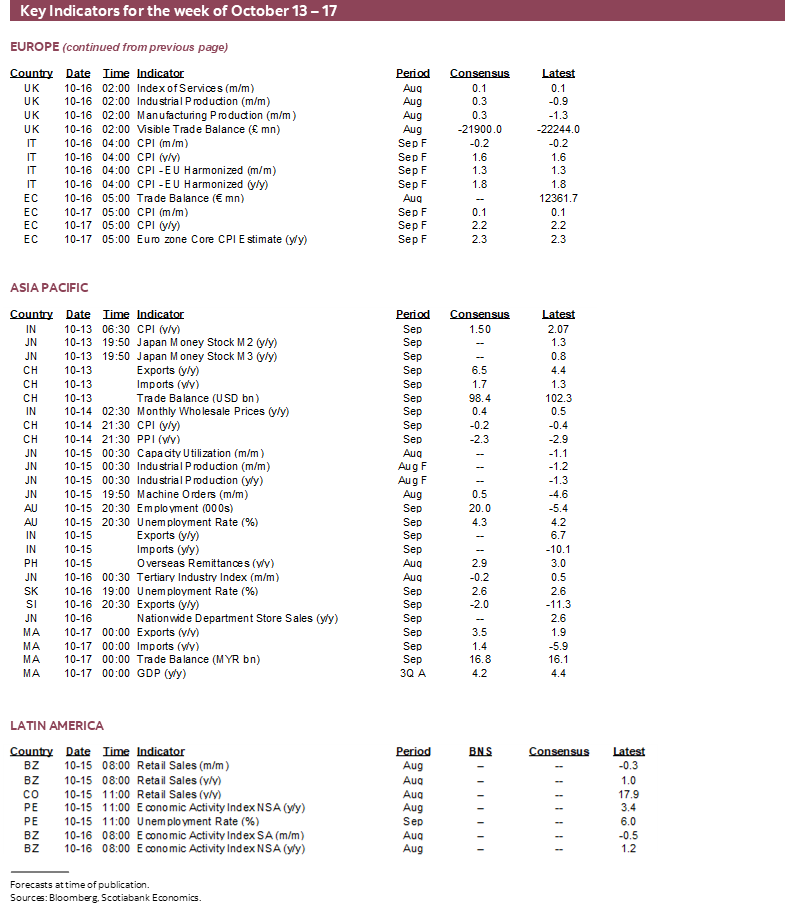
- UK data dump to focus on jobs
- Slow regulatory change is holding back Canadian financial innovation
- Global macro
- Canadian markets shut Monday for Thanksgiving
Chart of the Week
Canadians will enjoy their Thanksgiving gatherings this weekend. It’s an important time to be thankful during trying times in the world. The hope is that they don’t return with indigestion on Tuesday morning although expect raspy voices after cheering on their Blue Jays.
With the US government in a protracted shutdown, President Trump’s renewed threats (here and here) against China—including a dramatic escalation of tariffs—sideswiped global equities to end this past week with Asia poised to catch up on Monday. The threat of 100% tariffs against China requires details and an executive order but risks ‘Liberation Day’ redux.
Further developments on these fronts—and China’s possible reaction—will layer on top of a heavy week of coming developments as the upside to the shutdown is that I’m not sure we could have also handled US data on top of it all. The US earnings season commences in earnest. We’ll be treated to lengthy appearances by both Federal Reserve Chair Powell and Bank of Canada Governor Macklem. US CPI won’t arrive on Tuesday as planned, but I’ve offered a preview for when it is to be released later this month. Canada’s federal budget is entering the window in which to expect more expedited advance announcements of its contents given the ages old practice of avoiding too many surprises on game day. Job markets in the UK and Australia are poised for updates.
This edition also explores what is driving a surge of US investment, the folly of forecasting Canadian deficits, and why Ottawa needs to act faster on financial regs lest Canada keep falling further behind the US, UK and others in what could be a disservice to the international competitiveness of the Canadian banks and broader financial services landscape.
US EARNINGS SEASON—INFORMING MACRO DEBATES
Absent data, markets will be more influenced by US corporate earnings. The Q3 earnings season unfolds in earnest this week when thirty-six S&P 500 firms will release. The usual early-season focus will be upon financials. The season could inform several macro debates.
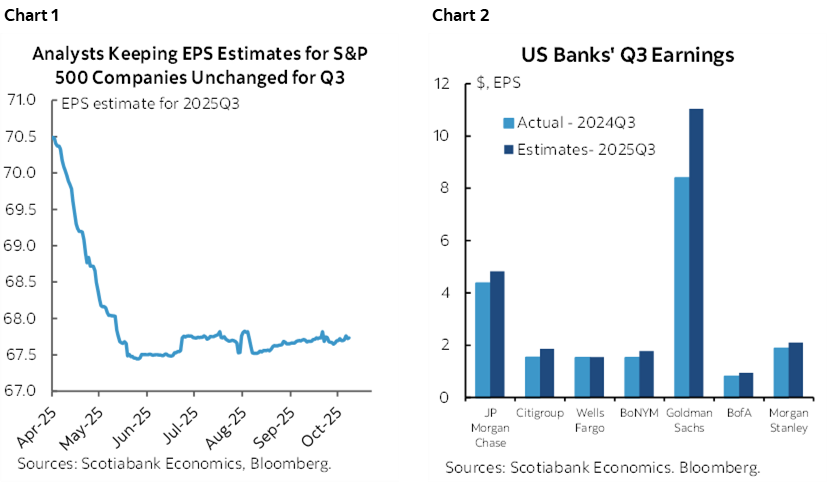
Among the key names, Blackrock, Wells Fargo, JP Morgan Chase, Goldman Sachs and Citigroup get it all started with a bang on Tuesday. BofA and Morgan Stanley follow the next day.
Chart 1 shows that analysts have held to relatively stable EPS estimates for the overall index. Chart 2 depicts the analyst consensus for EPS this season compared to the same quarter last year since these are not seasonally adjusted figures. In all cases, performance is expected to be at least on par with last year and in some cases materially higher.
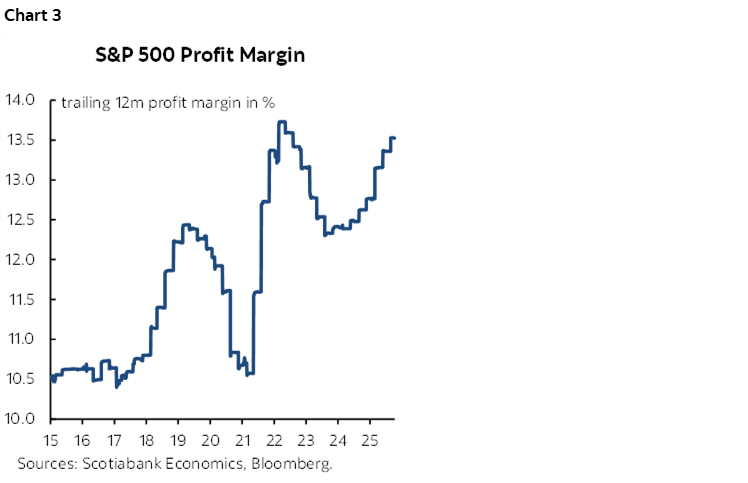
One key will be whether the broader S&P 500 universe will suffer any margin erosion from elevated heights (chart 3). A possible reason could be eating supply chain cost pressures including but not limited to tariffs at least as a first-round response, versus whether productivity and cost controls including reduced hiring may be offsetting.
Another key will be evaluating and controlling for surging cap-ex on AI. See the next section for more about this.
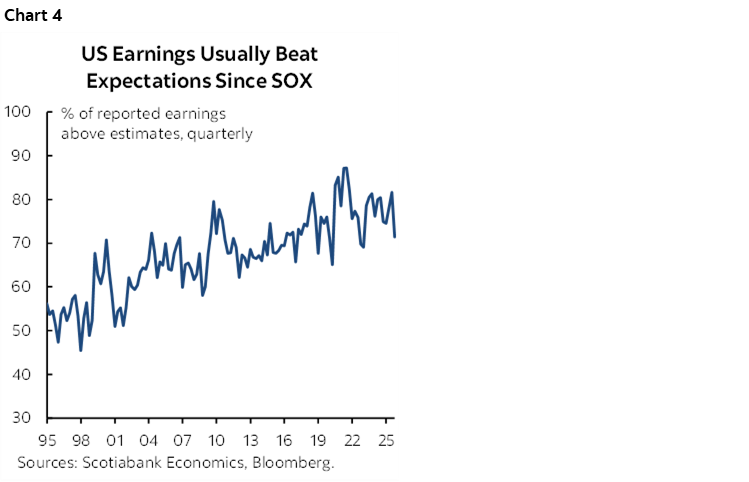
There isn’t much room for potential disappointment notwithstanding the fact that earnings usually beat analyst expectations particularly since SOX legislation and the post-dot-com period (chart 4).
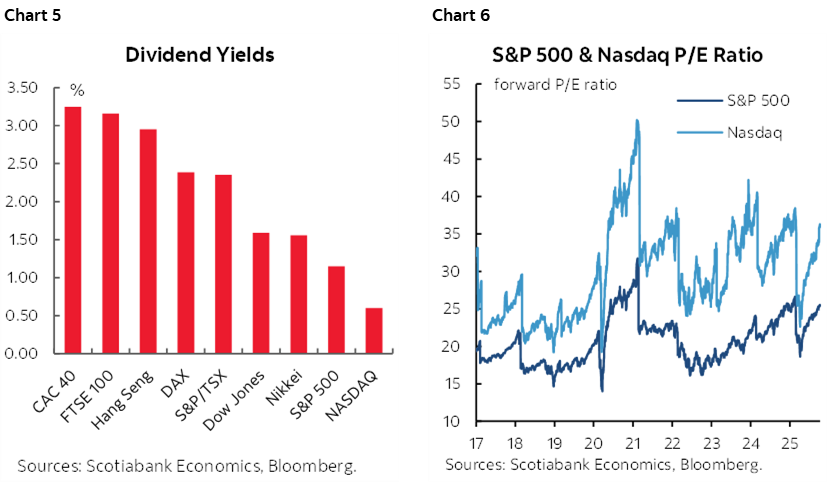
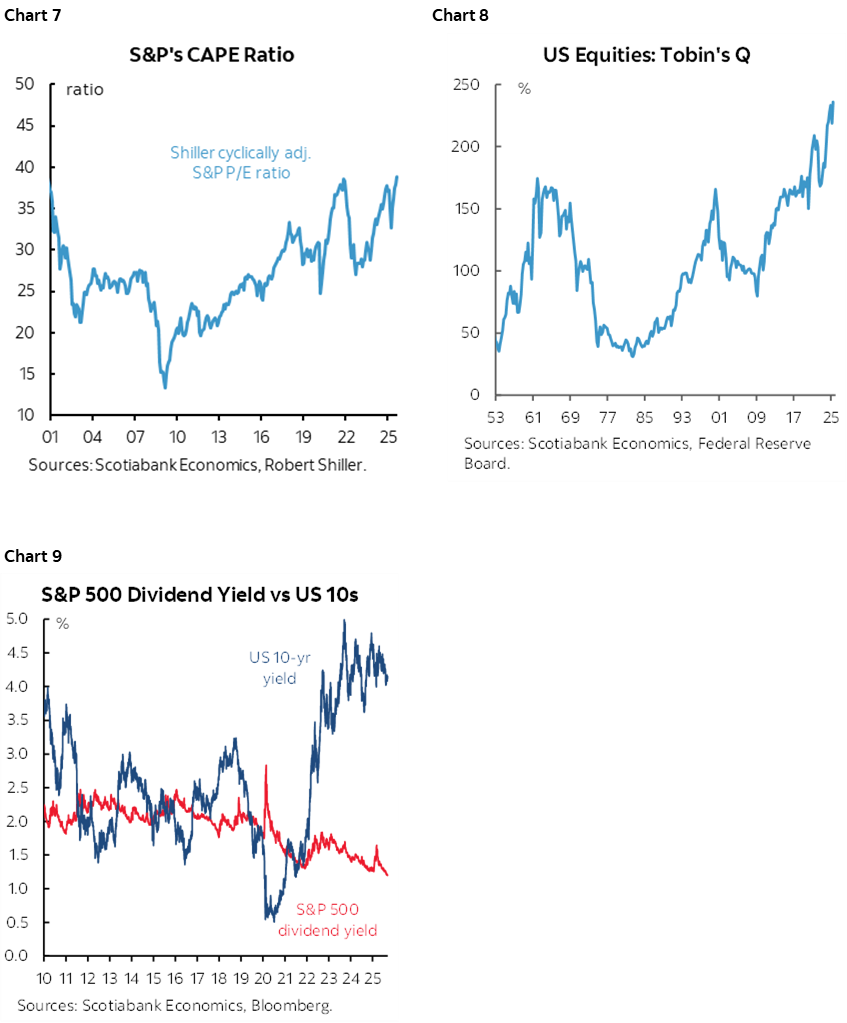
US stock dividend yields are among the lowest (chart 5). Forward p/e ratios are among the highest (chart 6). Other valuation measures are shown in charts 7–9 including Shiller’s CAPE, Tobin’s Q (price to replacement cost) and the Graham & Dodd (sometimes called Fed) approach comparing the US 10-year yield to the S&P dividend yield.
US INVESTMENT IS ACCELERATING—DESPITE TRUMP
As we go through the earnings season, investors need to be careful to evaluate underlying quarterly earnings momentum including and excluding the effects of such massive investments. These massive investments are being made on the hope they will bear untold fortunes in future while heavily absorbing cash flow now. The issue also opens an opportunity to revisit a macroeconomic debate about what’s causing the investment surge in the US.
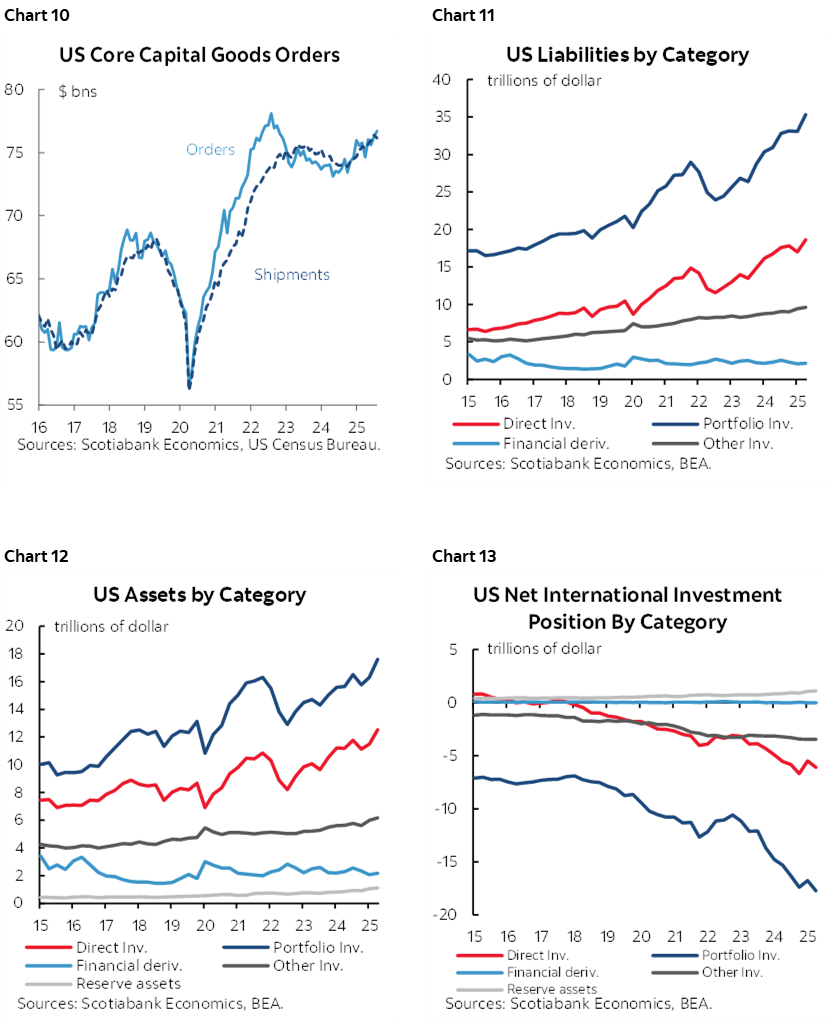
First the facts. Investment is picking up. We see that in core capital goods orders ex-defence and air (chart 10). We see it in a faster rate of growth in direct investment into the US that count as liabilities of the US economy (chart 11) than out of it (chart 12) and the net (chart 13). We also see the same thing in terms of portfolio flows that are shown in the same charts. This perversely makes it more challenging to balance the current account which only highlights that a deficit isn’t necessarily a bad thing while nevertheless running the risk that Trump won’t see it that way and may keep digging deeper on protectionism.
Trump claims that surging investment is all because of him. His fortress America approach to building a tariff wall is driving a massive need to investment behind the wall or to be shut out.
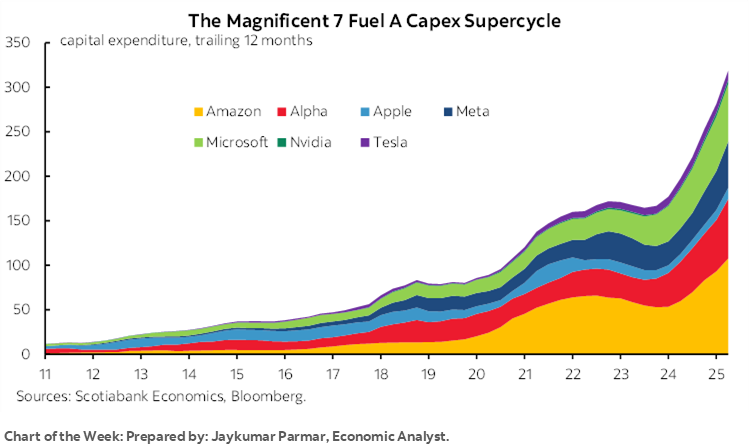
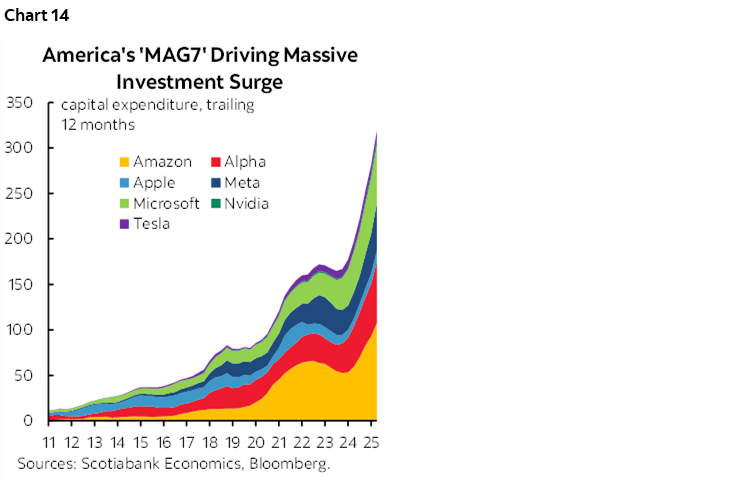
The more likely dominant factor is that the US is a hotbed of tech innovation and specifically AI-driven investment. Check out just a sample of that by way of the investment being driven by the so-called ‘Mag7’ (chart 14). They are investing about $300 billion at an annualized rate on a 12-month trailing basis to smooth the noise. That’s about double what it was only about eighteen months ago, and they are just a small subset of it all. They’re obviously among the leaders, but how much is being spent by banks may be further revealed this week. Then add investment by other sectors of the economy that could also impair short-term earnings but add many multiples to what the Mag7 are doing. Even (some) of your boring utilities are suddenly sexy again because of the enormous power generation requirements over time. With such ‘real’ investment go foreign portfolio inflows to hitch a ride on the expectation of future profits.
There is also still the debate over whether some of this surge—like the AI component—is good for jobs and hence consumers as one contributor to weaker payrolls. I’m no Luddite, but we can’t be oblivious toward the risk that at least in the short-term, such rapid technological change and adoption can be highly disruptive. It can cost jobs by driving a renewed productivity miracle. In the longer run this could be very positive for the US economy. In the shorter run, it’s possible that what’s good for investment is not good for jobs and consumption. As such, be careful with macro theses that take the investment boom and automatically extrapolate wonderful things for the rest of the economy.
And there are offsets to Trumponomics. Basic economics would say tariff walls ultimately harm growth. Ditto for highly restrictive immigration policy. Reinventing supply chains in the US could well be doing so into higher cost structures with higher inflation risk, less Fed easing, etc. It’s early innings for all of this because most of the tariff ‘deals’ only really kicked in a few weeks ago.
US INFLATION—WAITING FOR LOW QUALITY DATA
US CPI for September will not be released on Tuesday as per the original schedule. The Bureau of Labor Statistics has committed to delivering the figures on Friday October 24th in order to meet the requirement of having full Q3 data for purposes of setting cost of living estimates by the Social Security Administration for the coming year.
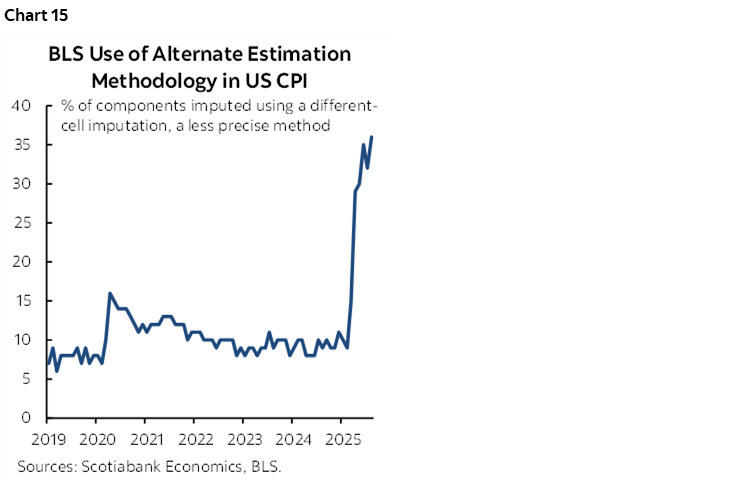
The serious issues over data quality might have many of our clients perfectly content with the Bureau of Labour Statistics taking its time to get it right. A record share of over one-third of the CPI basket is now being estimated with alternative methods rather than hard data (chart 15). Budget cuts and sampling issues have substituted toward using proxy methods like prices in other parts of the US for missing markets, or alternative product prices.
Accordingly, I’ll keep it brief for now until we have a bit more clarity on release timing. My estimates are for a rise of 0.3% m/m SA in both total CPI and core CPI excluding energy and food. That would translate into about 3.1% y/y for both gauges.
Here are a few supporting points:
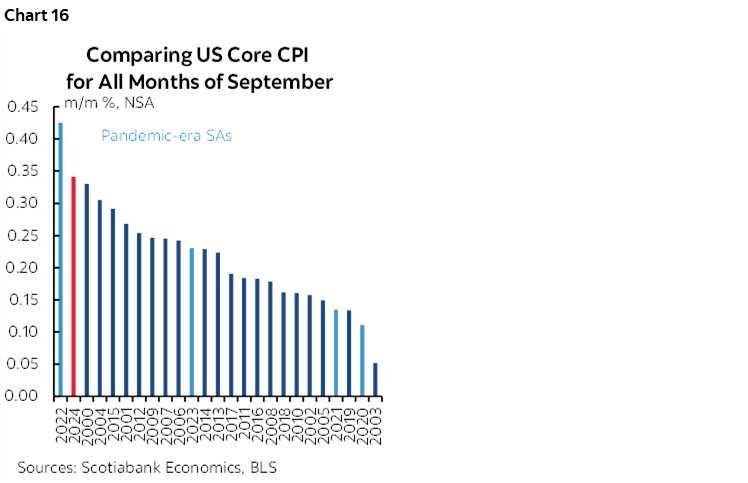
- September is normally a significant up-month for seasonally unadjusted prices (chart 16). My estimate this time is between 0.1% and 0.2% m/m NSA based on arguments below.
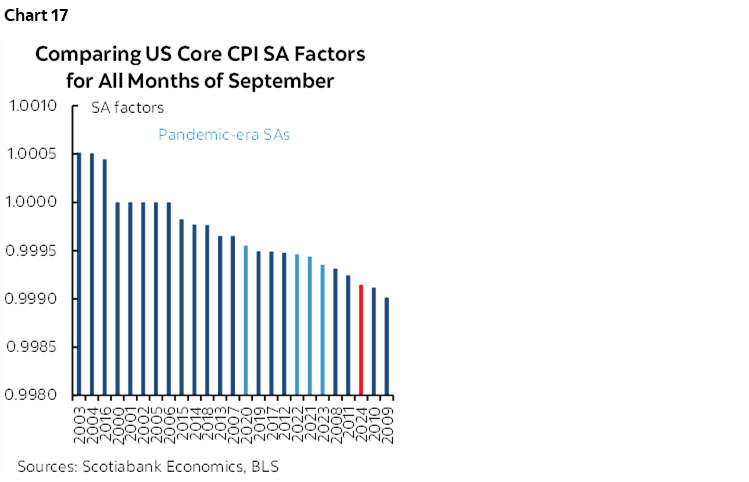
- September’s seasonal adjustment factor therefore seeks to mildly tamp down such seasonality with readings below 1.0 (chart 17). Recent years have utilized SA factors on the low side of history but that may be starting to change. August’s core CPI SA factor, for instance, was the highest in the pandemic and post-pandemic era. A possible reason is that X12A seasonal adjustment processes are taking in more data outside of the pandemic and when coupled with the recency bias to their calculations we’re getting SA factors less distorted by the wild swings in the pandemic. To be conservative I’ve assumed that this year’s SA factor will match last year’s but it could easily come in higher which would tamp down a little less of the seasonally unadjusted rise in core prices.
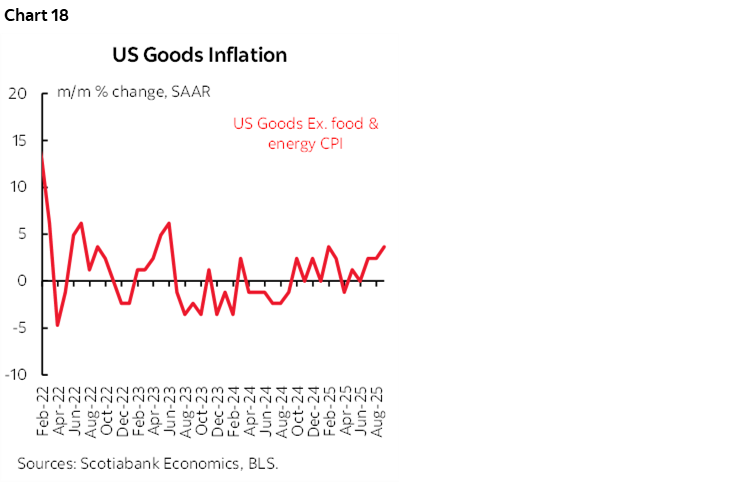
- Core goods price inflation is expected to continue to rise partly as a reflection of supply chain pressures including but not limited to tariff effects (chart 18).
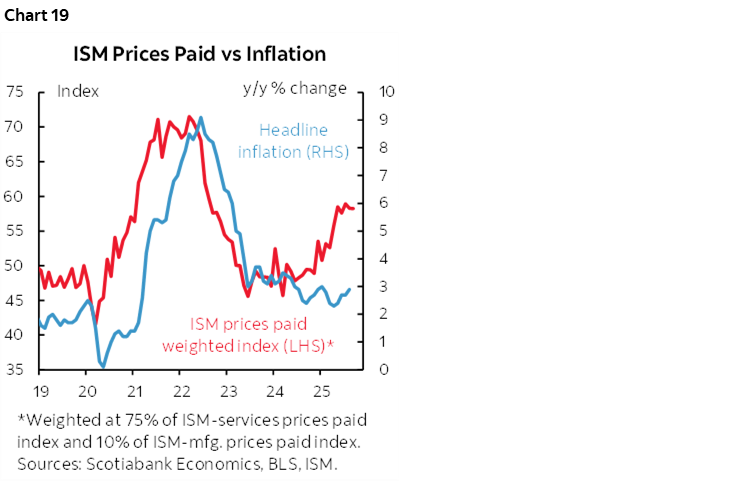
- to this last point, gauges like ISM-prices indicate that purchasing managers are reporting rising price pressures and further lagging historical correlations likely lie ahead (chart 19).
- A caveat to this is last point is clearly timing it. The first-round response to price pressures is being marked by cost containment across US businesses as tracking of Q3 labour productivity growth is strong while the job market continues to weaken. Relatively wide profit margins can contain pass-through of supply chain pressures, until shareholders pressure boards and management to share the pain. Eventually inventories stockpiled at lower pre-tariff prices will work their way through the system.
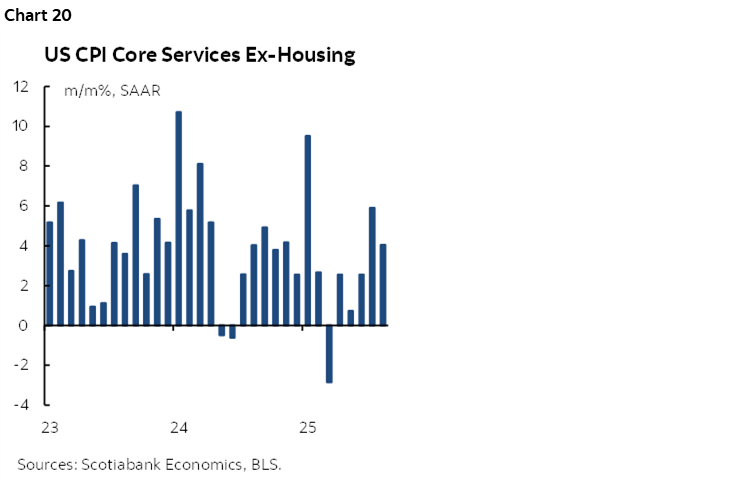
- Core services inflation (ex-energy services and housing) is assumed to remain warm (chart 20).
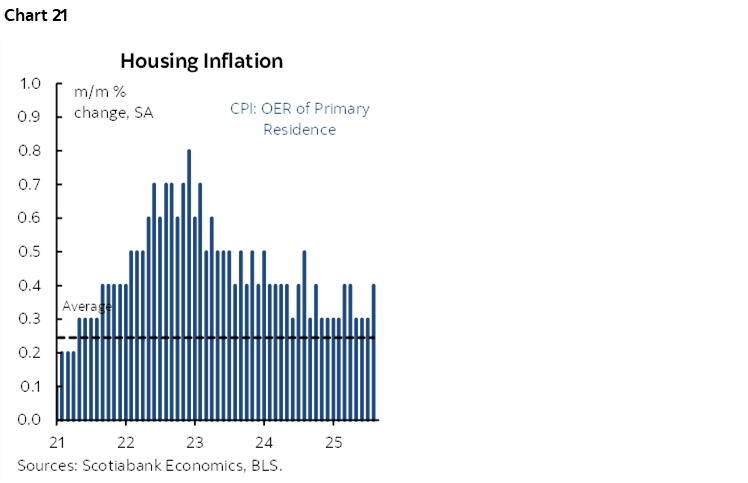
- OER and primary rent inflation have both cooled sharply from their peaks but I’m assuming an extension of the relatively sticky recent pattern (chart 21).
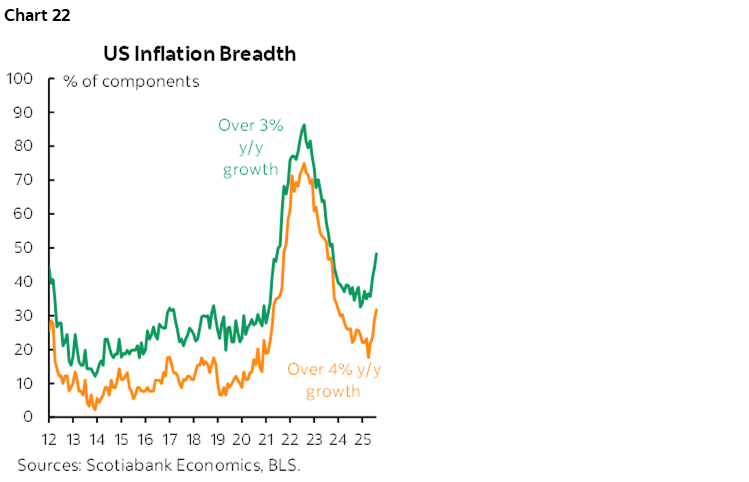
- Also watch the breadth of price increases which has been on the rise (chart 22).
- the Cleveland Fed’s ‘nowcast’ calls for 0.4% m/m SA total CPI and 0.3% for core which matches consensus notwithstanding the very limited readings that go into the Cleveland gauge.
CANADIAN DEFICITS—FORECASTING FOLLIES
Canada’s federal budget is about three weeks away on Tuesday November 4th. A whole cottage industry that exists around the Canadian fiscal scene is beavering away at estimates of deficits, funding requirements and the plans behind them years into the future.
It's a largely fruitless exercise and here's why.
First, even Ottawa can’t forecast its own budgetary balance. Enter chart 23. The dashed grey lines show projections for the budget balance drawn from annual budgets all the way back to the 1980s. The thick red line is how the actual balance evolved. Through various administrations of both main political parties, the projections often entirely miss inflection points and are off by very large amounts.
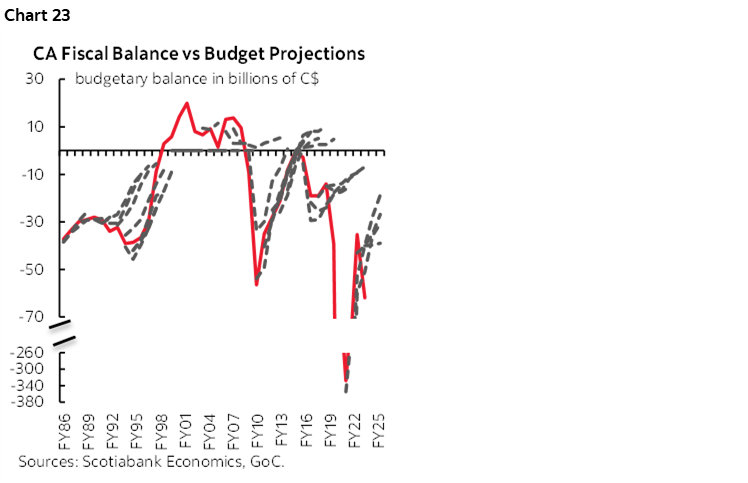
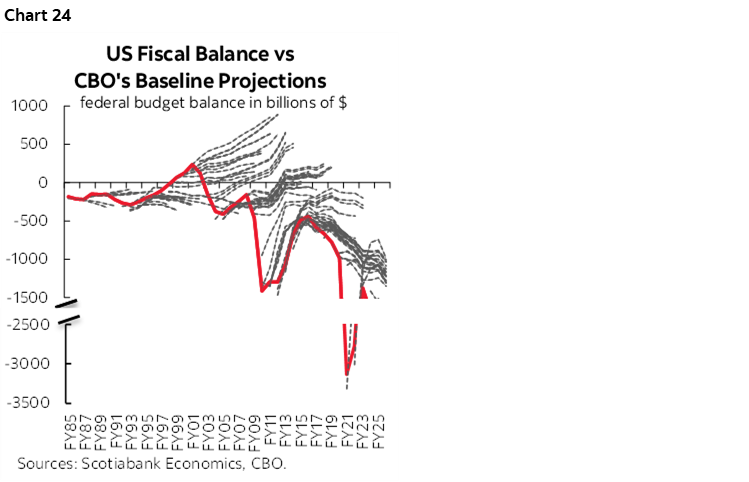
That’s true not only in exigent circumstances. Take the latter half of the 1980s (Conservatives) or the latter half of the 2010s (Liberals) for examples. It’s also not just true of Canada; chart 24 does the same for the CBO’s projections in the US which is supposed to provide projections independent of the administration.
Second, even relatively more ‘normal’ times involve at least four forms of high uncertainty around the projections. One is the usual difficulty forecasting macro conditions years into the future. Two is translating that into budget sensitivities. Three is that plans can change along the way. Fourth is that shocks can emerge.
A third reason is that forecasting budgetary balances today is especially fraught with uncertainty because of the nature of the government’s plans. That's not just because we don't have much of anything concrete to go by. It's also because of the very nature of what may be coming.
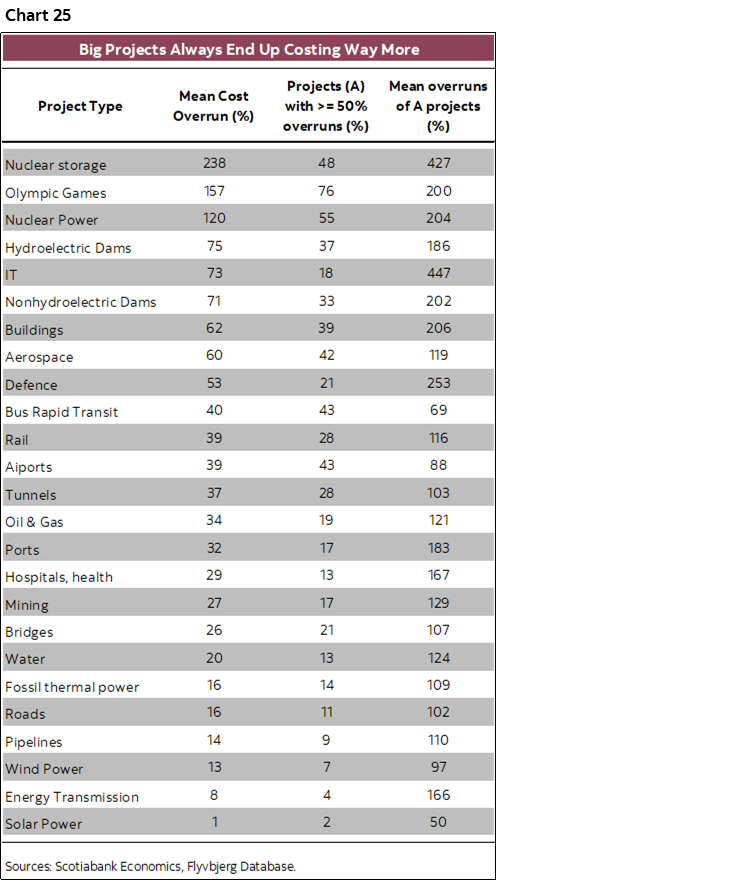
On this point I’m referring to the high stakes around targeting infrastructure and defence spending in what is likely to be a capital-heavy upcoming budget. Such spending is notorious for major cost overruns and delays. This is true at the global level (chart 25). It is especially true in Canada given serial mismanagement of mega projects and the country’s poor management of procurement programs. It’s unclear whether a new layer of bureaucracy to manage these programs on the defence side will improve things. Frankly, defence and infrastructure firms are licking their chops, salivating over the potential to dip heavily into taxpayers’ pockets and luring them along with escalating commitments. The ‘Golden Dome’ is one example with wild variations in estimated costs for a fallible and unproven technology in an era when if you really wanted to attack NYC or Toronto or Washington, then modern warfare would be more likely to do it by just launching drones off barges in the harbour or a skiff in the Potomac!
Canada's stated goal of raising defence and (loosely) related security spending toward 5% of GDP by 2035 needs to be laid out. One approach is to assume a gradual linear path to this target that would require $1–1½ trillion to be spent over ten years. Will that come at the expense of core programs, higher taxes or bigger deficits?
So where does it all leave us? I’ve been warning about above-consensus estimates for deficits all year long and watched consensus move higher. The numbers we’ll get on November 4th will merely start the debate as the plans evolve and the costs get revised.
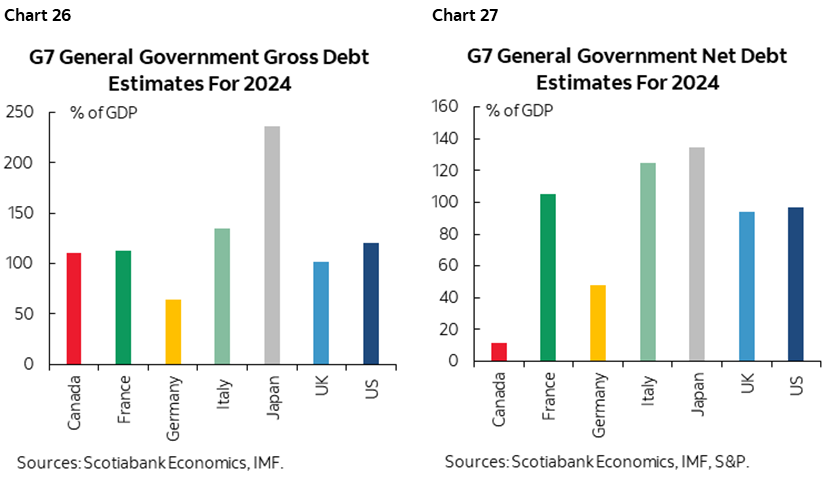
Most disturbing is the consensus that deficits don’t matter. Credit ratings are not issued on an assessment of fiscal health relative to other more poorly managed fiscal positions of other countries; they are independent estimates of that country’s own position and outlook. AAA is not assured. Lose it, and the domino effects impact every other credit sector. Lose it, and some types of ratings-constrained investors can’t buy Canada. Canada is no lightweight in general government gross debt to GDP (chart 26) and net debt to gdp (chart 27) includes largely inaccessible financial assets in sinking funds, government pensions and sovereign wealth funds.
It's also important to be aware of the global context. We're in an environment of rolling shocks to global sovereign credentials markets with little tolerance for experimentation. Ask the UK from the Truss administration to the pressures on the Starmer government's upcoming budget. Ask France which is politically paralyzed by the inability to deliver credible fiscal and broader policy reforms. Ask the US after 'Liberation Day'. Ask Japan that benefits from a closed bond market but where political dysfunction and high debt continue to drive instability.
The difference for Canada is that global market participants don't spend a whole lot of time on 2% of their portfolios at about a market weight. Global bond portfolio managers won't outperform on such a market and may not see the attractive risk-reward trade-off to figuring out what's going on. Inflame deficits? Ramp up spending in areas notorious for massive cost overruns? Do so in an environment of mounting risks to the global and Canadian economies with looming trade negotiations and Quebec's election a year from now that risks bringing back separatists? The answer to limited upside and complicated uncertainties could be simply to sell.
GLOBAL MACRO
The US data calendar is held up, but the rest of the world will continue to provide updated assessments. In some cases—like global trade data—the US shutdown could impair statistics.
Canada—Macklem and Light Data
Canadian markets will start the week shut for Thanksgiving on Monday.
BoC Governor Macklem takes the fight straight into Washington on Thursday. He will be interviewed by Adam Posen at the Peterson Institute for International Economics from 1:30pm–2:15pmET. Macklem is to deliver unpublished opening remarks before the discussion and then address audience Q&A. The loosely defined topic is Canada’s monetary policy and economic outlook with perspectives on trade and financial stability. Expect the US-driven trade war to figure prominently.
Canada also releases second- and third-tier macro updates. Existing home sales have been on a four-month winning streak with September’s update due on Wednesday. Manufacturing shipments and wholesale trade (both Wednesday) are likely to fall by over 1% m/m SA based on advance guidance from Statcan for the month of August. Housing starts in September (Thursday) will inform whether the pull-back to a still respectable 246k SAAR level in August was the start of a new trend or not, following four months of readings closer to 300k.
US—Powell in a Sea of Missing Data
Fed-speak will complement earnings as the week’s main macro developments as several more data releases will be delayed by the government shutdown.
Chair Powell speaks on Tuesday over lunch at an economists’ gathering (here). A speech will be followed by a moderated discussion. It’s difficult to imagine anything new being said, partly since we have very little new data to go by given the shutdown. Private labour market readings often don’t line-up with the Fed’s preferred nonfarm payrolls measure but they’ve indicated weakness. Expect Powell to repeat that he expects tariffs to be a temporary upward source of pressure on inflation and is more concerned about downside risks to the job market. Also watch to see if he refreshes an assessment of funding markets given how rapidly reserves have fallen since the limited discussion that was revealed in minutes to the FOMC’s September meeting.
Data we would have gotten this week if not for the shutdown will add to a future deluge when they catch up. Retail sales during September, producer prices in September and claims were supposed to come on Thursday. Friday was supposed to reveal housing starts. Estimates for these readings are still provided in our data tables at the back of this publication.
Other releases will still be available such as NFIB small business measures (Tuesday), the NY Fed’s Empire manufacturing report for October (Wednesday), the Fed’s Beige Book (Wednesday), the NAHB homebuilder confidence readings for October (Thursday) and the Fed’s industrial output and capacity utilization in September (Friday).
UK—Unemployment on the Rise
By Thursday, UK market participants will have a better idea of how the overall economy and labour market are performing.
The economy has been flat or shrunk in three of the past four months with August GDP expected to be soft (Thursday). An indicator of service sector activity is expected to be mildly resilient, with downside risk mainly focused on industrial output and volatile trade.
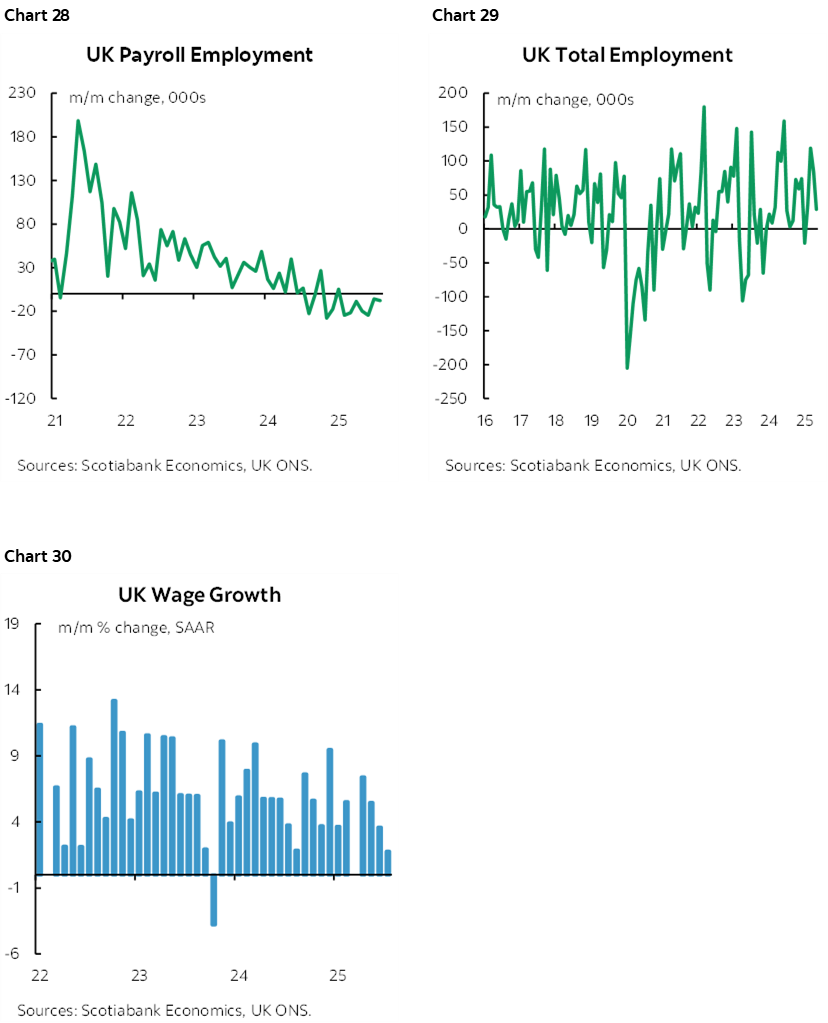
Key, however, will be labour market readings on Tuesday. Payroll jobs have been falling every month since February (chart 28), but total employment has been resilient (chart 29). Nascent signs of softening wage growth may be encouraging to the Bank of England (chart 30) as modest slack builds but with labour productivity growth still weak.
Australia—A Softening Job Market
In Australia, the spotlight this week will be on the September jobs report due on Wednesday and Jay Parmar shares his thoughts here. This will be the final jobs release before the RBA meets on November 4th. While the data will be helpful to understand the balance in labour market, its impact on a potential rate cut will likely hinge on the extent of any downside surprise.
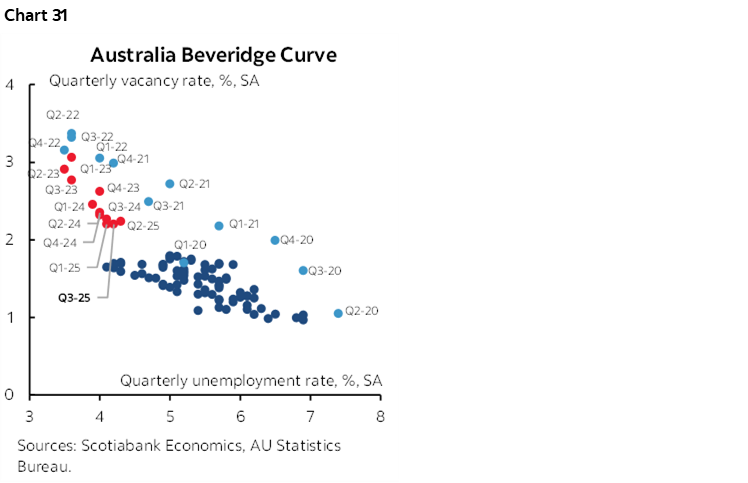
Australian labour market conditions have softened in recent months, moving toward a more balanced state in a Beveridge Curve sense (chart 31). Job vacancies have been steadily declining from elevated levels, while the unemployment rate has edged up to 4.2%—above the post-pandemic lows of 3.4%, but still below the pre-covid average of around 5%. Job gains have shown limited momentum, with three of the past four months registering flat outcomes. September is likely to reflect continued softness.
Wage growth, last recorded at an annualized rate above 3% in Q2, remains a key variable—especially as weak productivity growth continues to drive up unit labour cost. However, the Q3 data won't be available until November 18.
Given the RBA's dual mandate of achieving price stability and full employment, and its recent observation "that private demand is recovering, indications that inflation may be persistent in some areas and labour market conditions overall remaining stable" Q3 CPI report due on October 28 is likely to carry more weight in shaping the November decision.
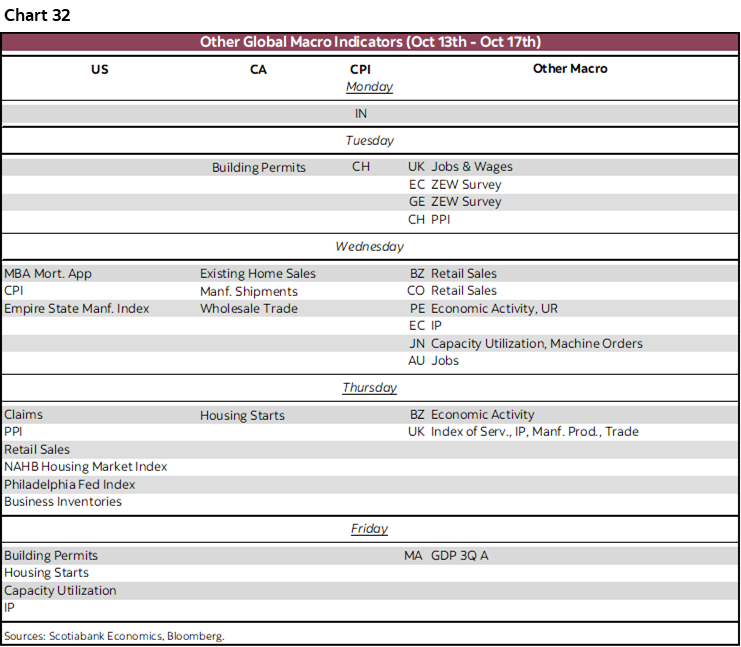
Other global releases are highlighted in chart 32 and will be written about over the course of the week.
OTTAWA IS FALLING BEHIND THE US ON FINREGS
BoC Senior DepGov Rogers’ speech this past week had good and bad elements to it in my opinion.
The good—speaking as an economist—is that it reinforced overdue efforts by Ottawa to embrace open banking and real time payments systems. Being true to my training, the economy is well served by things like more choice and faster payments. The fruits can benefit both established and new players in a rising-tide-lifts-all-boats way of thinking about it. It’s time Ottawa got onto what it has been talking about for many years—in some cases almost a decade—while other countries have blown past by actually implementing the talk starting years ago. That’s a shortcoming by way of the slow speed of regulatory change in Canada.
One might add to this the slowness in other regulatory developments. I was down in Houston earlier this week and one of the events involved my moderation of a superb panel of three folks. The topics were wide ranging but payments system innovation and technological innovation in financial services were the biggest areas of focus as we had excellent panellists with a strong grasp of the content.
The US is way ahead on these issues including important matters like stablecoin (cybercurrency backed by fiat money). Canada is lagging and this isn’t even appearing in the vernacular of the country’s top policy officials. I’m not holding my breath for something like the GENIUS act here any time soon.
But where the rub really comes in was through Rogers’ casual empiricism toward frankly besmirching the Canadian banking sector. She lamented that oligopolies have little incentive to invest, without quoting the mammoth amounts that Canadian banks do actually invest. She quoted bank concentration figures without including the important role of nonbanks like credit unions, insurers, etc in the provision of credit. Rogers failed to provide empirical evidence of a lack of competition such as international—and particularly Canada-US—comparisons of things like loan spreads and fees. From what I recall—and in fairness it’s been some time since I’ve delved into it—Canada stands up rather well on such measures and generally far better than the US.
She also quoted high concentration in Canadian banking, but made zero effort to properly define the market either geographically or beyond just banking and into broader financial service providers. At the local market level, the US banking system is more concentrated than Canada’s due to the historical restrictions against interstate banking and branching that started to be chipped away in the 1970s and more aggressively by Riegle-Neal in 1994 but the US still has far too many unit banks and far too many undiversified banks with highly localized branches. Hence why the US banking system stumbles into crises about every decade or so.
So fm2c, Rogers would have delivered a better speech had she indicated that Ottawa is cracking the whip on itself to get on with regulatory change. Build upon the pride that hundreds of thousands of workers in the banking sector in Canada that waves the flag across the world have in their careers. Change the regulatory framework, and banks and other players in the financial system will adapt accordingly, but they can’t do it without Ottawa’s leadership that too often waits for the US to act and then acts years later if at all.

DISCLAIMER
This report has been prepared by Scotiabank Economics as a resource for the clients of Scotiabank. Opinions, estimates and projections contained herein are our own as of the date hereof and are subject to change without notice. The information and opinions contained herein have been compiled or arrived at from sources believed reliable but no representation or warranty, express or implied, is made as to their accuracy or completeness. Neither Scotiabank nor any of its officers, directors, partners, employees or affiliates accepts any liability whatsoever for any direct or consequential loss arising from any use of this report or its contents.
These reports are provided to you for informational purposes only. This report is not, and is not constructed as, an offer to sell or solicitation of any offer to buy any financial instrument, nor shall this report be construed as an opinion as to whether you should enter into any swap or trading strategy involving a swap or any other transaction. The information contained in this report is not intended to be, and does not constitute, a recommendation of a swap or trading strategy involving a swap within the meaning of U.S. Commodity Futures Trading Commission Regulation 23.434 and Appendix A thereto. This material is not intended to be individually tailored to your needs or characteristics and should not be viewed as a “call to action” or suggestion that you enter into a swap or trading strategy involving a swap or any other transaction. Scotiabank may engage in transactions in a manner inconsistent with the views discussed this report and may have positions, or be in the process of acquiring or disposing of positions, referred to in this report.
Scotiabank, its affiliates and any of their respective officers, directors and employees may from time to time take positions in currencies, act as managers, co-managers or underwriters of a public offering or act as principals or agents, deal in, own or act as market makers or advisors, brokers or commercial and/or investment bankers in relation to securities or related derivatives. As a result of these actions, Scotiabank may receive remuneration. All Scotiabank products and services are subject to the terms of applicable agreements and local regulations. Officers, directors and employees of Scotiabank and its affiliates may serve as directors of corporations.
Any securities discussed in this report may not be suitable for all investors. Scotiabank recommends that investors independently evaluate any issuer and security discussed in this report, and consult with any advisors they deem necessary prior to making any investment.
This report and all information, opinions and conclusions contained in it are protected by copyright. This information may not be reproduced without the prior express written consent of Scotiabank.
™ Trademark of The Bank of Nova Scotia. Used under license, where applicable.
Scotiabank, together with “Global Banking and Markets”, is a marketing name for the global corporate and investment banking and capital markets businesses of The Bank of Nova Scotia and certain of its affiliates in the countries where they operate, including; Scotiabank Europe plc; Scotiabank (Ireland) Designated Activity Company; Scotiabank Inverlat S.A., Institución de Banca Múltiple, Grupo Financiero Scotiabank Inverlat, Scotia Inverlat Casa de Bolsa, S.A. de C.V., Grupo Financiero Scotiabank Inverlat, Scotia Inverlat Derivados S.A. de C.V. – all members of the Scotiabank group and authorized users of the Scotiabank mark. The Bank of Nova Scotia is incorporated in Canada with limited liability and is authorised and regulated by the Office of the Superintendent of Financial Institutions Canada. The Bank of Nova Scotia is authorized by the UK Prudential Regulation Authority and is subject to regulation by the UK Financial Conduct Authority and limited regulation by the UK Prudential Regulation Authority. Details about the extent of The Bank of Nova Scotia's regulation by the UK Prudential Regulation Authority are available from us on request. Scotiabank Europe plc is authorized by the UK Prudential Regulation Authority and regulated by the UK Financial Conduct Authority and the UK Prudential Regulation Authority.
Scotiabank Inverlat, S.A., Scotia Inverlat Casa de Bolsa, S.A. de C.V, Grupo Financiero Scotiabank Inverlat, and Scotia Inverlat Derivados, S.A. de C.V., are each authorized and regulated by the Mexican financial authorities.
Not all products and services are offered in all jurisdictions. Services described are available in jurisdictions where permitted by law.