Next Week's Risk Dashboard
- Reading the state of the US labour market
- Fed communications are not helping
- More US data postponements
- Key data to track China’s economy into Q4
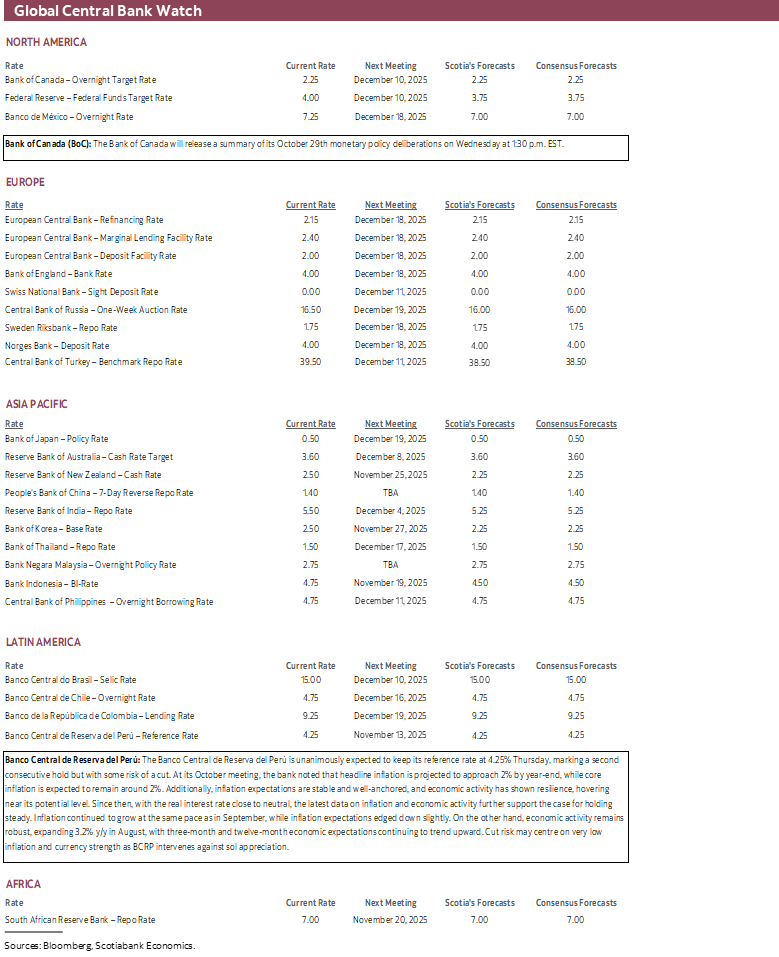
- BCRP: hold with cut risk
- Aussie jobs — will resilience persist?
- Canada focused on earnings reports
- Europe focused on the state of the UK economy
- Light Indian inflation masks underlying pressures
Chart of the Week
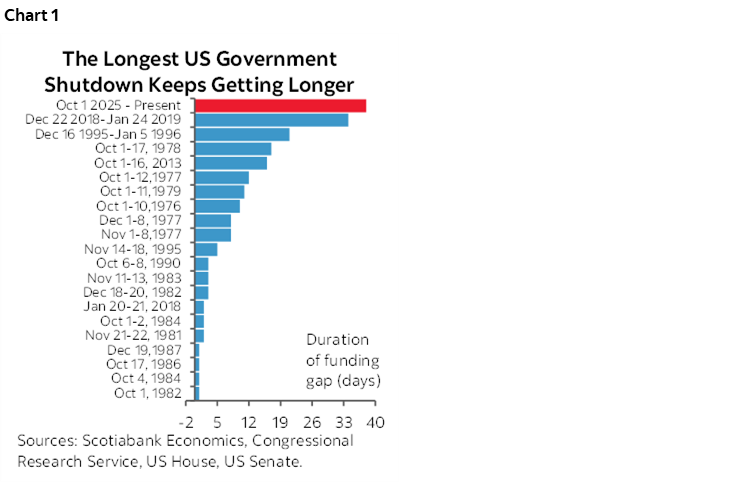
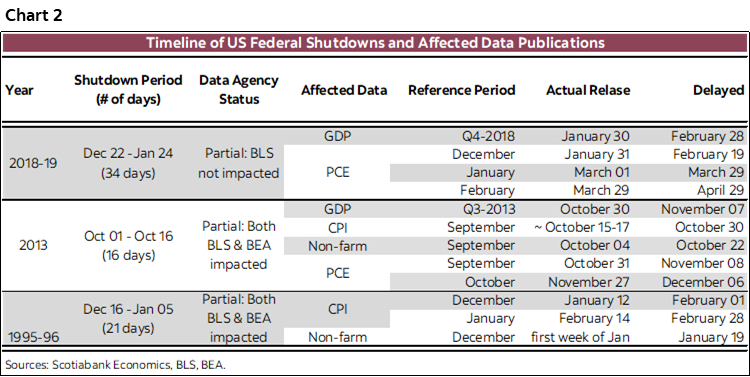
As the US government shutdown smashes records with no obvious end in sight (chart 1), the toll on the economy is mounting. The risk of permanently foregone economic activity is rising as the key holiday season draws nearer including US Thanksgiving on November 27th, the need to finalize travel and holiday plans beforehand, a growing number of flight cancellations and disorder, and the key year-end holiday shopping season leading up to Christmas. There is rising risk that the Fed may not even get key data before its December 10th decision (chart 2).
On that note, a key question concerns what we can see about the current state of the US labour market absent the gold standard nonfarm payrolls report. This week’s article delves into this issue. Some readings indicate a need for greater concern at the Fed where confusing communications have contributed to the stock selloff.
Other than shutdown talks, the coming week will principally focus upon developments outside of the US
THE STATE OF THE US LABOUR MARKET
In the absence of key data due to the US government shutdown, we’re left with seeking clues in imperfect substitutes for imperfect establishment (nonfarm) and household surveys. What can we say about what’s really going on in the US labour market?
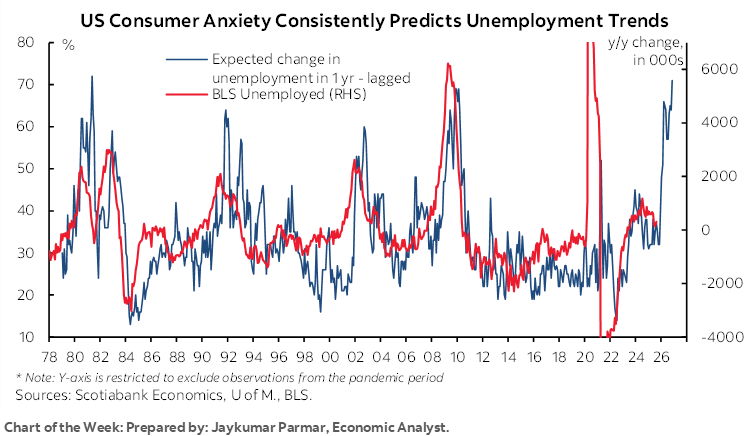
Ask US consumers what they think will happen to the US job market and you might not like the answer. Chart 3 shows they’re pretty good at predicting what happens.
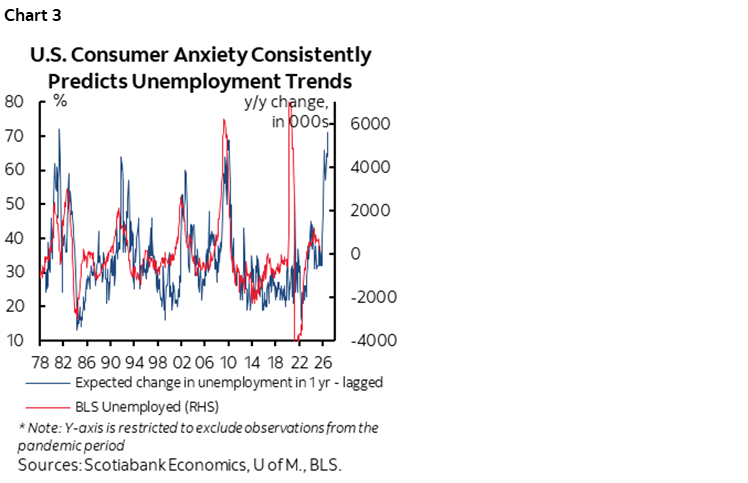
It does so by lagging out the response to the University of Michigan’s consumer sentiment survey question on the expected change in unemployment a year from now and plotting it against what actually happened to the change in the number of unemployed using BLS data. It’s hardly a perfect match, but it’s among the tighter correlations you’ll tend to see in any noisy data. Based the soaring UofM reading and past correlations, one might expect 2–6 million unemployed Americans in 2026 based on the fears of consumers today.
Millions of workers with their ears to the ground may have useful information on their employers’ future plans. They’re not clairvoyant, mind you, so we have to consider other forms of evidence on the current state of the job market.
We can, for example, look at the evidence on what consumers are seeing at the grassroots level and their internet searches (or at least the ones we’d care to know about…).
The ‘jobs plentiful’ reading from consumer confidence was stable at 27.8 from 26.9 previously but has been sharply falling since early 2022 when it peaked at 56.7 (chart 4). This says consumers are seeing fewer job openings. The chart also indicates there is apparently considerable residual seasonality in their seasonally adjusted data!
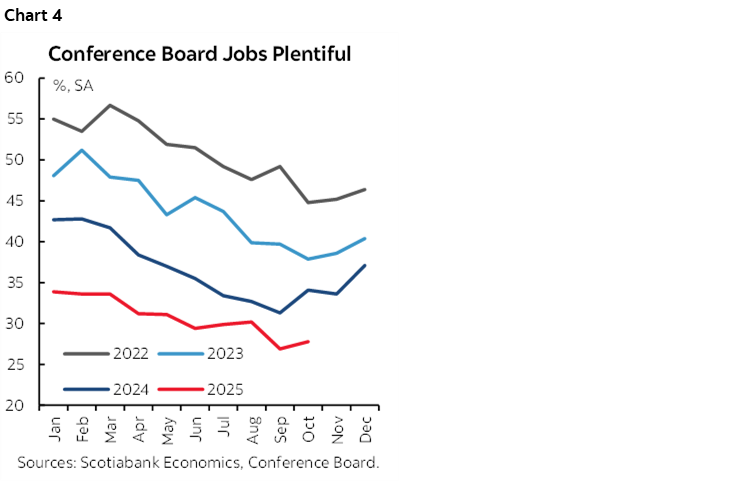
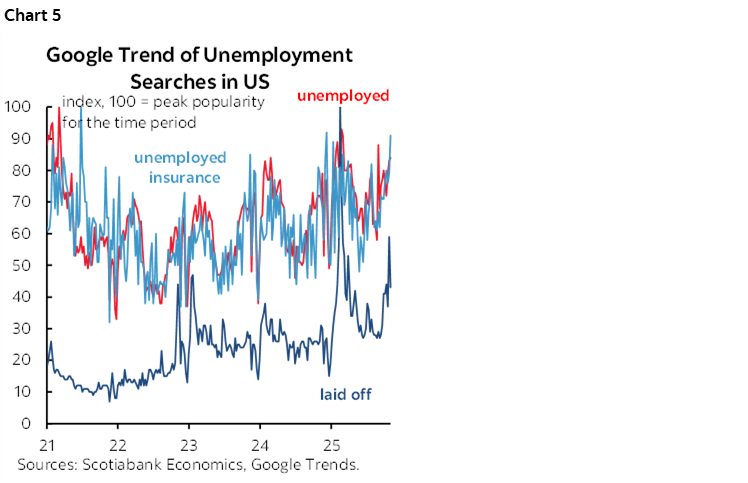
Chart 5 shows trends in popular search terms on Google. Searches for ‘laid off’ and ‘unemployed’ and ‘unemployment insurance’ are volatile but generally trending upward. Either it’s morbid curiosity and concern for one’s fellow human beings, or people are looking for information about what to do after unfortunately suffering through job loss.
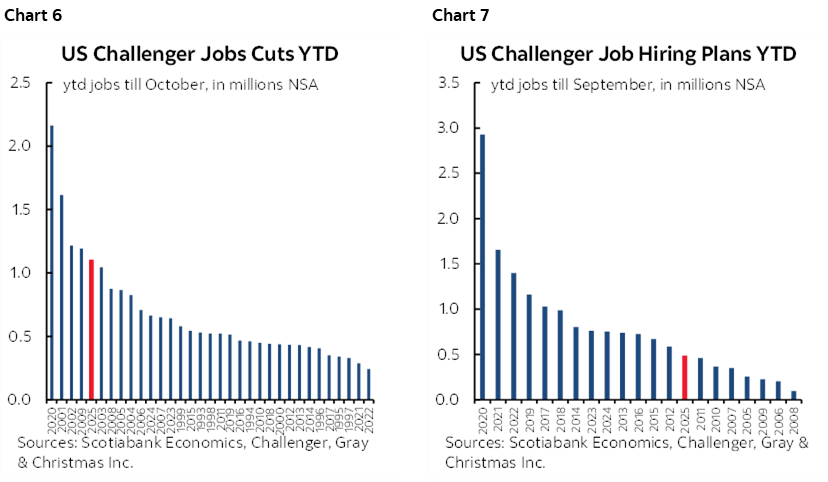
Challenger layoffs—as bad as they were—only count corporate layoffs. They don’t include the DOGE layoffs that will hit again in October payrolls. Further, the corporate layoffs won’t show up in October nonfarm payrolls whenever we get it because they occurred late month and outside of the nonfarm reference period. Still, when year-to-date layoffs are only exceeded by the dot-bomb, GFC and pandemic eras, it would be foolish to ignore the signals (chart 6). Ditto for year-to-date hiring that is among the weakest years on record (chart 7).
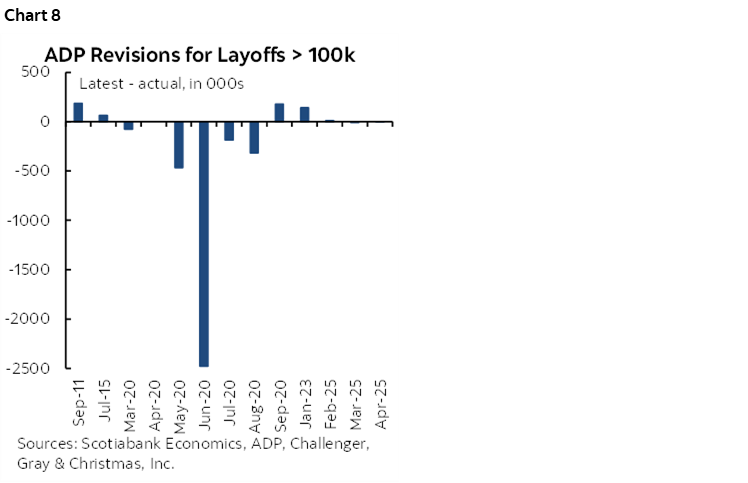
ADP’s reported gain of 30k private payroll positions in October may be revised lower. It is estimated during the week that includes the 12th of the month. That doesn’t capture the layoffs at the end of October which may drag on October ADP or with a lag. Chart 8 shows what happens to ADP revisions when Challenger job cuts land at 100k or higher. Also, ADP doesn’t include government and so it too doesn’t include DOGE cuts.
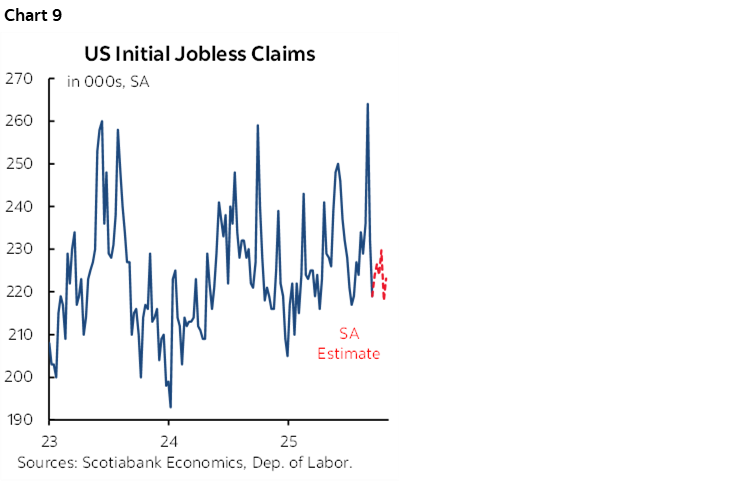
Looking at jobless claims data provides a mixed picture. We only have BLS data up to mid-September but can use the sum of states data for initial claims across state level governments that are not shut and make suitable seasonal adjustments to show chart 9. Initial claims are still doing ok.
A similar methodology using continuing claims reveals a somewhat different picture. The sum of states continuing claims adjusted for seasonality since mid-September and spliced onto actual weekly history before the federal government shutdown shows they remain elevated and trending slightly higher (chart 10).
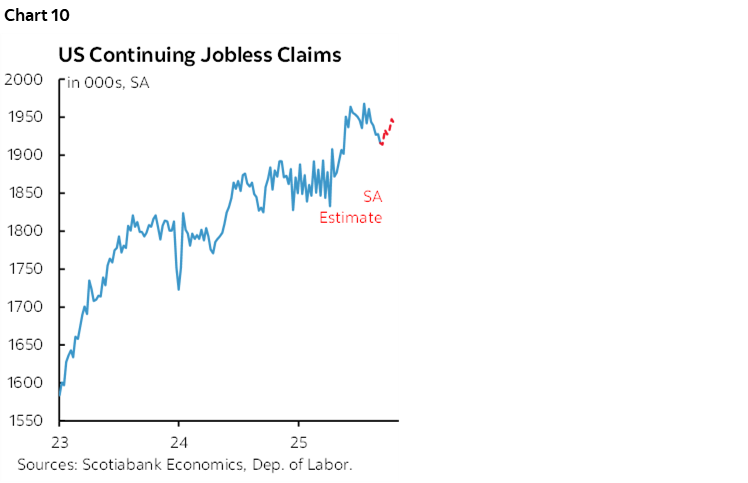
Why that’s somewhat bothersome is because of the very strong correlation between continuing claims and the unemployment rate. The correlation points toward a recently rising unemployment rate if we only had the BLS data. Using continuing claims suggests that the US unemployment rate has probably edged up to 4.4–4.5% from 4.3% the last time we saw the data in August. That’s still low, but it extends the upward trend since it bottomed at 3.4% in April 2023. We’re starting to edge above some estimates of the US equilibrium rate of unemployment such as the OECD’s 4.1% NAIRU estimate.
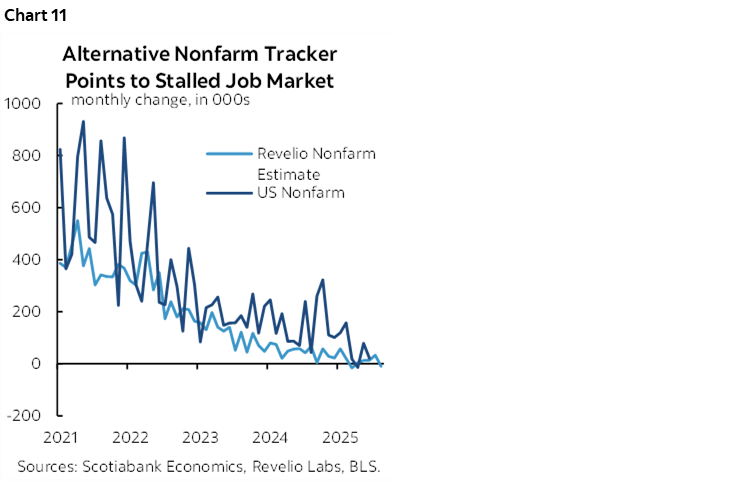
We can dig further into the murky underworld of alt-data. Alternative private data like Revelio’s nonfarm tracker is soft at +33k in September and then -9k in October with the DOGE government layoffs part of the weakness. This measure tracks individual level data collected from online professional profiles. It’s a loose guide and can be off by quite a bit at times and has an average tendency to understate payrolls (chart 11). Still, it’s showing that US job growth is at a rough standstill.
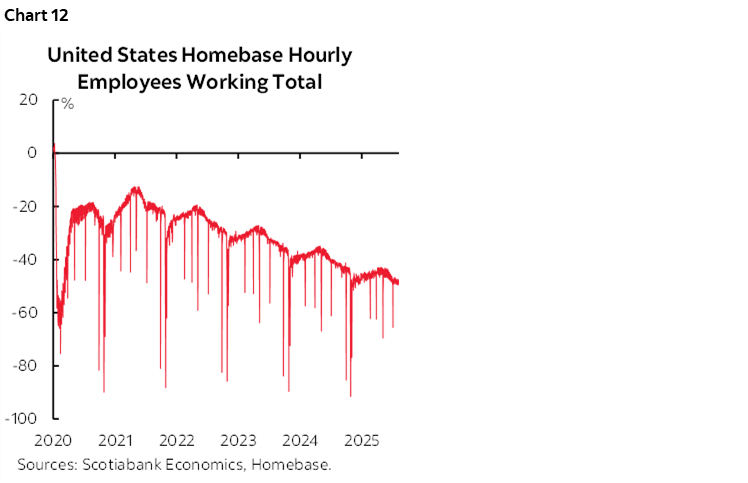
Homebase’s weekly measure of hourly paid employees has been the weakest since they started to track it in 2020. It only reflects a portion of workers, is not seasonally adjusted, and is delayed by four weeks. Still, it’s showing a continued softening trend (chart 12). So is their data on the number of businesses that are open and their tallies of hours worked.
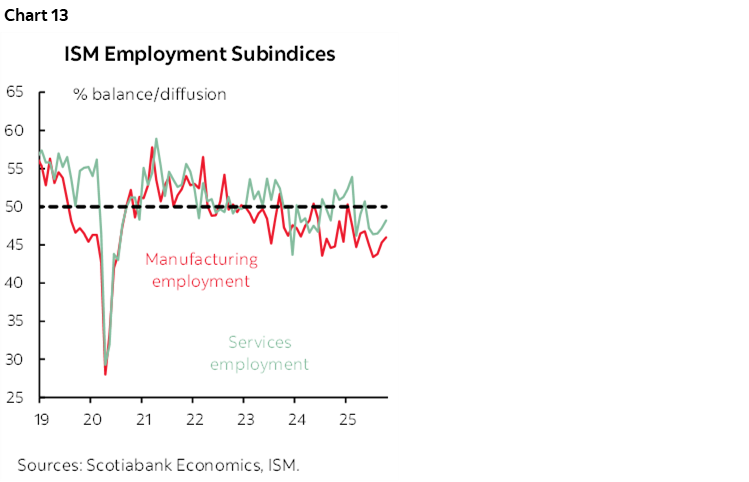
Purchasing managers offer timely insight into what they are seeing for employment within services and manufacturing and both readings are indicating that employment is contracting with sub-50 readings (chart 13).
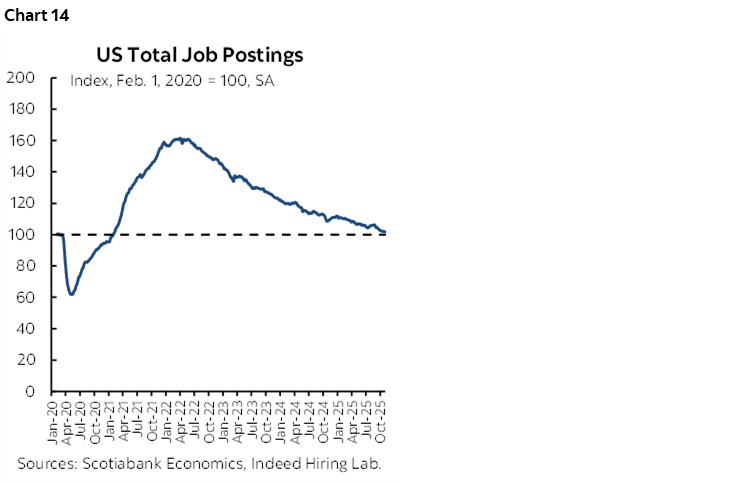
Indeed job postings and new postings have steadily declined since 2022 and marginally declined this year (chart 14).
In all, we’re left with a mixed picture that includes several warning signs. Still, the nonfarm payrolls report is the gold standard for the Fed. The challenge is that its various quirks mean that no other gauge necessarily aligns that well with it. Therefore, we don’t necessarily get much info out of alternative readings as a predictor of nonfarm payrolls to help fill the void with two suspended payroll readings.
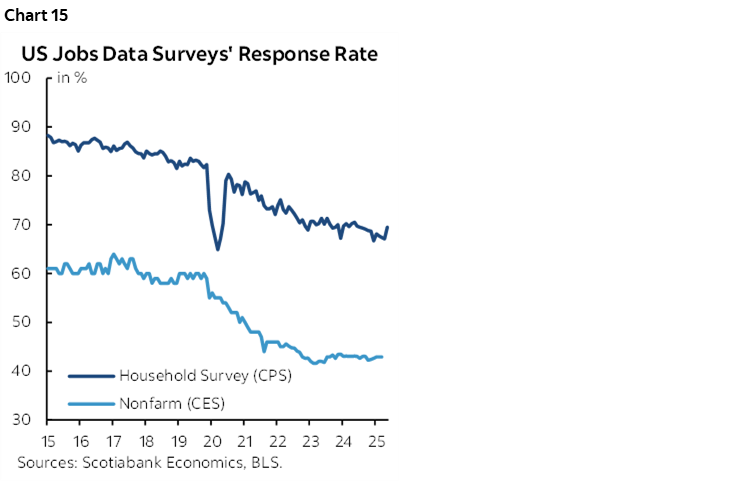
Some of nonfarm’s quirks include counting multiple jobholders more than once. Or the birth-death model adjustments. There is also the problem of falling data quality/collection rates (chart 15), and possibly distorted seasonal adjustment factors marked by a recency bias skewed to the pandemic era that may be unsuitable. Nonfarm has a 90% confidence band of +/-136k around the estimated monthly changes in payrolls through which you could only steer the width of the continental United States as including Hawaii would be going much too far.
Nothing will be concretely settled until we see the actual numbers and then start the parade of revisions. For now, I’ve estimated nonfarm payrolls at -20k for September and -90k for October.
FED COMMUNICATIONS ARE NOT HELPING
Differences in views are to be expected during periods of rapid change and conflicting drivers. Today’s US-driven trade wars, supply chain turmoil, and GenAI investments make for a very cloudy outlook.
What should be more of a constant is guidance on how the FOMC would respond to different scenarios for reaching its dual mandate goals of full employment and price stability. Up until recently, Federal Reserve Chair Powell was doing very well at communicating that the policy direction would be based on which part of their dual mandate was deviating furthest from their goals and that it would be treated as an empirical question.
And then Chair Powell said this during the October 29th press conference:
“We have a situation where the risks are to the upside on inflation and to the downside on employment. Some have different forecasts and different levels of risk aversion. Some will be more averse to inflation overruns and some more to employment undershoots. There were very disparate views in the September SEP. That's what leads me to say we haven't made a decision about December and it's not to be treated as a foregone conclusion and in fact far from it.”
This remark leaves us wondering if the Committee—and particularly Powell—still view what to do as empirically based or as a function of varying levels of risk aversion. That adds a greater degree of policy arbitrariness than financial markets are comfortable handling. Since the October 29th FOMC communications, the S&P has fallen by over 3%.
What is also not helping are signs from some Committee members that they are ok with surprising markets in this environment. I’m speaking of the hawkish dissenters in particular who would have been ok with no change at the last decision with markets fully priced for a cut. Given the massive uncertainties overhanging the outlook, surprises of that nature would destabilize market confidence in the Fed.
GLOBAL MACRO—BUSINESS AS USUAL OUTSIDE OF THE US
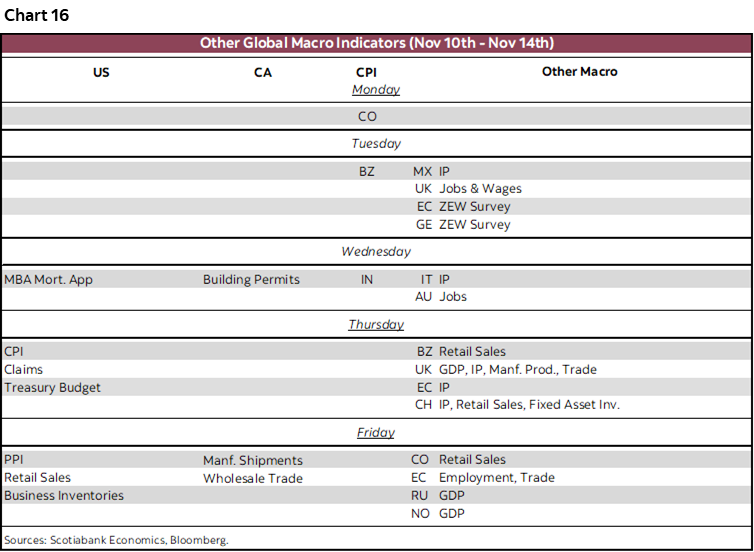
Here are the other key developments to monitor this week and see chart 16 for a summary.
United States—More Missing Data
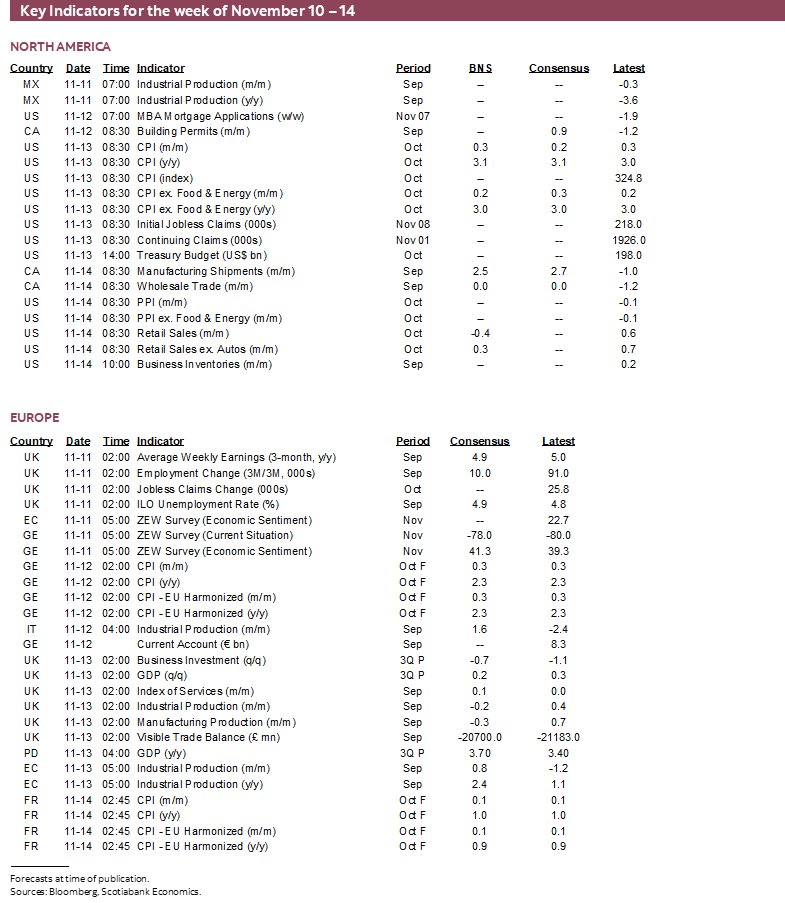
CPI would have been released on Thursday for the month of October if not for the government shutdown. My estimates are 0.3% m/m SA (3.1% y/y) for headline CPI and 0.2% m/m (3.0% y/y) for core CPI. Producer prices would have then followed on Friday. Fuller previews will be offered when it looks like the data may be forthcoming.
Retail sales would have been released on Friday for October but add that to the list of missing data as well. Weaker auto sales are likely to drag the headline sales number down by -0.4% but core sales ex-autos and ex-gasoline may be more resilient.
Asia-Pacific—Aussie Jobs, China’s Economy
Parallels are often drawn between Canada and Australia as two midsized economies rich in resources albeit different ones (eg. oil versus coal). One thing in common is the start of the job market in the two countries with Australia gaining a net 37k jobs over the three-month period of July to September while Canada has grown about 127k jobs over the past two months. Whether Australia can keep it up or not will be informed by October’s reading on Wednesday with consensus estimates ranging from gains of 10–45k. We’ll see. Their data is as much of a moving target as Canada’s Labour Force Survey.
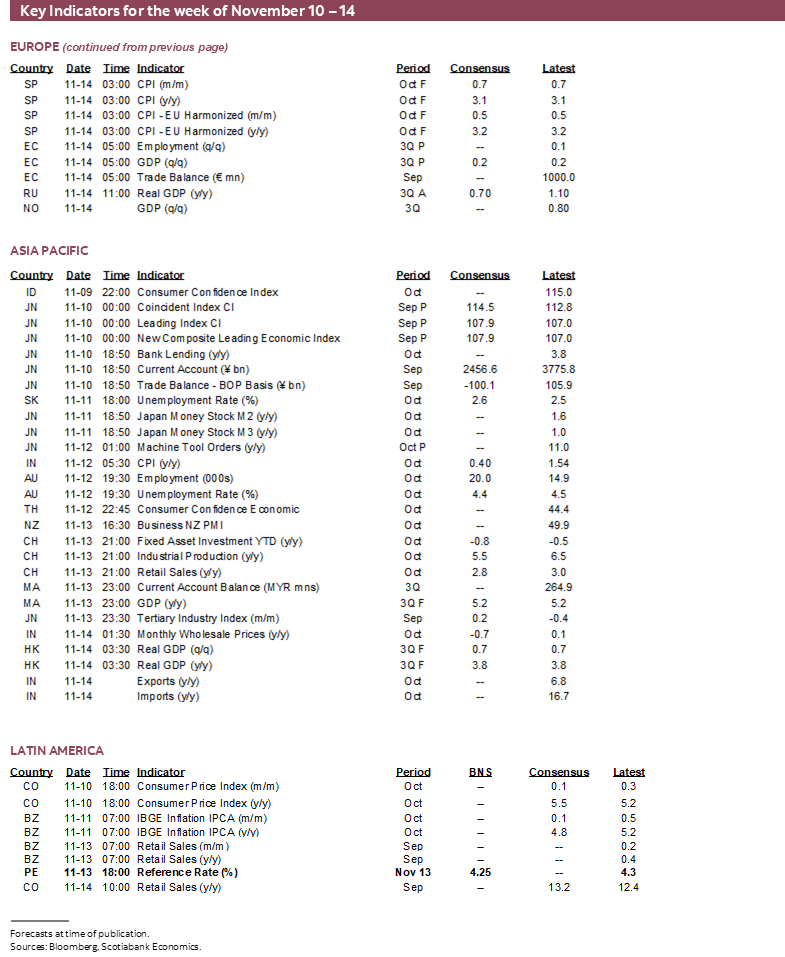
China will refresh a bunch of readings for October. This weekend we’ll get CPI that is expected to remain mildly lower in year-over-year terms, plus producer prices that are likely to continue falling by over 2% y/y. By Thursday, we’ll get data showing still falling house prices, moderate growth in retail sales, decent growth in industrial output and weak fixed investment.
India’s CPI inflation is running at very low rates that are about to push lower. September’s 1½% y/y pace is expected to dip under ½% y/y on Wednesday. That’s misleading, however, as underlying core CPI excluding food, fuel and electricity is up by 4 .6% y/y. Markets are assigning about 40% odds to an RBI cut on December 5th.
Canada—Earnings to Dominate
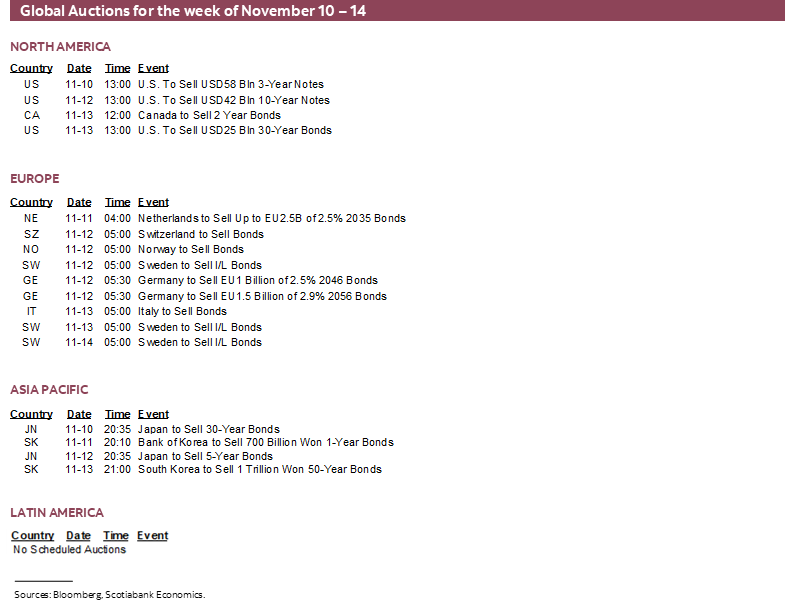
Earnings reports could dominate with forty-five companies slated to report. Some of the names include CAE, Loblaws, Manulife, Linamar, Power Corp, Brookfield and Hydro One. Canadian bond markets will be shut on Tuesday.
There won’t be much else out this week. Advance guidance points to a strong rebound by manufacturing sales during September and flat wholesale trade after the prior month’s drop.
The BoC releases its Summary of Deliberations leading up to the October 29th communications. I doubt we’ll receive any materially new information.
Europe—UK Economy in Focus
The state of the UK economy will be the main focus in Europe. It starts Tuesday with updates for jobs and wages during September and updated payrolls and jobless claims for October. Thursday brings out the first reading for Q3 GDP that is expected to post marginal growth of about ¼% q/q SA nonannualized for the second consecutive quarter. Monthly readings for services activity, trade, and industrial output will help to inform how Q3 is handing off to Q4 growth.
Other European readings will include Norwegian CPI (Monday), Russian Q3 GDP (Friday), and German ZEW investment sentiment (Tuesday).
Latin America—A Pair of Inflation Readings
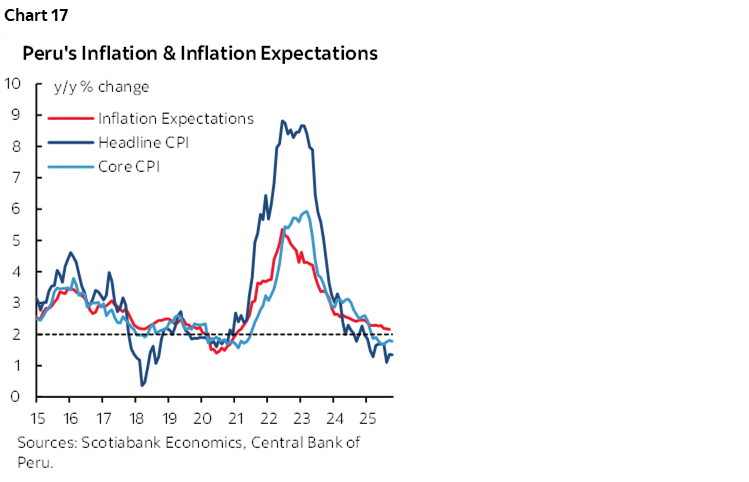
Peru’s central bank is widely expected to leave its reference rate unchanged at 4.25% on Thursday. The central bank delivered a hold message at its last meeting and has been backed by solid economic activity and business optimism. BCRP has been trying to fight currency strength that dates back to March/April by buying USD and selling sol in the spot market. The currency’s rise may add downside to already low inflation of 1.4% y/y (chart 17). At risk is whether the central bank seeks to weaken the currency with a surprise rate cut.
Colombia is expected to see significant jumps in year-over-year CPI and core CPI inflation when October readings are released on Monday evening (ET). Both measures are expected to cross 5% y/y but with m/m price gains fairly reserved.
Brazil’s inflation rate could pull back and continue to register some progress with expectations that the total reading will dip toward 4 ¾% y/y (Tuesday).

DISCLAIMER
This report has been prepared by Scotiabank Economics as a resource for the clients of Scotiabank. Opinions, estimates and projections contained herein are our own as of the date hereof and are subject to change without notice. The information and opinions contained herein have been compiled or arrived at from sources believed reliable but no representation or warranty, express or implied, is made as to their accuracy or completeness. Neither Scotiabank nor any of its officers, directors, partners, employees or affiliates accepts any liability whatsoever for any direct or consequential loss arising from any use of this report or its contents.
These reports are provided to you for informational purposes only. This report is not, and is not constructed as, an offer to sell or solicitation of any offer to buy any financial instrument, nor shall this report be construed as an opinion as to whether you should enter into any swap or trading strategy involving a swap or any other transaction. The information contained in this report is not intended to be, and does not constitute, a recommendation of a swap or trading strategy involving a swap within the meaning of U.S. Commodity Futures Trading Commission Regulation 23.434 and Appendix A thereto. This material is not intended to be individually tailored to your needs or characteristics and should not be viewed as a “call to action” or suggestion that you enter into a swap or trading strategy involving a swap or any other transaction. Scotiabank may engage in transactions in a manner inconsistent with the views discussed this report and may have positions, or be in the process of acquiring or disposing of positions, referred to in this report.
Scotiabank, its affiliates and any of their respective officers, directors and employees may from time to time take positions in currencies, act as managers, co-managers or underwriters of a public offering or act as principals or agents, deal in, own or act as market makers or advisors, brokers or commercial and/or investment bankers in relation to securities or related derivatives. As a result of these actions, Scotiabank may receive remuneration. All Scotiabank products and services are subject to the terms of applicable agreements and local regulations. Officers, directors and employees of Scotiabank and its affiliates may serve as directors of corporations.
Any securities discussed in this report may not be suitable for all investors. Scotiabank recommends that investors independently evaluate any issuer and security discussed in this report, and consult with any advisors they deem necessary prior to making any investment.
This report and all information, opinions and conclusions contained in it are protected by copyright. This information may not be reproduced without the prior express written consent of Scotiabank.
™ Trademark of The Bank of Nova Scotia. Used under license, where applicable.
Scotiabank, together with “Global Banking and Markets”, is a marketing name for the global corporate and investment banking and capital markets businesses of The Bank of Nova Scotia and certain of its affiliates in the countries where they operate, including; Scotiabank Europe plc; Scotiabank (Ireland) Designated Activity Company; Scotiabank Inverlat S.A., Institución de Banca Múltiple, Grupo Financiero Scotiabank Inverlat, Scotia Inverlat Casa de Bolsa, S.A. de C.V., Grupo Financiero Scotiabank Inverlat, Scotia Inverlat Derivados S.A. de C.V. – all members of the Scotiabank group and authorized users of the Scotiabank mark. The Bank of Nova Scotia is incorporated in Canada with limited liability and is authorised and regulated by the Office of the Superintendent of Financial Institutions Canada. The Bank of Nova Scotia is authorized by the UK Prudential Regulation Authority and is subject to regulation by the UK Financial Conduct Authority and limited regulation by the UK Prudential Regulation Authority. Details about the extent of The Bank of Nova Scotia's regulation by the UK Prudential Regulation Authority are available from us on request. Scotiabank Europe plc is authorized by the UK Prudential Regulation Authority and regulated by the UK Financial Conduct Authority and the UK Prudential Regulation Authority.
Scotiabank Inverlat, S.A., Scotia Inverlat Casa de Bolsa, S.A. de C.V, Grupo Financiero Scotiabank Inverlat, and Scotia Inverlat Derivados, S.A. de C.V., are each authorized and regulated by the Mexican financial authorities.
Not all products and services are offered in all jurisdictions. Services described are available in jurisdictions where permitted by law.