Next Week's Risk Dashboard
- Tracking holiday sales
- Inventories, discounting and inflation
- Layoffs to dampen, not derail nonfarm payrolls
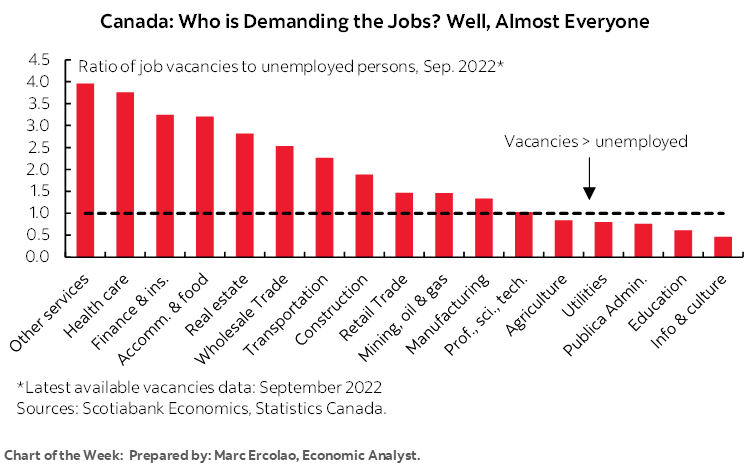
- The Fed’s and BoC’s Beveridge Curve theory is wishful thinking
- Canadian jobs could suffer some payback
- Will Canadian real wage gains continue?
- Canadian Q4 and full year bank earnings
- Fed’s Powell’s chance to adjust pre-FOMC pricing
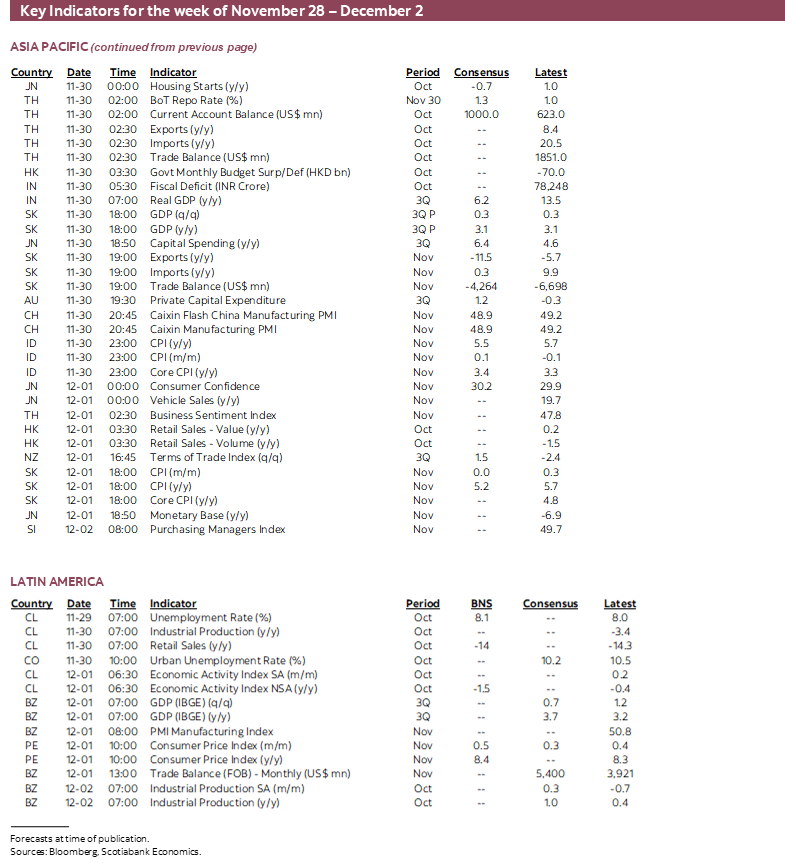
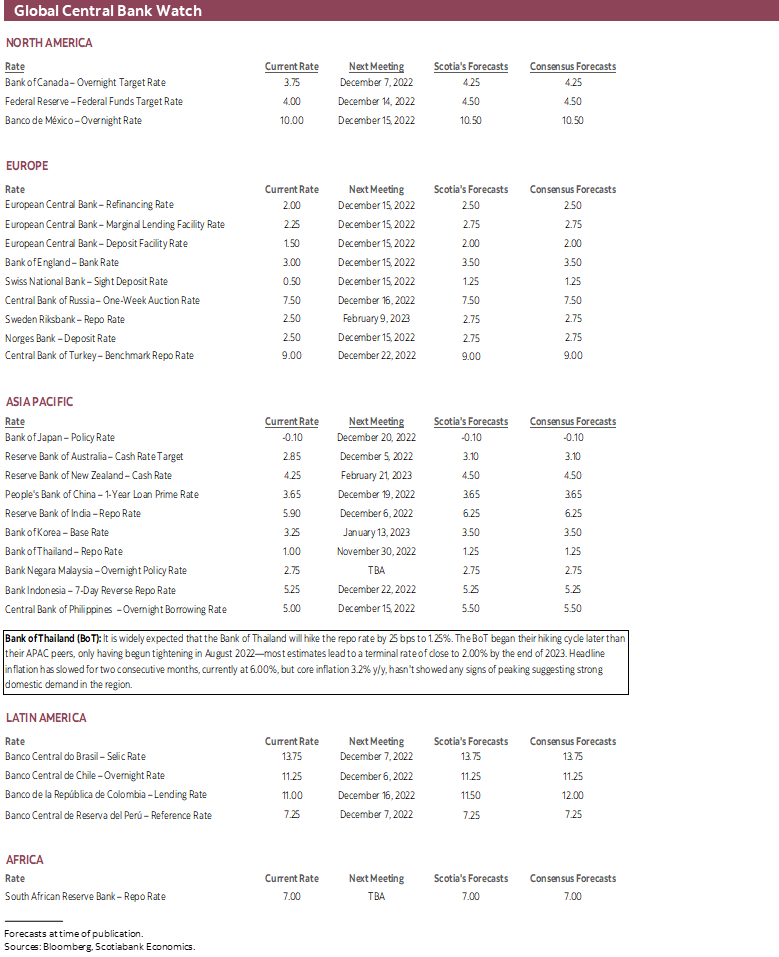
- Why the Bank of Thailand is likely to remain cautious
- PMIs: US ISM, China, Mexico
- Canada’s economy likely remains resilient
- Inflation: US (pce), Eurozone, Australia, Indonesia, SK, Peru
- Other macro readings
Chart of the Week
Global markets will be heading into the homestretch for this year when the calendar flips over to December on Thursday. Whether holiday shopping will be for lumps of coal or something rather more exotic will be informed by early data on the start of the holiday shopping season into the start of the week before the week rises to a crescendo with the latest iteration of the world’s #1 macroeconomic report on Friday.
TRACKING HOLIDAY SHOPPING
High frequency gauges of spending activity as the holiday shopping season kicks off across a number of major economies could inform risk appetite early into the coming week.
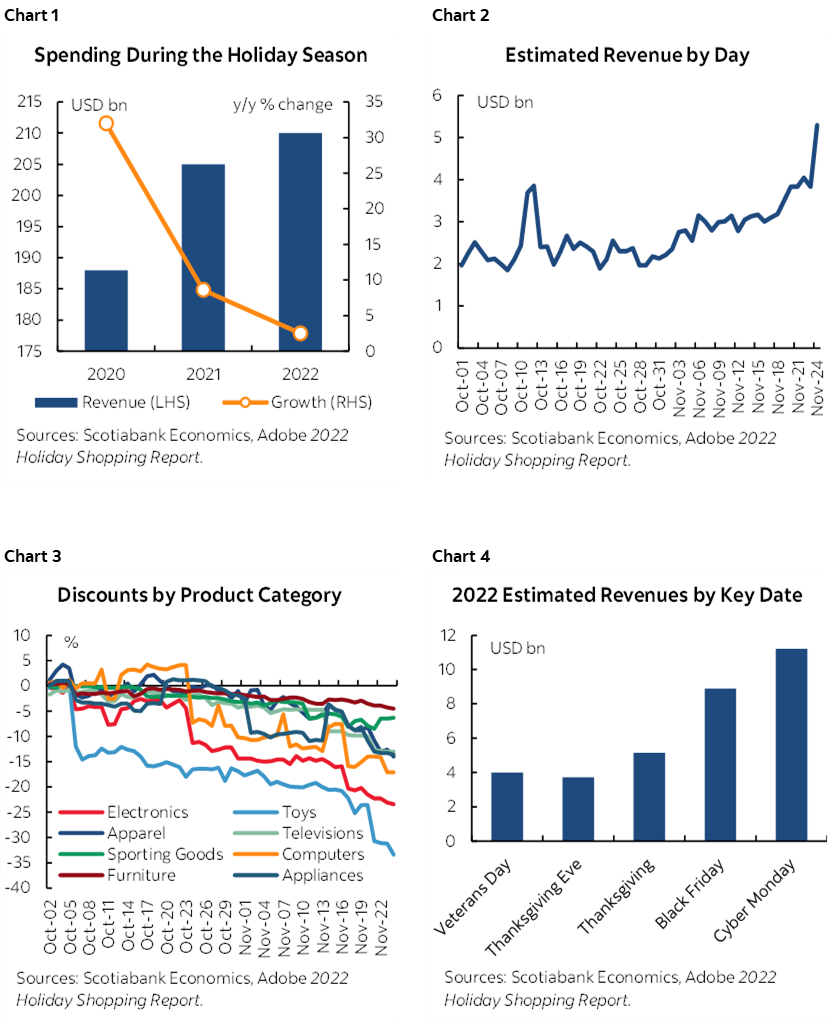
Early indications from Adobe point toward slow US sales growth on Thanksgiving Day compared to the same day last year (charts 1, 2). The small nominal rise probably translates into a volume decline after taking account of inflation although a key consideration is how deep this year’s discounting may turn out to be amid mixed evidence of cumulative discounts since the start of October (chart 3). It’s early mind you and with most of the Black Friday through Cyber Monday sales results ahead of us (chart 4). Also bear in mind that this holiday shopping season may have started earlier than normal given strong retail sales in October and sales promotions that seem to arrive earlier each year.
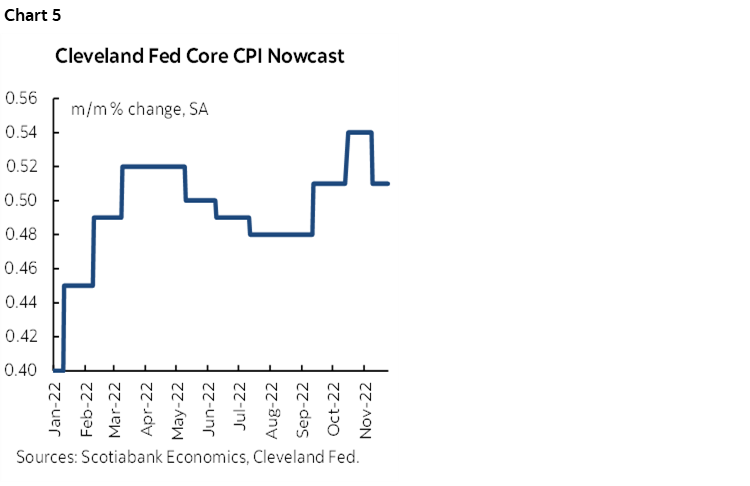
A key issue is the extent to which companies have a surplus of inventories on a broad basis across sectors and using the US as a key example. If so, then deep discounting across the board could be disinflationary at least in the near term, though it may not be sustained should destocking prove to be successful. Measures like the Cleveland Fed’s core inflation ‘nowcast’ for November serve as a usually reliable but not infallible indication of price pressures and this continues to suggest firm seasonally adjusted price pressures (chart 5). If inventories are not wildly in excess and discounting is relatively limited compared to other years, then we might see little beyond seasonal norms for price changes as November draws to a close.
One way of addressing this is through inventory-to-sales ratios. That approach stands in contrast to other approaches that compare the flow of the change in inventories to the flow of sales. That flow-to-flow approach has some appeal if assuming that the two must be perfectly aligned. The stock of inventories relative to the flow of sales can give a more complete understanding of product on hand for this whole season and going forward and takes into account the starting point for the level of inventories.
Chart 6 shows that total business inventories to sales across the combined manufacturing, wholesale and retail sectors has edged up but remains below levels of prior years. That doesn’t mean they are necessarily light going into a likely recession.

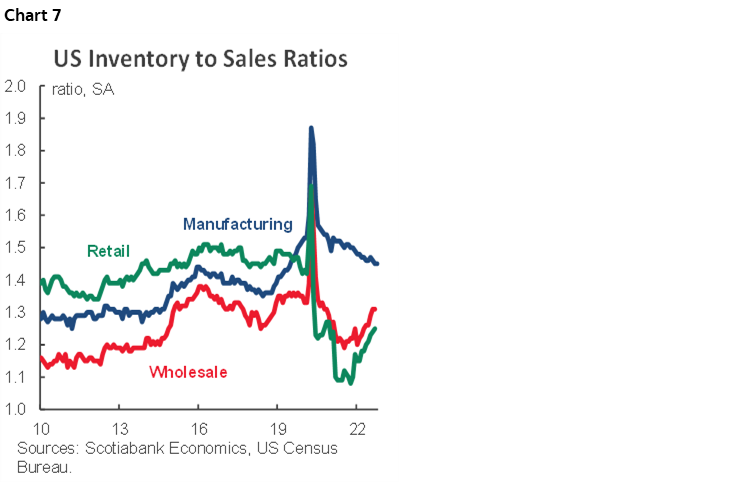
Further disaggregation of the supply chain is necessary. Chart 7 shows that aggregate inventory-to-sales ratios are lower than pre-pandemic levels in the retail and wholesale sectors, but similar to higher in the manufacturing sector.
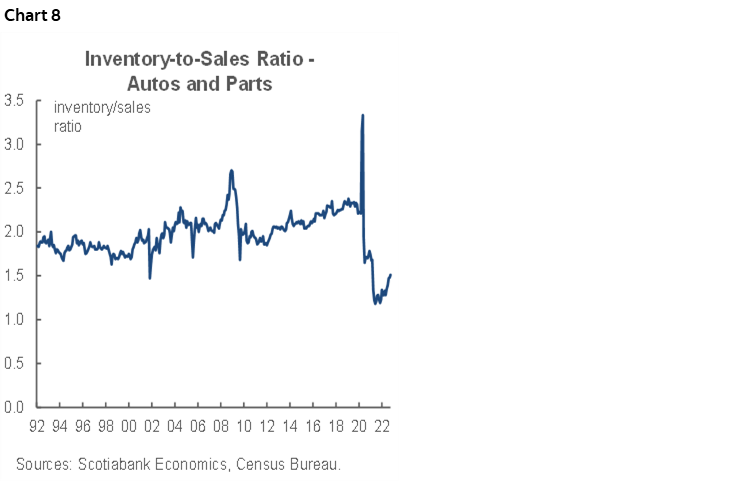
Within the retail sector there are vast differences in the state of inventory balances. Autos and parts, for instance, continue to be plagued by lean inventories and supply chain challenges (chart 8). Not many folks pop a car under a Christmas tree for their beaus, but those that do probably still need to be prepared to pay up and be flexible.
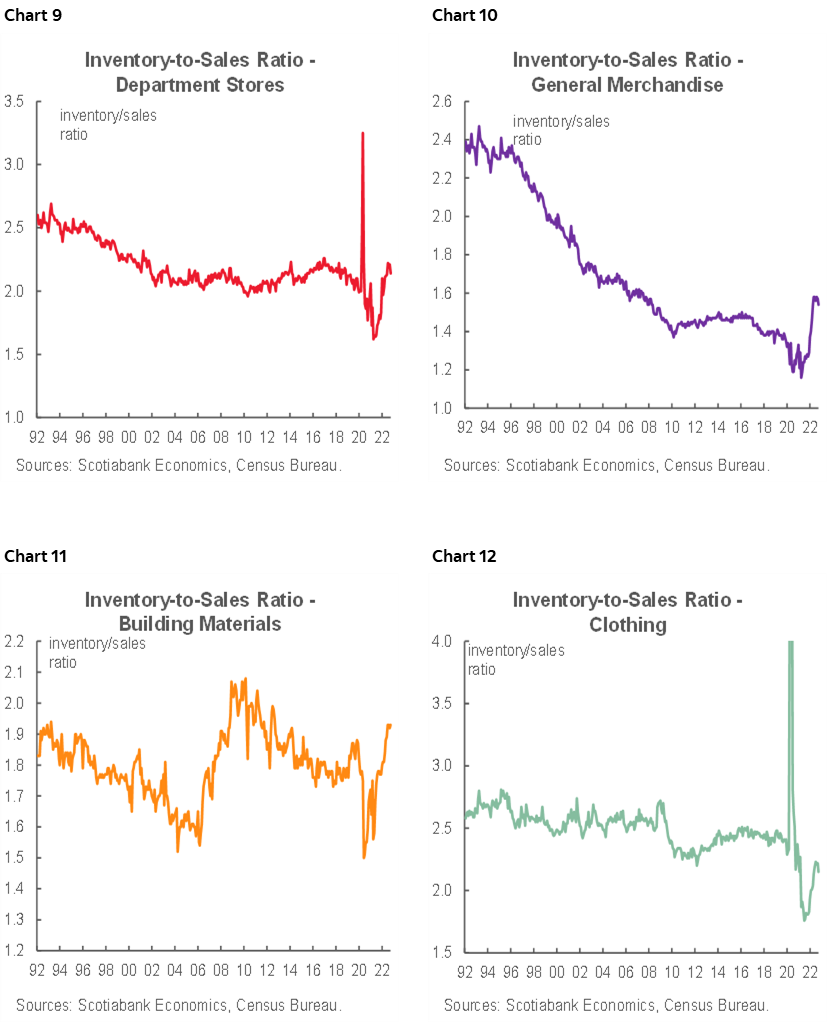
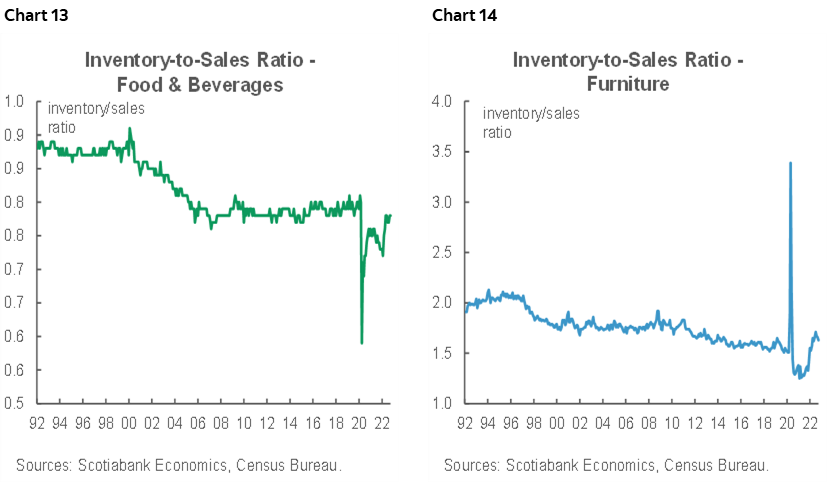
Other retail sectors have had mixed outcomes. Sectors like department stores, general merchandisers and building materials have higher ratios than before the pandemic (charts 9–11). Some of these are driving the headlines on inventory excesses at company-specific levels. The broad clothing sector has seen the ratio rise but only off extremely low levels and some firms within the sector are more challenged than others (chart 12). Food and beverage inventories and furniture are generally better behaved (charts 13, 14).
The issue of inventories also strikes across other debates, like risks to nonfarm payrolls and production levels. Beyond the near-term inventory positions is the ongoing macro theme of how we’re probably still at a highly nascent stage of addressing fundamental changes to global supply chains with implications for inventory management as discussed again in this daily note.
US NONFARM—LAYOFFS TO DAMPEN JOBS WHILE TESTING THE FED’S HOPES
No one should have much confidence in their nonfarm payroll estimates into this one and I’ll say why in a moment. I’ve pencilled in 205k for the net gain and wage growth of 0.3% m/m. The range of consensus estimates runs from about 150k to 275k with a median estimate of 200k.
One reason for limited confidence even at the best of times is the fact that the 90% statistical confidence interval around nonfarm estimates is +/- 120,000 and so the noise factor is always significant.
Another reason for this is that the report appears almost as early as possible in the month (Friday December 2nd) given that it gets released on the first Friday each month. That means there is not the benefit of a bit of extra time for various groups to update advance indicators since they were not available at the point of submitting estimates to polling agencies. The jobs plentiful measure in consumer confidence arrives on Tuesday. The NFIB hiring and vacancy measures for November won’t arrive until two weeks after nonfarm. The ISM-manufacturing employment figure arrives on Thursday, but the higher weight placed on services will have to wait until the employment gauge in ISM-services arrives the following week. ADP payrolls are basically useless as a guide to nonfarm, but they arrive on Wednesday. JOLTS job openings will be updated on Wednesday, but for October as the data lags.
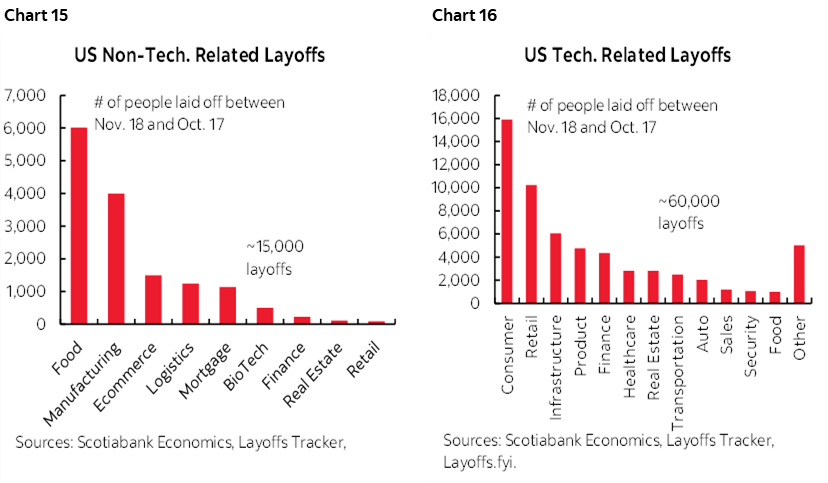
You get the idea. One issue, however, is the extent to which layoff announcements may impact payrolls. Tech (chart 15) and non-tech (chart 16) layoffs have picked up between a rough proxy for nonfarm reference periods and may dampen the jobs tally somewhat, but probably not by enough to carry the day relative to other drivers like hiring appetite. Further, there can be uncertain lags with the layoffs such that they don’t all impact jobs in the current month.
As an indication of this, the rise in initial jobless claims has been material but fairly modest. This could also involve lags between layoffs and filing claims for unemployment benefits.
The fact that this abrupt pick-up in layoffs is occurring lends caution to the Fed’s hopes around the impact of its tightening upon the job market. The background is offered in chart 17 that shows the US Beveridge Curve which plots job vacancies against the unemployment rate. This cycle is a definite outlier compared to history. The blue dots show pre-pandemic history and the red dots plot the pandemic-era experience marked by relatively higher rates of unfilled jobs. The job vacancy rate has been declining of late, but the unemployment has not materially budged and stood at 3.7% in October.
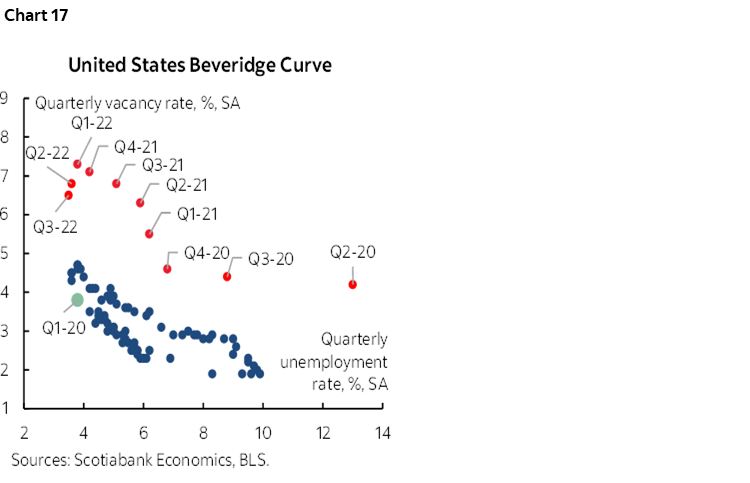
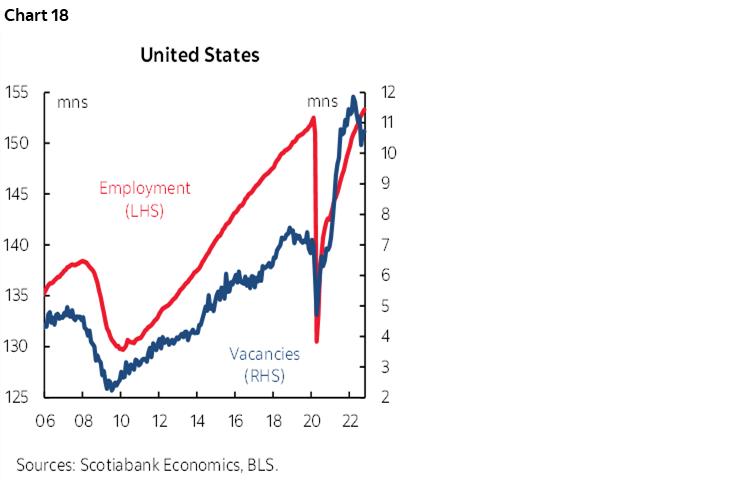
What the Federal Reserve has hinged its hopes upon is for lower vacancies to do the work in terms of removing excess hiring sentiment from the job market and therefore dampen wage growth risks and to do so without a large increase in unemployment. In addition to the point about the abrupt pick-up in layoffs, the limited history that is available doesn’t provide much empirical support for this hope. As chart 18 shows, when vacancies started to soften in the past, they typically preceded a lagging hit on employment. The big caveat is that the limited history of experience is drawn from two massive shocks during the global financial crisis and the pandemic.
IS CANADA STILL POSTING REAL WAGE GAINS?
Canada also updates its job market readings for November on Friday at the same time as nonfarm payrolls. On this there is a little more conviction. After gaining 108,000 jobs in October, a repeat may be hard to come by, but dismissing that gain as just statistical noise is a tough sell given the 95% confidence interval of +/- 57,000. It was the strongest monthly gain since February, but October benefitted from a milder reopening impulse effect following prior restrictions compared to that prior time. I’ve guesstimated a dip of -10k
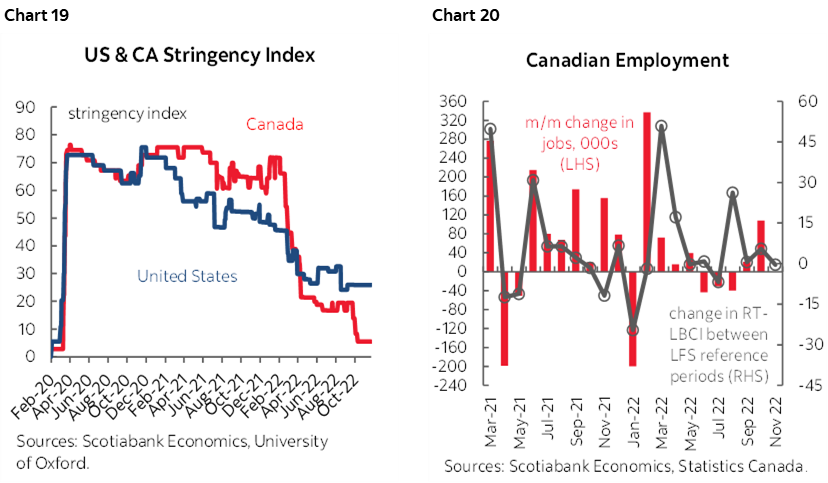
That restrictions remain at their lowest levels of the pandemic to date may help to avert a worse outcome for jobs (chart 19). As noted in prior writings, measures of service sector activity have been strong including restaurant seatings, flights and hotel bookings. A measure of real-time business conditions that draws upon a composite of high frequency mobility and business register data tends to be roughly correlated with swings in employment. This measure suggests little change (chart 20).
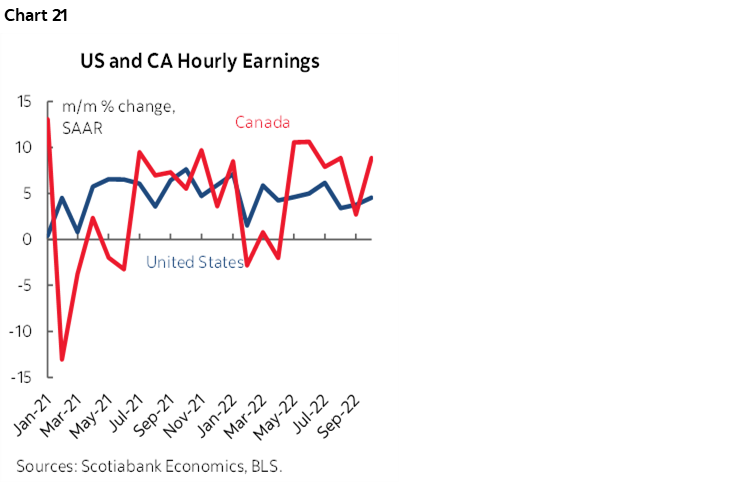
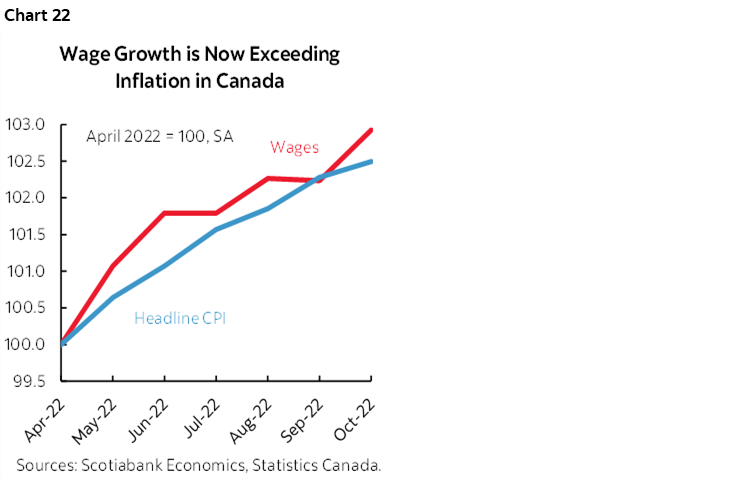
More important, however, will be continued monitoring of wage growth. Other than Scrooge or the Grinch, everyone likes a wage hike and to see people earning fair pay. The challenge for Canada, however, is that wage growth as been outstripping the US (chart 21) in a tighter labour market than stateside and one that has suffered a steep decline in labour productivity during the pandemic unlike the US. See last week’s Global Week Ahead for Canada’s international rankings on these measures that suggest the risks of wage growth outstripping productivity and driving second-round effects upon prices is higher in Canada than in other peer economies.
In fact, Canada is booking real wage gains and has been doing so since Spring in what is an underacknowledged point (chart 22). Many will welcome this and understandably so after the regressive hits incurred by inflationary drivers on the supply and demand sides of the picture and the domestic policy contributions to high inflation. But real wage gains may be the next catalyst to price pressures into 2023. This particular report, however, may struggle to post another real wage gain in month-over-month terms since CPI was up by 0.6% m/m in seasonally adjusted non-annualized terms.
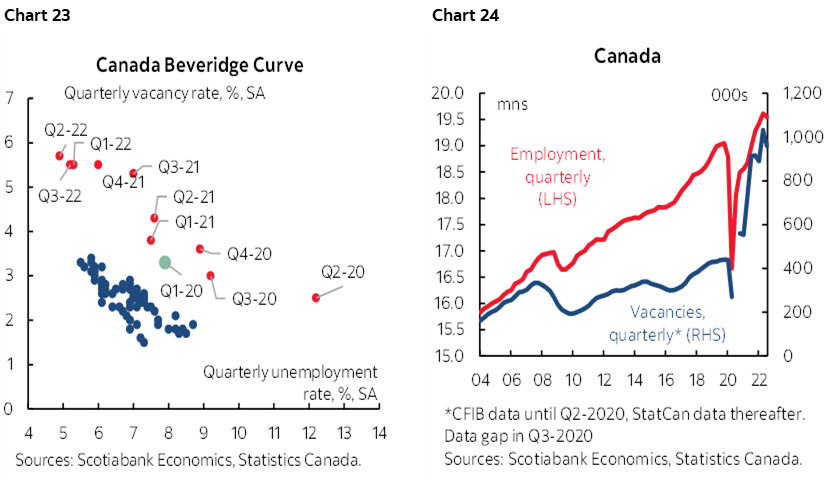
Similar arguments apply to Canada’s Beveridge curve as alluded to in the prior US section. Canada’s curve is shown in chart 23 and chart 24 shows the connection between employment and job vacancies. The BoC has followed the Fed’s arguments and research on this topic and the caveats are similar. Canada’s curve in the pandemic period is much higher than history. There has been a modest decline in job vacancies, but job growth remains strong with the 108k gain in October. One difference is that we’re not tracking a material number of layoffs in Canada. Like the US, however, the limited history doesn’t provide much empirical support for the BoC’s hope that vacancies can ease without necessarily damaging employment. As chart 24 already showed, when vacancies started to soften in the past, they typically preceded a lagging hit on employment and with the same caveat as in the US being the limited history of experience is drawn from two massive shocks during the global financial crisis and the pandemic.
CANADIAN BANK EARNINGS
Canada’s banks release Q4 and full year results on an October 31st year-end. Given their heft—such as accounting for 21% of the Toronto Stock Exchange—their results can ripple through broad stock, corporate bond and other paper markets.
Bank of Nova Scotia (my employer) goes first on Tuesday. Consensus expectations for sector EPS are shown in chart 25. Chart 26 shows the dividend yield’s rise and consensus expectations and chart 27 shows the present dividend yields across the major banks. Consensus expects Q4 EPS of $2.01. RBC (C$2.71) and National Bank ($2.24) release the next day. BMO ($3.09), TD ($2.07) and CIBC ($1.73) follow on Thursday with Canadian Western Bank ($0.88) getting the final say on Friday.
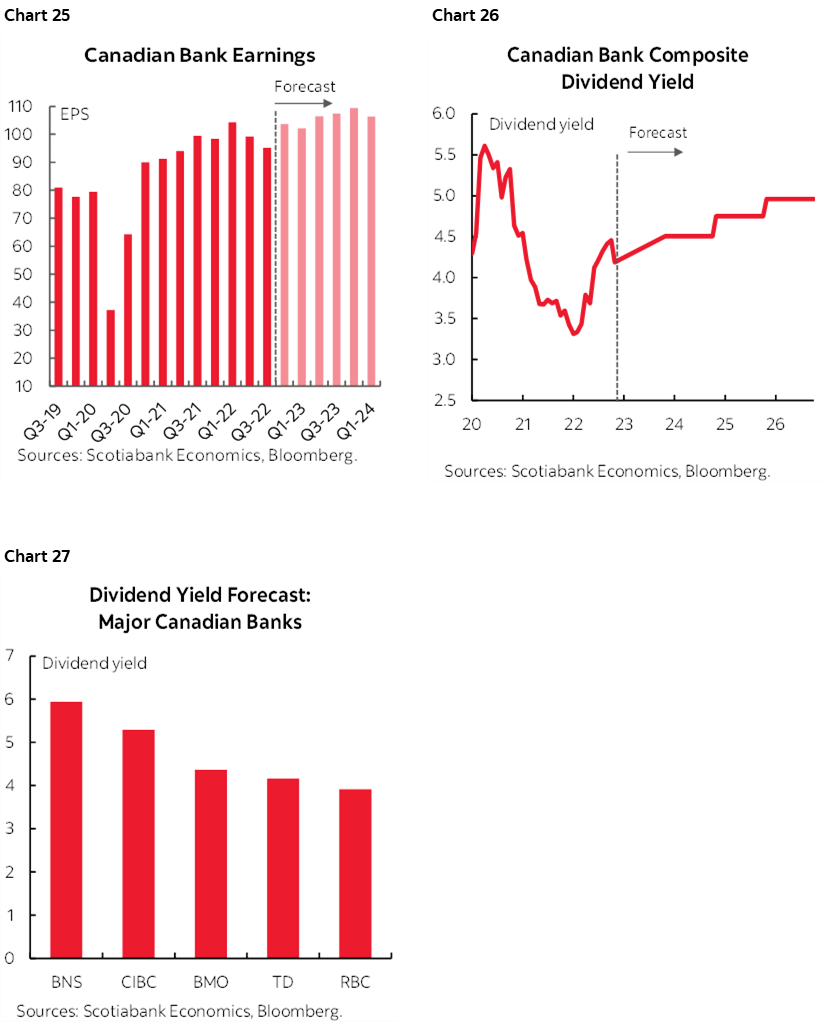
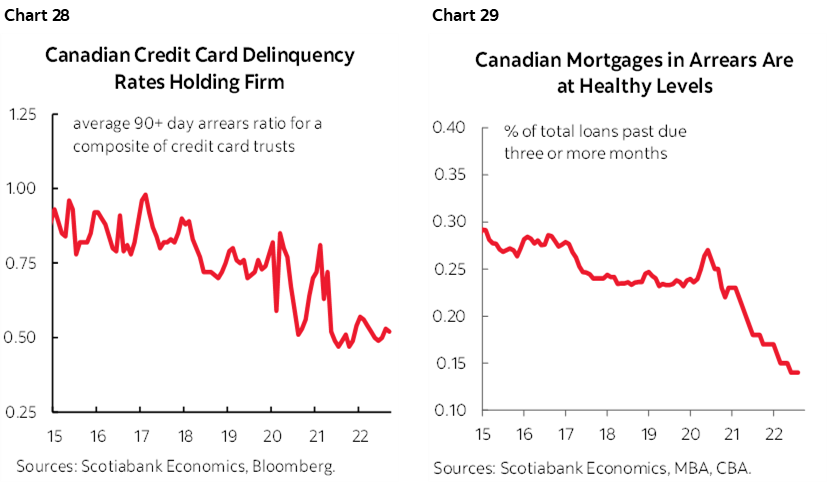
One key will be loan loss provisioning relative to expectations. Thus far, measures like credit card delinquencies (chart 28) and mortgage arrears (chart 29) have been holding steady.
CENTRAL BANKS—FED’S POWELL, CAUTIOUS BOT
There won’t be any major central bank decisions over the coming week but markets may be sensitive to some key guidance from some of them. The following week starts to bring back another wave of decisions from the RBA, Bank of Canada, RBI, and other regional banks like Peru’s, Chile’s and Brazil’s.
The Bank of Thailand is almost universally expected to hike its benchmark policy rate by 25bps to 1.25% on Wednesday. That would make for only 75bps of tightening so far. Why such a tepid pace of cumulative tightening by comparison to other global central banks? For one thing, inflation has not been as pressing of a problem. Headline inflation is running at 6% y/y which is off the peak of 7.9%, but core CPI inflation stands at 3.2% y/y and has levelled off of late. That places core inflation at the upper limit of the central bank’s 1–3% target range.
The BoT was also more concerned about growth while other central banks were lifting off and with good reason. Not only does it neighbour with China, but its important tourism sector was also severely affected by the pandemic. Tourism arrivals have only started to gradually recover this year with activity still remaining a fraction of what it was before the pandemic. Rising global covid cases may be emphasized with caution by the central bank.
The usual wave of central bank speak will feature multiple speakers from the Fed, ECB and BoE.
Key among these appearances may be Fed Chair Powell’s delivery of a talk on “the economic outlook , inflation and the labour market” at the Brookings Institution on Wednesday (here). If he has anything different to say in relation to market pricing for a 50bps hike on December 14th and a terminal rate of 5% by March then now would be the time to do it ahead of when the Fed goes into communications blackout on December 10th.
MACRO ROUND-UP
Top shelf macro readings won’t only be confined to nonfarm payrolls. The rest of the line-up of macroeconomic indicators is offered below.
1. PMIs
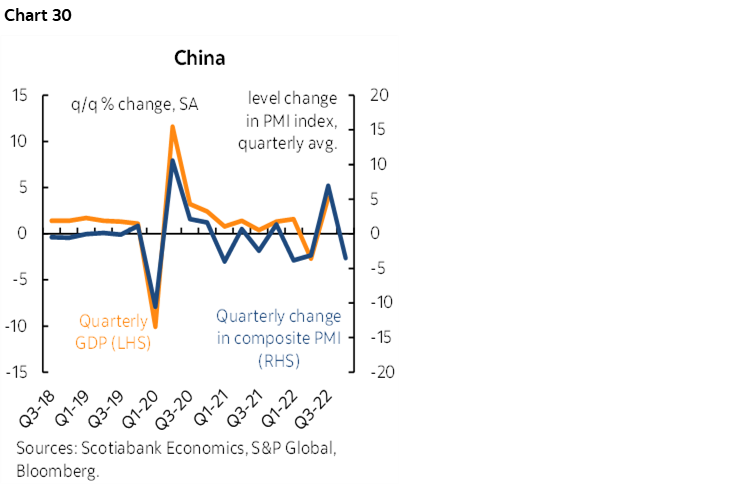
China’s state PMIs face continued downside risk and November’s readings will probably underscore the cost of volatile guidance around Covid Zero policies (Wednesday). The composite slipped into contraction territory in October (chart 30).
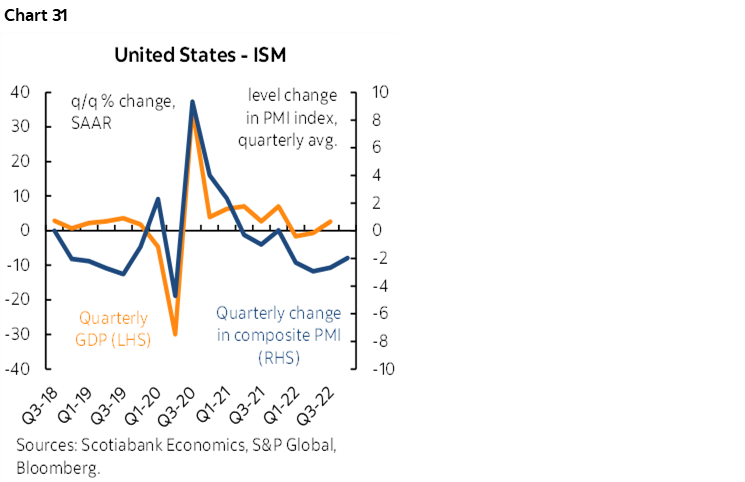
The Fed’s preferred PMIs are the ISM gauges and November updates will begin to arrive this week. ISM-manufacturing (Thursday) will offer part of the picture, and then we’ll have to wait for services the following week. Little change is expected in the manufacturing gauge but also watch for indications of price pressures. Chart 31 shows one reason why the composite PMI gauge matters given its connection to GDP growth.
2. GDP
Canadian GDP is expected to post continued growth (Tuesday). September is estimated at 0.1% m/m with Q3 pegged at about 1 ½% q/q at a seasonally adjusted and annualized rate. The monthly composition could bake in continue mild growth into Q4. That any growth is still being registered is an accomplishment in the wake of explosive world-beating growth over 2021Q3 through to 2022Q2. That hours worked stalled out in Q3 might offer a mild lift to productivity figures (Thursday) but the rise in hours worked so far in Q4 could make this a fleeting outcome.
India’s economy will likely see volatile year-over-year growth ebb when Q3 GDP arrives on Wednesday amid expectations for it to land at about 6% y/y.
Brazil’s economy is projected to grow by under 1% q/q in Q3 (Thursday) after a pair of gains over 1% at a non-annualized rate.
Sweden’s Q3 GDP (Tuesday) has analysts expecting growth in a roughly ½% to ¾% q/q non-annualized range.
3. Inflation
Several key inflation readings arrive just in time to inform another coming wave of central bank decisions in December.
Eurozone inflation is unlikely to repeat the large spike in October when the November figures arrive this week. That prior 1.5% m/m SA spike was driven by food and energy prices that are expected to be milder influences with inflation landing on Wednesday. Germany and Spain will release the day before and could inform risks to the Eurozone print. Italy and France update on Wednesday.
US PCE inflation is expected to follow CPI higher when October’s estimate arrives on Thursday. Watch for a gain of about 0.4% m/m with core up 0.3% m/m. Spending might rise more slowly than consensus expects given heavy reliance upon translating the strong gain in the retail sales control group into what it means for total consumption growth that also factors in services consumption after a large gain the prior month.
Watch for Australian inflation to keep rising from 7.3% y/y in September to a few tenths higher in October.
Peru’s inflation rate should hold steady at around 0.3% m/m (Thursday) ahead of South Korea’s CPI that is expected to be 0% m/m. Indonesia’s headline inflation rate could soften a touch to 5 ½% y/y but core is expected to hold steady at 3.3% (Wednesday).
Other
Other US releases will include consumer confidence during November (Tuesday), the advance merchandise trade figures and pending home sales during October and the Fed’s Beige Book (Wednesday). Vehicle sales are forecast to slip again (Thursday) and construction spending should soften given weaker housing starts (Thursday).
Also watch out for retail sales updates from Australia (Monday), possibly Germany, Japan (Monday) as part of its monthly data dump, South Korea and also total French consumer spending (Wednesday).
DISCLAIMER
This report has been prepared by Scotiabank Economics as a resource for the clients of Scotiabank. Opinions, estimates and projections contained herein are our own as of the date hereof and are subject to change without notice. The information and opinions contained herein have been compiled or arrived at from sources believed reliable but no representation or warranty, express or implied, is made as to their accuracy or completeness. Neither Scotiabank nor any of its officers, directors, partners, employees or affiliates accepts any liability whatsoever for any direct or consequential loss arising from any use of this report or its contents.
These reports are provided to you for informational purposes only. This report is not, and is not constructed as, an offer to sell or solicitation of any offer to buy any financial instrument, nor shall this report be construed as an opinion as to whether you should enter into any swap or trading strategy involving a swap or any other transaction. The information contained in this report is not intended to be, and does not constitute, a recommendation of a swap or trading strategy involving a swap within the meaning of U.S. Commodity Futures Trading Commission Regulation 23.434 and Appendix A thereto. This material is not intended to be individually tailored to your needs or characteristics and should not be viewed as a “call to action” or suggestion that you enter into a swap or trading strategy involving a swap or any other transaction. Scotiabank may engage in transactions in a manner inconsistent with the views discussed this report and may have positions, or be in the process of acquiring or disposing of positions, referred to in this report.
Scotiabank, its affiliates and any of their respective officers, directors and employees may from time to time take positions in currencies, act as managers, co-managers or underwriters of a public offering or act as principals or agents, deal in, own or act as market makers or advisors, brokers or commercial and/or investment bankers in relation to securities or related derivatives. As a result of these actions, Scotiabank may receive remuneration. All Scotiabank products and services are subject to the terms of applicable agreements and local regulations. Officers, directors and employees of Scotiabank and its affiliates may serve as directors of corporations.
Any securities discussed in this report may not be suitable for all investors. Scotiabank recommends that investors independently evaluate any issuer and security discussed in this report, and consult with any advisors they deem necessary prior to making any investment.
This report and all information, opinions and conclusions contained in it are protected by copyright. This information may not be reproduced without the prior express written consent of Scotiabank.
™ Trademark of The Bank of Nova Scotia. Used under license, where applicable.
Scotiabank, together with “Global Banking and Markets”, is a marketing name for the global corporate and investment banking and capital markets businesses of The Bank of Nova Scotia and certain of its affiliates in the countries where they operate, including; Scotiabank Europe plc; Scotiabank (Ireland) Designated Activity Company; Scotiabank Inverlat S.A., Institución de Banca Múltiple, Grupo Financiero Scotiabank Inverlat, Scotia Inverlat Casa de Bolsa, S.A. de C.V., Grupo Financiero Scotiabank Inverlat, Scotia Inverlat Derivados S.A. de C.V. – all members of the Scotiabank group and authorized users of the Scotiabank mark. The Bank of Nova Scotia is incorporated in Canada with limited liability and is authorised and regulated by the Office of the Superintendent of Financial Institutions Canada. The Bank of Nova Scotia is authorized by the UK Prudential Regulation Authority and is subject to regulation by the UK Financial Conduct Authority and limited regulation by the UK Prudential Regulation Authority. Details about the extent of The Bank of Nova Scotia's regulation by the UK Prudential Regulation Authority are available from us on request. Scotiabank Europe plc is authorized by the UK Prudential Regulation Authority and regulated by the UK Financial Conduct Authority and the UK Prudential Regulation Authority.
Scotiabank Inverlat, S.A., Scotia Inverlat Casa de Bolsa, S.A. de C.V, Grupo Financiero Scotiabank Inverlat, and Scotia Inverlat Derivados, S.A. de C.V., are each authorized and regulated by the Mexican financial authorities.
Not all products and services are offered in all jurisdictions. Services described are available in jurisdictions where permitted by law.