Next Week's Risk Dashboard
- More inflation is coming your way
- Canadian CPI — Who stole my tax cut?
- Canadian inflation might surpass the BoC’s peak
- Canada offers a warning to the US on cutting gasoline taxes
- UK turmoil and lessons for Canadian separatists
- FOMC Minutes — How many were there?
- Canadian consumers likely had a strong Q1
- Global PMIs — too soon for front-running to give way to pass through?
- UK jobs, wages and CPI won’t settle the BoE’s next move
- BI — A split consensus has a watchful eye on the rupiah
- Aussie jobs unlikely to alter RBA hold
- Nvidia’s earnings to round out the ‘Mag7’
- Global macro
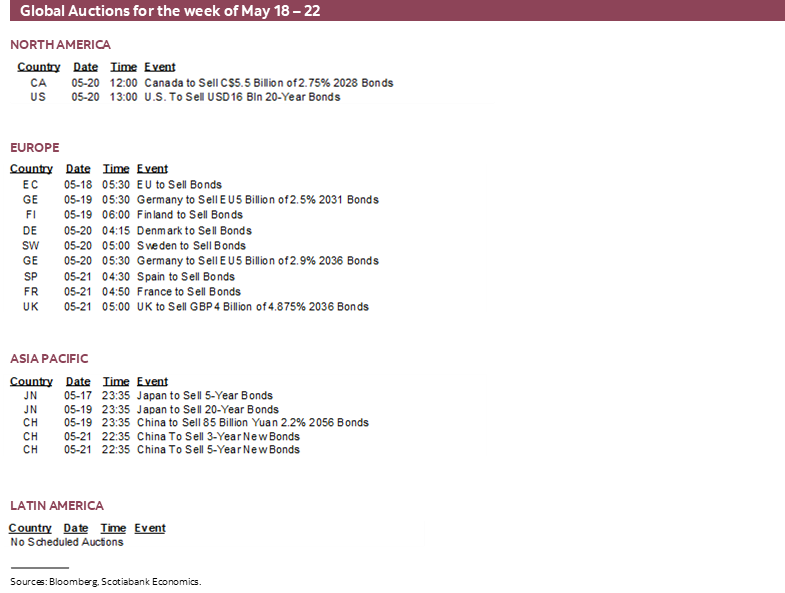
- Canadian markets shut Monday
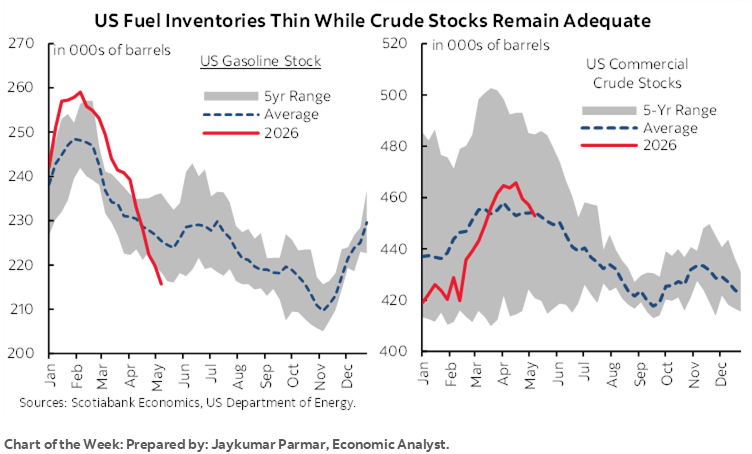
Chart of the Week
When it comes to inflation, Canada is different than the US. Or so goes a popular narrative.
Reality bites. We’ll find out how badly it bites this week when Canada follows the US with its own inflation update. It turns out the two countries share a lot in common and this could mean that Canada experiences a surge of inflation pressure much like what the US saw this past week when CPI jumped to 3.8% y/y and core CPI increased to 2.8% y/y. More lies ahead.
Enter charts 1–2. What happens to inflation in one country doesn’t just stay in that country; it reflects some common drivers across integrated economies and supply chains with some similarities and differences between them.
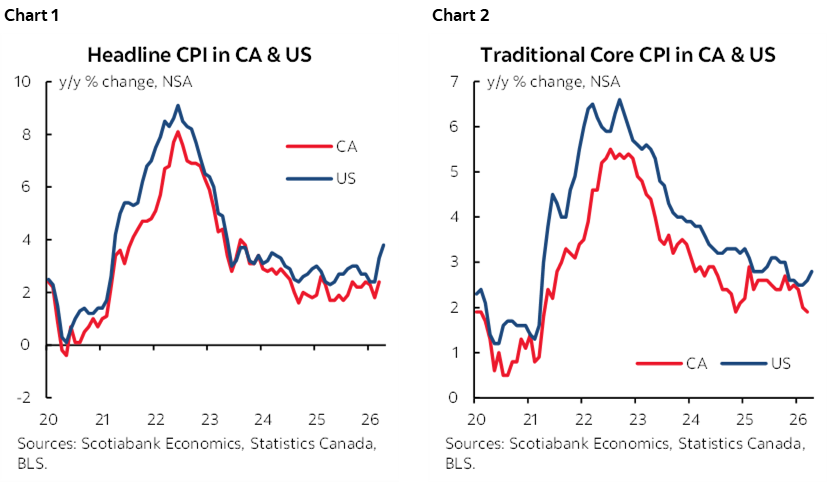
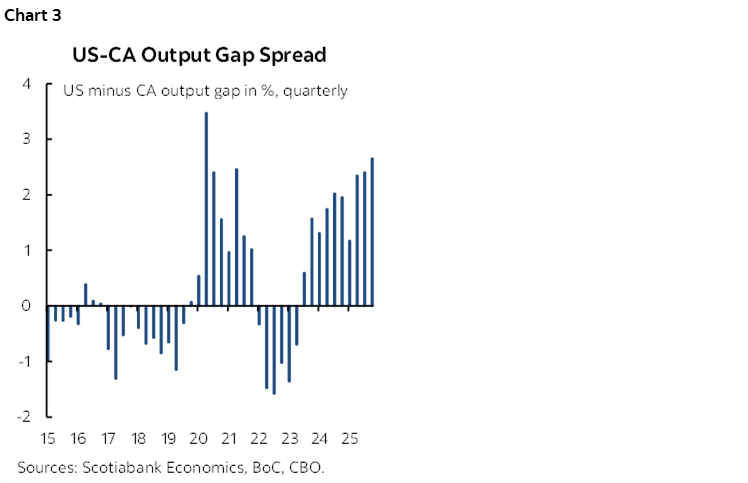
There are important measurement differences—like US OER and rent versus Canadian builder prices and rent in CPI—but in general total inflation and core inflation (ex-food and energy) are both highly correlated in the two countries over time. There are gaps that can be partly explained by differences in measures of spare capacity in the two economies (chart 3) but their inflation rates are still very highly correlated with only a modest share of the divergence explained by relative slack.
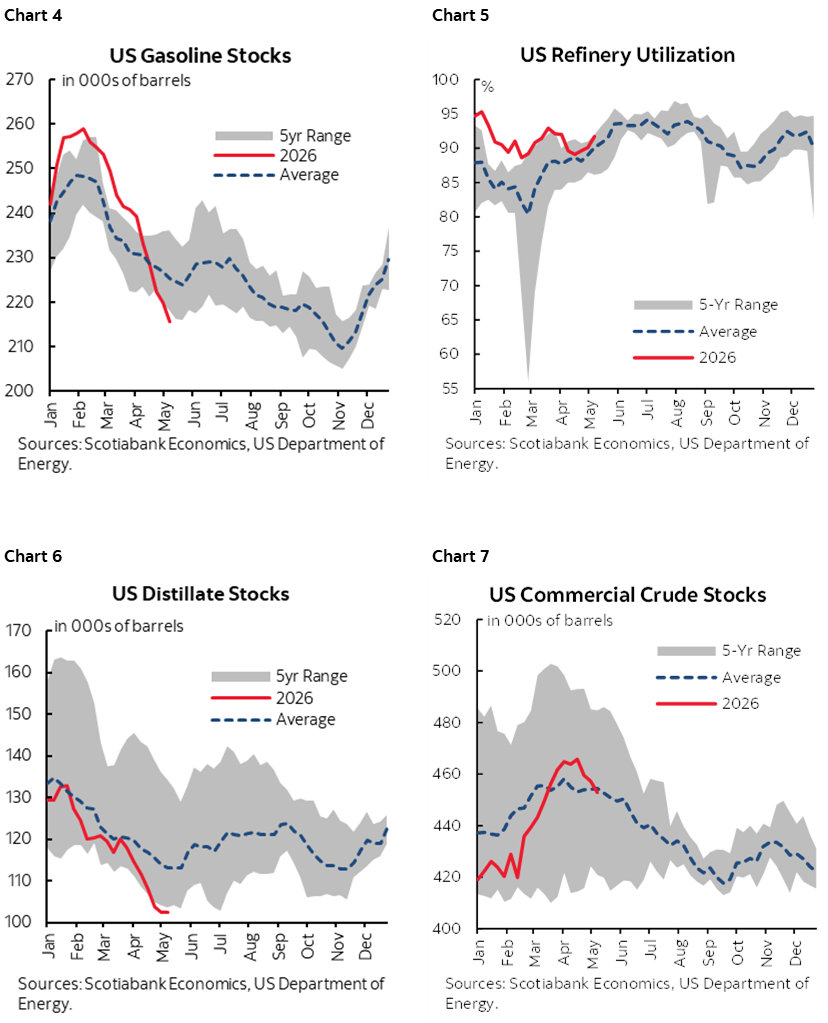
Where a common driver comes in is likely to be further upward pressure upon gasoline prices in both countries as it’s by no means clear they are close to a peak. Canada and the US are experiencing leaner gasoline and distillate stocks than would be normal at this point in Spring as Jay Parmar’s charts 4–5 demonstrate. Gasoline refinery capacity utilization is already seasonally high (chart 6). They are tighter markets than crude stocks (chart 7). Abnormally lean inventories into the summer driving season are why energy analysts point to expectations of further upward pressure on gas prices than the present roughly US$4.6/gallon across all grades in the US and nearly C$2/litre for regular gas in Canada. US$5–6/gallon and $2.5–3/litre in Canada are not stretches.
The WTI futures curve is at its highest this year (chart 8). So are gasoline futures prices (chart 9). Non-energy spot prices continue to soar (chart 10). Further, non-energy futures prices are up sharply including USD gains of 22% ytd for aluminum, around 15% for copper and nickel, 14% for soybeans, 9% for live cattle and sharp gains for wheat. Most econometric models in Canada don’t even include the effects of non-energy commodity prices and are thus wearing horse-blinders when it comes to evaluating these effects which is an important point to recall when considering their outputs for growth, inflation, incomes, rates etc. Surging Canadian export prices over import prices is like importing higher incomes through the back door (chart 11).
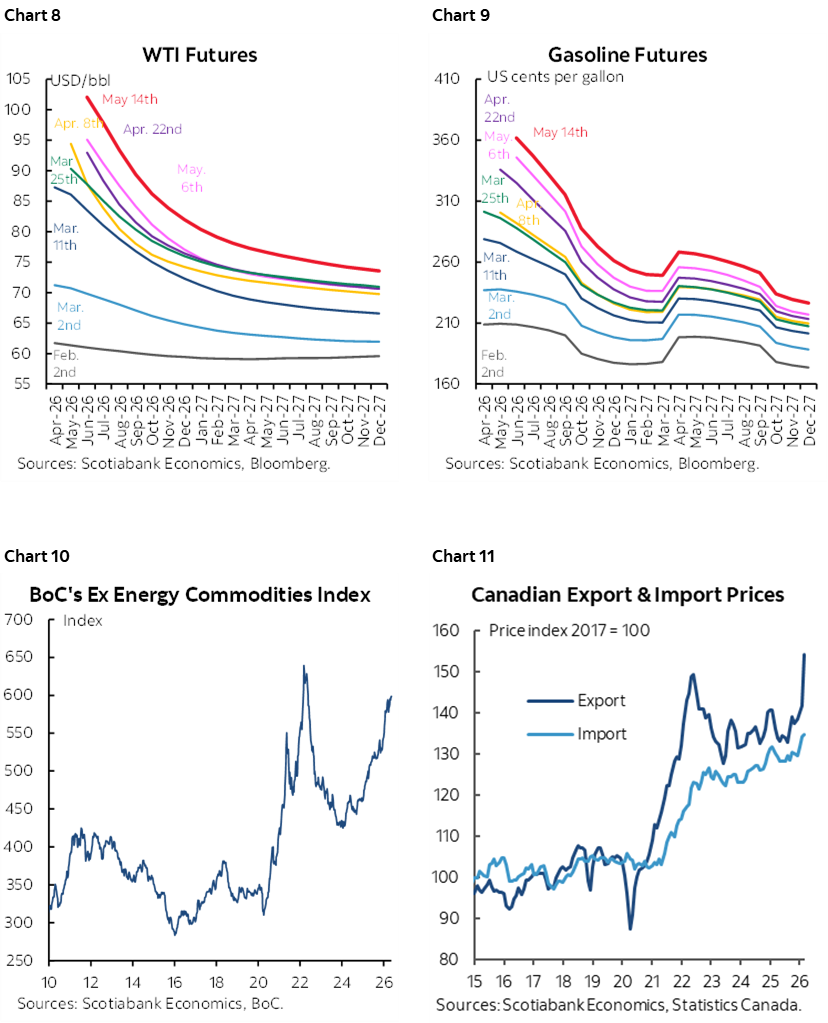
There are also important implications for relative policy rates. On that count, it’s the real (inflation-adjusted) policy rate that matters, not the nominal rate. As chart 12 shows, the Fed is still marginally in positive real rate territory, although less so than previously which reflects some degree of accommodating the commodity shocks.
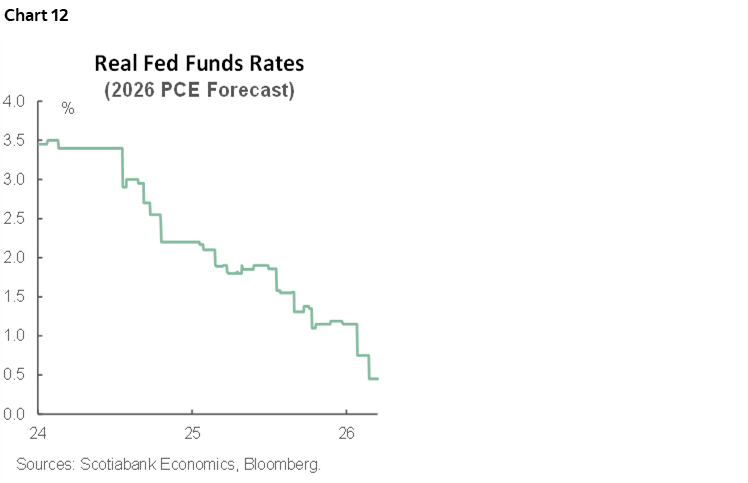
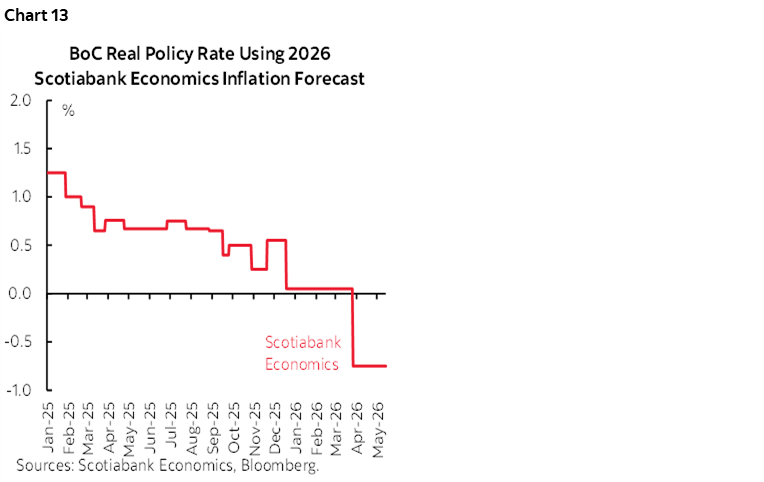
As chart 13 shows, however, Canada is in negative real rate territory and it probably hasn’t hit bottom yet. I think our house forecast for inflation is on the low side and so the real rate is likely more negative than shown. The Bank of Canada is easing into a positive commodity shock to a country that produces a lot of them.
This is an unusual stance as fiscal policy also applies stimulus and Q1 GDP growth is tracking higher than once feared with the consumer playing a significant part (see later). Trade policy concerns are exaggerated as most Canadian exports to the US are compliant with the CUSMA/USMCA agreement at a depreciated and hence more competitive currency. My view remains that Trump will sing like a canary in settling for trade deals before a new Congress convenes in January and perhaps before the midterms. To go through two years of utter turmoil on trade that is making Americans pay higher prices with no grand deals would be failure.
The Federal Reserve is better positioned to handle the inflation shock going into inflation fears than the Bank of Canada is because the Fed has not turned as accommodative on the inflation shock.
With that, we turn to a preview of next week’s Canadian inflation figures before then considering other expected developments in a lighter than usual week. They will include Nvidia’s earnings on Wednesday (consensus EPS US$1.76), FOMC minutes, Bank Indonesia’s policy decision, global PMIs, Canadian consumer spending and GDP tracking, UK PM Starmer’s problems, UK jobs and inflation, Aussie jobs and a few GDP reports. Any spillover effects of the underwhelming US-China Summit and further developments concerning Iran may also lie in store.
CANADIAN CPI—WHO STOLE MY TAX CUT?
Canada refreshes CPI figures for the month of April and this one could post a sharp acceleration that may challenge the Bank of Canada’s narrative.
I’ve estimated that CPI will rise by 1% m/m seasonally unadjusted (NSA), or about 0.9% m/m SA. That would be enough to raise the year-over-year rate to 3½%. There is a whole range of reasonable estimates between 0.5–1%+ m/m NSA but I’ll explain going relatively high.
First, note that the Bank of Canada’s April Monetary Policy Report said that inflation would crest at 3% y/y in April and then begin to turn lower. That may be aggressive and it’s unclear how the BoC may react to a material overshoot. 3% y/y in April would require that the month-over-month seasonally unadjusted change is no more than 0.5% NSA with no upward revisions given an unchanged year-over-year base effect even with the cessation of the consumer portion of the carbon tax last April.
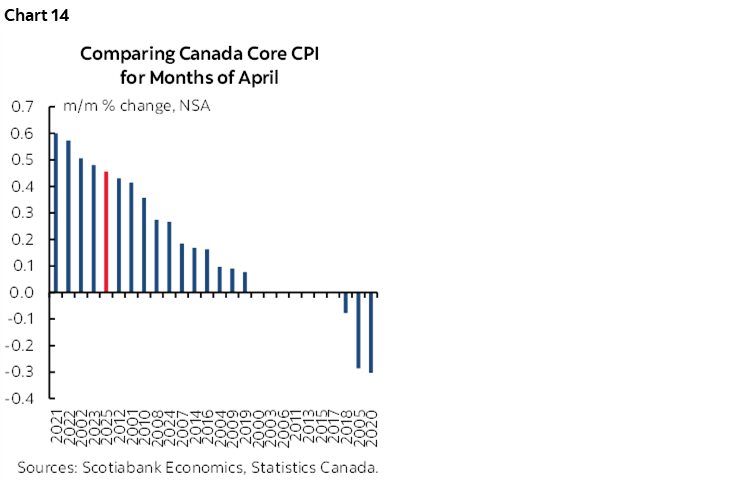
An overshoot is feasible. We know gasoline prices and on a weighted basis they should contribute about 0.3% m/m NSA. Furthermore, April is normally a seasonal up-month for prices especially in recent years with core CPI likely to rise by 0.3–0.5% m/m NSA and I went relatively high on this factor (chart 14). This means that CPI could rise by 0.5% or more on just gasoline (0.3) and seasonal influences (anything 0.2 or over) before considering other factors.
Hoping for the fuel tax suspension that was implemented in April until Labour Day in September to drag the figures down is a pipe dream. First, the weighted effect if implemented at the start of the month would only be about a 0.2% m/m weighted drag on m/m CPI. The cut, however, was only implemented on April 20th and so the prorated impact on April CPI would only be about a half of one-tenth of a percentage point or less.
Furthermore, as a warning to the US that is reportedly considering a similar move, chart 15 shows where the money went. Refiners’ margins have risen by about fifteen cents per litre of gasoline since the fuel tax suspension (here). Refiners’ margins are calculated as the spread between the wholesale price of gasoline and the price of crude oil including transportation costs. Refiners’ margins now stand at a record high in cents per litre terms. The explanation for this lies in some combination of crowding-in the vacated tax space and the economics of the gasoline market that is tighter than the crude market. These folks make a similar argument for the US.
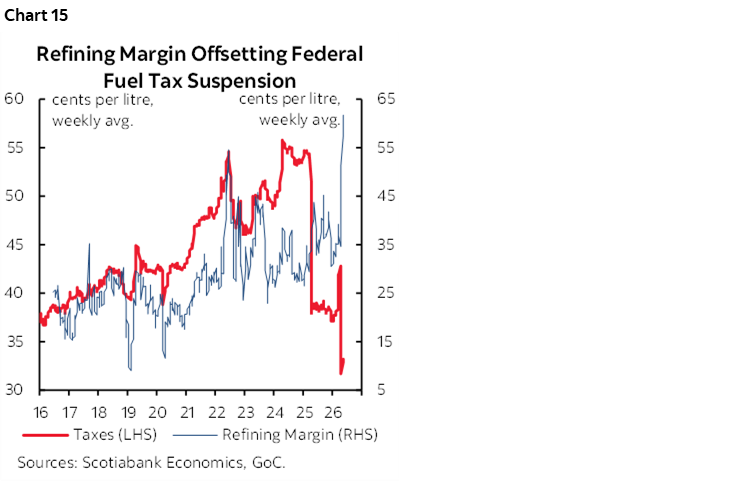
This shouldn’t come as much of a surprise. Changes in taxes like fuel excise or GST/HST taxes often invite incidence effects that can invite companies to crowd in space vacated by tax cuts by raising their own prices. That invites whether they are pursued as good economics or merely good politics.
There is a host of other factors that could add heat to April inflation. One is food prices for which I’ve only gone with a weighted 0.1% m/m NSA contribution to CPI. Another is the potential reversal of outlier moves among major price categories in March that were to the downside, like household operations and furnishings as well as clothing. Those two categories each shaved a weighted 0.1% m/m off CPI in March and were either side of 1% weaker than a normal m/m change.
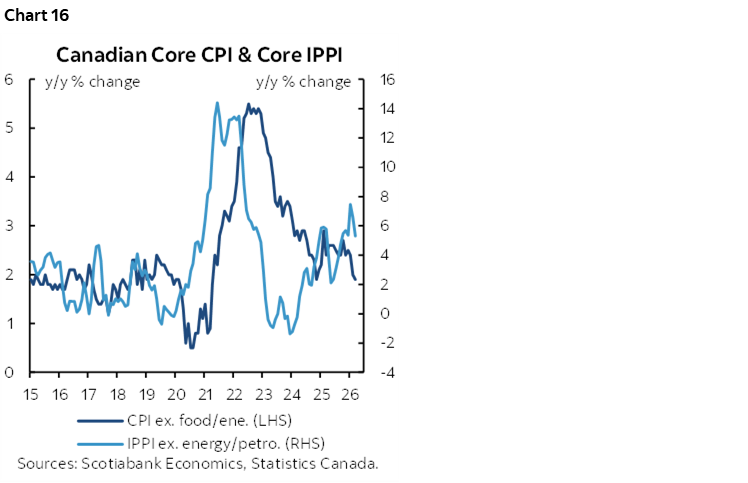
What may be more difficult to estimate is potential pass through of higher commodity prices. That may be too soon to expect but is likely coming into the summer months. As previously noted, the whole WTI oil futures curve has pushed to new wartime highs and the Bank of Canada’s commodity price index excluding energy is also approaching its prior peak during the outburst of inflation in the pandemic.
If passthrough arrives, then the lagging effects on core inflation from pre-war producer price pressures could be reinforced. Chart 16 shows the movement in core industrial prices and core CPI; we’re getting to roughly the point at which core CPI should be seeing pass through from pre-war influences, let alone wartime effects. And on that note, April’s producer prices will be updated on Friday.
In addition to uncertainty around the estimate, there is uncertainty around how the Bank of Canada could react should CPI already be tracking higher than they had hoped. Oil prices are moving in the direction of the BoC’s inflation shock scenario that warranted tightening as laid out in their April MPR. This is the last CPI reading before the June 10th BoC decision sans forecasts (next forecasts in July). A lot of other data will be on tap before that decision, however, including Q1 GDP (May 29th) and another jobs report on June 5th. External factors such as developments in the Middle East and external data could also sway the BoC’s bias.
I think there is a high bar set against moving the policy rate as soon as June but if CPI performs above the BoC’s expectations next week then OIS pricing by individual months could be affected from June onward.
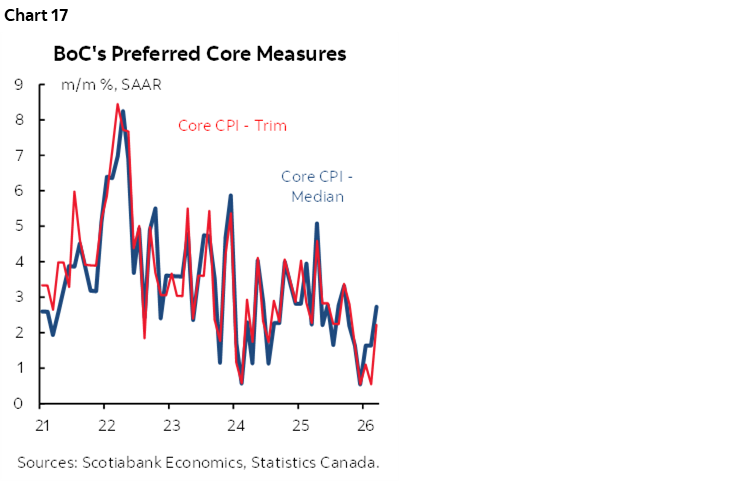
What will help settle the matter may be tracking of core inflation. There were nascent signs that Canada may have been emerging from an inflation soft patch in March—similar to early 2024—and we’ll be looking for any additional trend signals (chart 17). Recall that weighted median CPI was quite low for four months and then suddenly jumped to 2¾% m/m SAAR in March. Trimmed mean CPI was also low for four months and then climbed by 2.2% m/m SAAR. Traditional core CPI ex-food and energy, however, dropped to 0% m/m SAAR with a negative revision partly due to clothing and household ops/furnishings prices. It’s kind of silly in my view to still hear people talking of that inflation soft patch in a totally different world going forward.
CENTRAL BANKS—HOW MANY DISSENTERS?
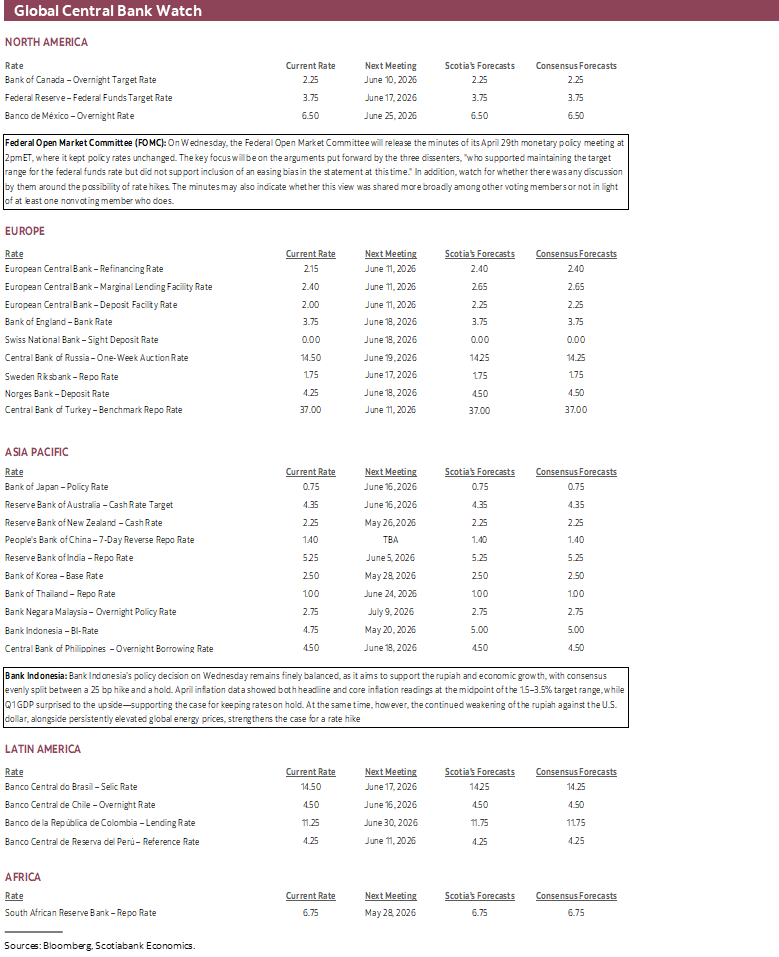
This will be a very light week for global central banks with most of the focus on FOMC meeting minutes as only one regional central bank is expected to weigh in against a divided consensus.
FOMC Minutes—How Many?
Wednesday’s FOMC minutes (2pmET) may add more insight into the divisions between hawks, neutral voices and doves.
We know that three FOMC officials—all regional presidents—explicitly dissented against language in the May statement that left the door open to a possible easing bias (Logan, Kashkari, Hammack). One more (Boston’s Collins) later revealed that she was a non-voting supporter of the dissenters. That makes almost one-quarter (4) of the 17 FOMC members and one-quarter (3) of the voting FOMC members who officially opposed any hint at easing. Will others be revealed? Watch the language that cites frequency of citation for an indication (one, a couple, a few, some, several, many, most etc).
The rest of the US calendar will be very light. Only weekly ADP private payrolls (Tuesday), pending home sales for April (Tuesday), jobless claims (Thursday) and housing starts for April (Thursday) are due out. There will be an early market close next Friday ahead of the Memorial Day long weekend.
Bank Indonesia—Growth and Stability
Only one regional central bank is scheduled to meet this week, with consensus evenly split between a 25 bps hike and a hold. Given the bank’s history of delivering surprises, such a divided outlook is nothing new.
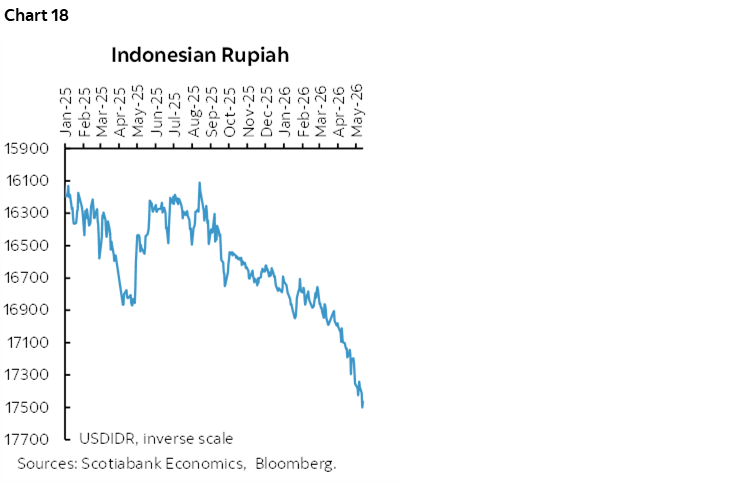
Bank Indonesia’s policy decision on Wednesday remains finely balanced. April inflation data showed both headline and core readings at the midpoint of the 1.5–3.5% target range, supporting the case for keeping rates on hold. At the same time, however, the continued weakening of the rupiah against the U.S. dollar (chart 18), alongside persistently elevated global energy prices, strengthens the case for a rate hike. Q1 GDP also surprised to the upside, expanding by 5.6% y/y.
UK TURMOIL — LESSONS FOR CANADA
The approaching 10-year anniversary of the Brexit vote is plodding ahead toward possibly the sixth prime minister since then as PM Starmer appears to be on the ropes. Japanese-style political instability is causing a renewed lack of confidence in UK markets in a lesson to Canadian separatists that would invite effects that would make Brexit look like child’s play as argued in this past week’s weekly that had a whole focus section on separation risk in Alberta and Quebec.
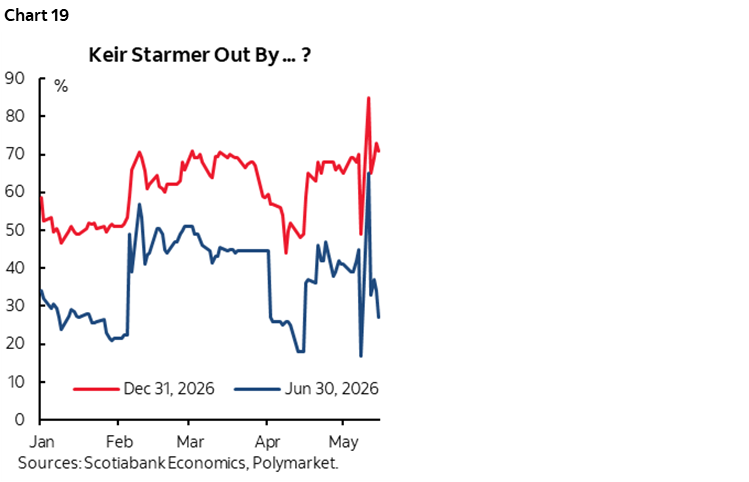
To briefly sum up developments, Labour’s Health Secretary, Wes Streeting, resigned the other day to pave the way for Manchester Mayor Andy Burnham to run for parliament and contest Starmer’s leadership via a br-election in Makerfield. No date has been set and it’s not assured that Burnham will a) win Labour’s nomination and then b) win against Reform and the Greens. Starmer has faced a cabinet revolt and is deeply unpopular among voters with a YouGov polling showing that 69% of voters view him unfavourably. The lottery ticket crowd on Polymarket is betting that Starmer will be toast by year-end (chart 19).
Markets are trading on the view that Burnham would drive a major surge of gilts issuance and sharply relaxed fiscal policy; hello Liz. Of course he can say whatever when unencumbered by the constraints of office and would have to be judged by his stances in office and by what is viewed to be passable in Parliament with markets applying some discipline, but he has somewhat derisively said that the UK government had to “get beyond this thing of being in hock to the bond markets.” Burnham wouldn’t be the first naïve politician to dismiss bond markets only to be disciplined by them and himself could be a short-lived leader like Truss if he acted on his rhetoric and assuming he can topple Starmer which may not be too difficult to do.
So what’s he all about that has gilts and sterling on edge? Burnham has favoured halving income taxes, lowering rents, utility bills, and transportation fares. Free utilities circa 1917 Bolsheviks?? Oh boy, better get ready for crammed subways and brownouts. He has advocated a plan to build dollops of new homes. He has sounded supportive of ramping up defence spending in a way that would fall outside of the budget. Cha-ching. Promises promises, how ya gonna pay for it all? These are knee-jerk reactions in markets in my opinion but the path will be informed by a series of possible next steps over coming weeks and months.
GLOBAL MACRO
The rest of the calendar-based line-up will have a handful of key factors to consider. Global purchasing managers’ indices will offer a soft data take on the current state of global supply chains. FOMC minutes, Canadian consumers, key UK data on jobs and inflation, Australian jobs, Bank Indonesia’s latest decision and a few GDP reports will round it out. Jay and I will partner on parts of what follows.
Global PMIs—Illusory Resilience?
Global purchasing managers’ indices will be updated with monthly readings for May. Japan and Australia kick it off on Wednesday evening followed by India, then the Eurozone and UK into Thursday morning followed by the US.
Recall that the last round of PMIs offered somewhat of an illusory sense of resilience. They signalled that growth was holding up, but primarily because of order front-running and stockpiling in anticipation of higher prices being passed through alongside supply shortages. Price guidance accelerated across markets to between the fastest inflation since the pandemic or on record depending on the country. At some point the order front-running phase will mature and give way to dealing with accelerating prices but it’s unclear if that will happen just yet.
Canadian Consumers & GDP—Facts Versus Gloom
Canada only refreshes retail sales for March with April guidance on Friday once inflation is out of the way. Key will be to apply some facts to the often excessively gloomy coverage.
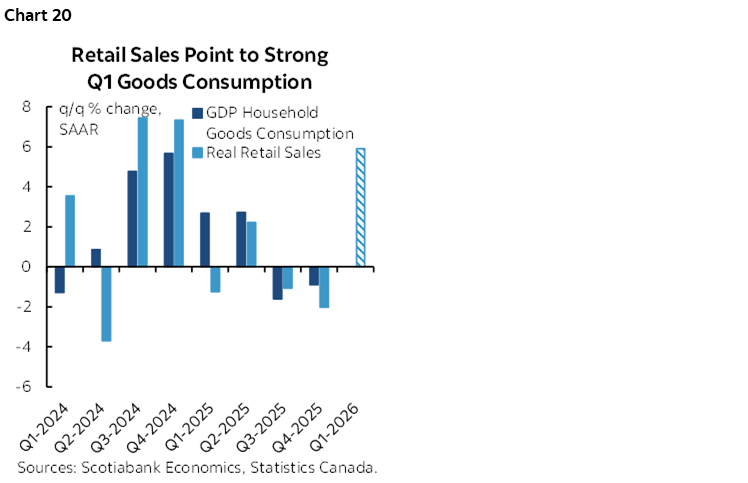
Canada has been tracking Q1 retail sales volume growth of around 6% q/q SAAR which aligns with around 4% q/q SAAR growth in goods consumption (chart 20) alongside healthy proxy measures for spending on services. Statcan had guided that March was tracking a nominal retail sales gain of 0.6% m/m SA. Details including volumes will be important to further inform the health of the consumer. Statcan will also simultaneously release April’s retail sales nominal growth estimate sans details.
The consumer was looking rather buoyant to start off 2026. Pessimists—who were wrong with their gloom coming into Q1—will dismiss that strength as something to fade in the face of a commodity shock. We’ll see, as commodity rallies in Canada tend to be followed by buoyant growth in aggregate household incomes in Canada —perhaps just not in Ottawa—while consumers allow the saving rate to adjust lower to keep on spending.
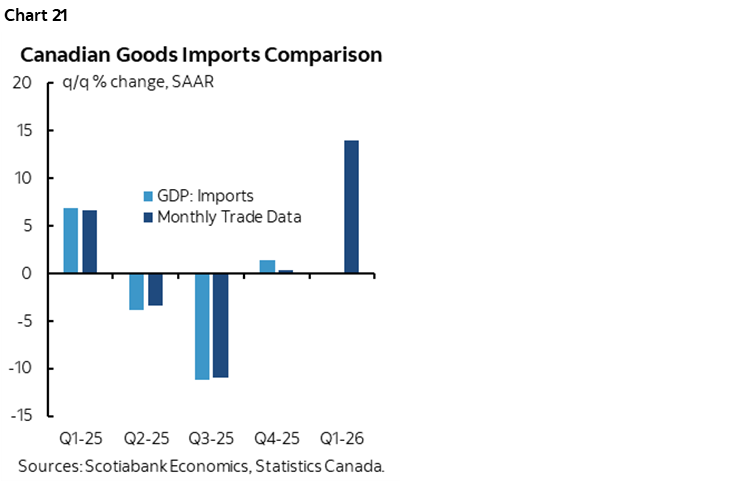
Regardless, there are implications for Q1 GDP tracking. Consumption appears to be strong. Inventories are likely to rebound from the 4% weighted drag on Q4 GDP and because of surging imports that may have occurred in order to front-run expected price increases as in the US (chart 21). An import gain as an import leakage effect from GDP could offset an inventory contribution to growth, leaving us to focus on what could be rather strong final domestic demand. Rate sensitive spending is getting a lift from other things like government spending. From very little to no growth expected or being previously tracked in Q1 at the start of the year, 2% q/q SAAR now seems plausible which would be double the estimate potential growth rate, thereby narrowing some slack in the economy just as commodities add inflation risk in addition to prior pre-war movements in producer prices. There may be upside to this Q1 GDP estimate given, for example, that we really have little ability to estimate the inventory side of the equation since Canadian monthly inventories are only available for manufacturing and wholesale whereas we get quarterly retail, resources and agricultural inventories after the fact.
UK Jobs, Wages, and CPI—One of Two Rounds Before the BoE
In the coming week, the UK will provide further updates on labour market conditions for March and April on Tuesday, followed by April inflation data on Wednesday, ahead of another set of labour market and inflation releases due shortly before and on the Bank of England’s June 18th monetary policy meeting.
Given the ONS labour data's low response rates and elevated revision risk, the focus will be on the underlying trends rather than any single release. The UK's official employment data, which lags by a month, has risen in four of the past five months through February, while the unemployment rate fell to 4.9% from 5.2% previously. By contrast, payroll data, after revisions, has shown two consecutive months of decline following earlier modest gains. However, the next batch of releases will be key in assessing how the labour market is evolving through the Middle East conflict period and will better inform the Bank of England's policy outlook.
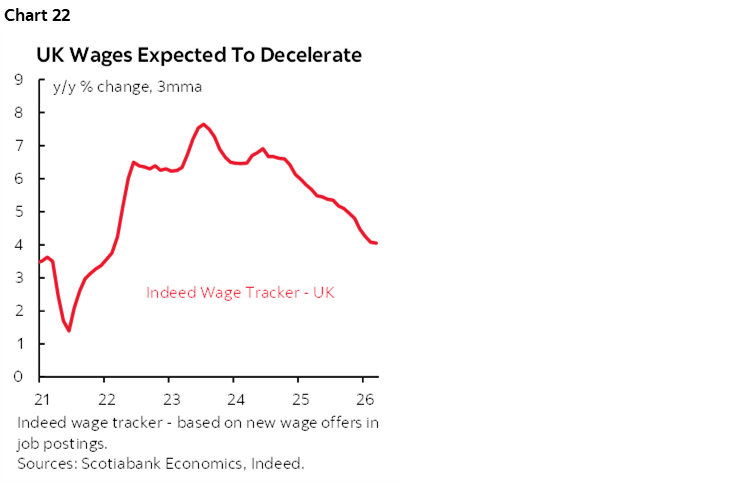
Importantly, progress has been made in stabilizing wage growth, which has moderated to around 2.5% on a three-month moving average basis, with the Indeed wage tracker pointing to further deceleration (chart 22). Core inflation in March was broadly in line with typical month of March, though it remains early to assess second-round effects. April's readings will provide further clarity on the trend, particularly around any persistence from second-round pressures and ongoing stickiness in services inflation.
Australian Jobs—RBA Likely to Hold in June Regardless of Jobs
Australia will also release its April labour market data on Wednesday, and it has continued to show resilience, with year‑to‑date job gains of around 90k. However, the unemployment rate has edged up by two‑tenths to 4.3% from a recent low of 4.1%. Markets are currently pricing in around a 20% chance of a rate hike at the June 16th meeting, with a full hike priced by August. Any upside surprise in the labour market data might increase the probability of a June move, with another inflation print and Q1 GDP data due ahead of the meeting.
Nevertheless, the RBA had guided a pause when Governor Bullock said at the last meeting that the RBA can now “sit and see what happens.”
Stale Q1 GDP Readings
Just as markets largely ignored solid UK macro readings for Q1, they are likely to do the same for a batch of GDP readings due out from other countries this week.
Japan’s economy probably posted growth of around 1½% q/q SAAR in Q1 (Monday). Chile’s economy may remain on a slowing trajectory for y/y GDP growth toward 1% (Monday). Germany issues Q1 GDP revisions to the original 0.3% q/q SA estimate of marginal growth and this time releases details with the report.
Monthly economic activity proxies for growth will be released by Peru (Monday), Mexico (Friday) and Brazil (Friday).
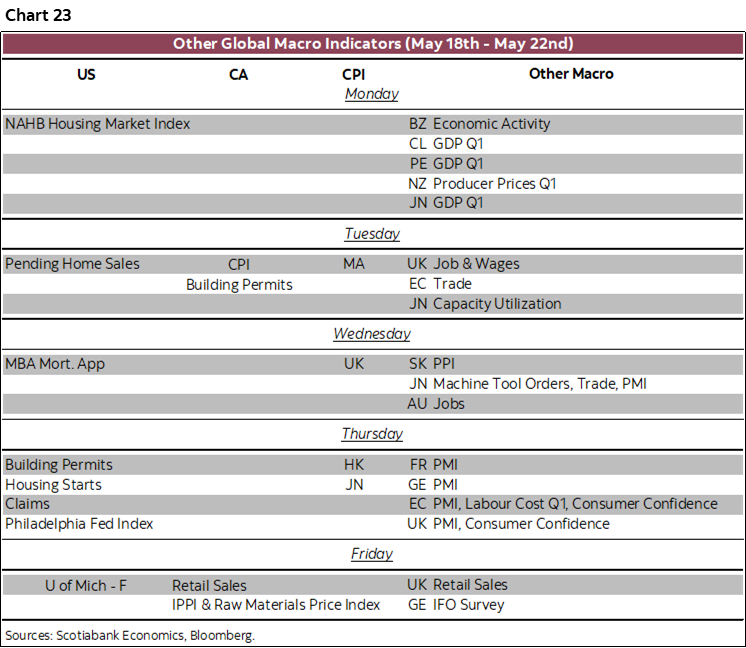
See chart 23 for the layout of other releases by country and day.

DISCLAIMER
This report has been prepared by Scotiabank Economics as a resource for the clients of Scotiabank. Opinions, estimates and projections contained herein are our own as of the date hereof and are subject to change without notice. The information and opinions contained herein have been compiled or arrived at from sources believed reliable but no representation or warranty, express or implied, is made as to their accuracy or completeness. Neither Scotiabank nor any of its officers, directors, partners, employees or affiliates accepts any liability whatsoever for any direct or consequential loss arising from any use of this report or its contents.
These reports are provided to you for informational purposes only. This report is not, and is not constructed as, an offer to sell or solicitation of any offer to buy any financial instrument, nor shall this report be construed as an opinion as to whether you should enter into any swap or trading strategy involving a swap or any other transaction. The information contained in this report is not intended to be, and does not constitute, a recommendation of a swap or trading strategy involving a swap within the meaning of U.S. Commodity Futures Trading Commission Regulation 23.434 and Appendix A thereto. This material is not intended to be individually tailored to your needs or characteristics and should not be viewed as a “call to action” or suggestion that you enter into a swap or trading strategy involving a swap or any other transaction. Scotiabank may engage in transactions in a manner inconsistent with the views discussed this report and may have positions, or be in the process of acquiring or disposing of positions, referred to in this report.
Scotiabank, its affiliates and any of their respective officers, directors and employees may from time to time take positions in currencies, act as managers, co-managers or underwriters of a public offering or act as principals or agents, deal in, own or act as market makers or advisors, brokers or commercial and/or investment bankers in relation to securities or related derivatives. As a result of these actions, Scotiabank may receive remuneration. All Scotiabank products and services are subject to the terms of applicable agreements and local regulations. Officers, directors and employees of Scotiabank and its affiliates may serve as directors of corporations.
Any securities discussed in this report may not be suitable for all investors. Scotiabank recommends that investors independently evaluate any issuer and security discussed in this report, and consult with any advisors they deem necessary prior to making any investment.
This report and all information, opinions and conclusions contained in it are protected by copyright. This information may not be reproduced without the prior express written consent of Scotiabank.
™ Trademark of The Bank of Nova Scotia. Used under license, where applicable.
Scotiabank, together with “Global Banking and Markets”, is a marketing name for the global corporate and investment banking and capital markets businesses of The Bank of Nova Scotia and certain of its affiliates in the countries where they operate, including; Scotiabank Europe plc; Scotiabank (Ireland) Designated Activity Company; Scotiabank Inverlat S.A., Institución de Banca Múltiple, Grupo Financiero Scotiabank Inverlat, Scotia Inverlat Casa de Bolsa, S.A. de C.V., Grupo Financiero Scotiabank Inverlat, Scotia Inverlat Derivados S.A. de C.V. – all members of the Scotiabank group and authorized users of the Scotiabank mark. The Bank of Nova Scotia is incorporated in Canada with limited liability and is authorised and regulated by the Office of the Superintendent of Financial Institutions Canada. The Bank of Nova Scotia is authorized by the UK Prudential Regulation Authority and is subject to regulation by the UK Financial Conduct Authority and limited regulation by the UK Prudential Regulation Authority. Details about the extent of The Bank of Nova Scotia's regulation by the UK Prudential Regulation Authority are available from us on request. Scotiabank Europe plc is authorized by the UK Prudential Regulation Authority and regulated by the UK Financial Conduct Authority and the UK Prudential Regulation Authority.
Scotiabank Inverlat, S.A., Scotia Inverlat Casa de Bolsa, S.A. de C.V, Grupo Financiero Scotiabank Inverlat, and Scotia Inverlat Derivados, S.A. de C.V., are each authorized and regulated by the Mexican financial authorities.
Not all products and services are offered in all jurisdictions. Services described are available in jurisdictions where permitted by law.