

Next Week's Risk Dashboard
- BoC to wish everyone a pleasant summer as pressure builds
- Fed Chair Warsh to deliver two rounds of Congressional testimony
- Why Fed hikes could be policy error…
- …that risk putting its independence back on trial…
- …while imperiling what the taskforces could achieve
- US CPI and PPI to inform the Fed’s preferred inflation gauge…
- …and watch super-supercore CPI
- US Q2 earnings season begins in earnest
- BoK expected to hike
- China’s economy to post subdued GDP growth
- Global macro — US retail, light Canadian releases, UK data dump, Indian CPI
Chart of the Week
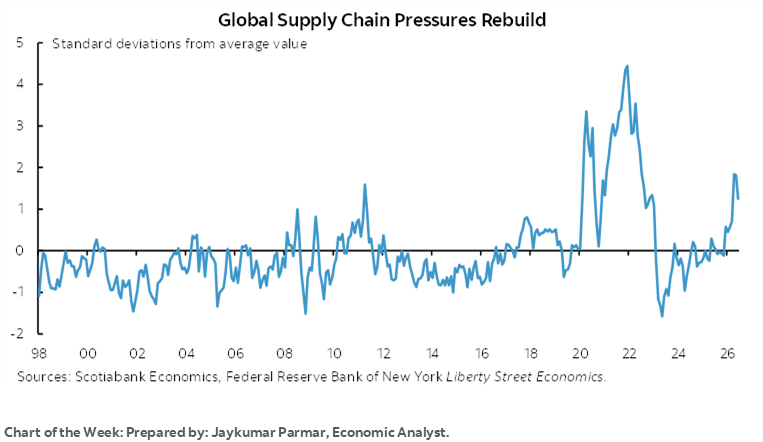
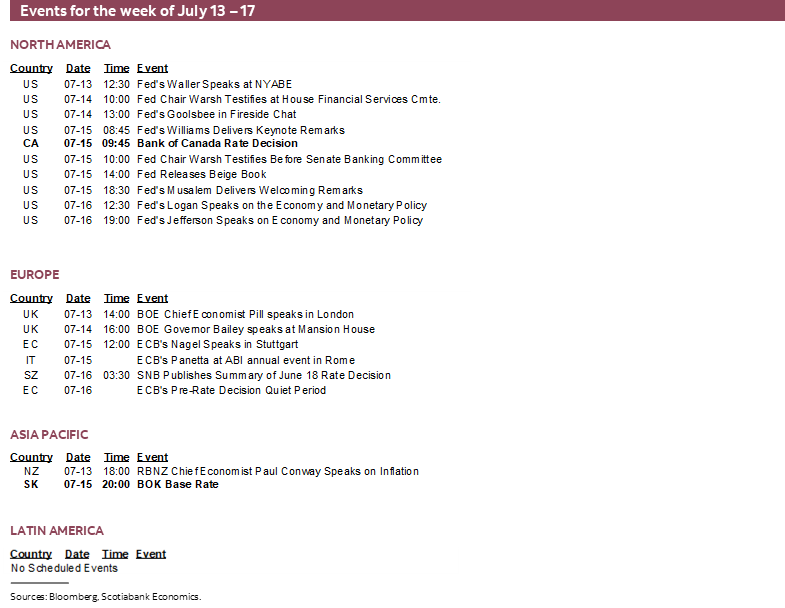
This could be a week to remember for economics and markets junkies. It will bring out a combination of central bank decisions (BoC, BoK), in-depth Congressional testimony from Chair Warsh, the unofficial start of the US earnings season with a focus upon US financials, potentially further turmoil in the Middle East, and quite a few top shelf readings like US CPI and retail sales, Chinese GDP, and a wave of UK releases among others. Peak days for market risks will be Tuesday and Wednesday. Let’s get right to it with a full BoC preview and an explanation of why I think it could be policy error should Chair Warsh more openly signal appetite for tighter monetary policy that could wind up putting the Federal Reserve back on trial with renewed challenges to its independence while imperiling its work on taskforces.
BANK OF CANADA—ENJOY YOUR SUMMER
It will be the full deal being delivered by the Bank of Canada on Wednesday morning. The policy statement and Governor Macklem’s opening written remarks to his press conference arrive at 9:45amET along with the Monetary Policy Report including fresh forecasts. That will be followed by the press conference at 10:30amET for around 45 minutes or so, plus customary media interviews later on.
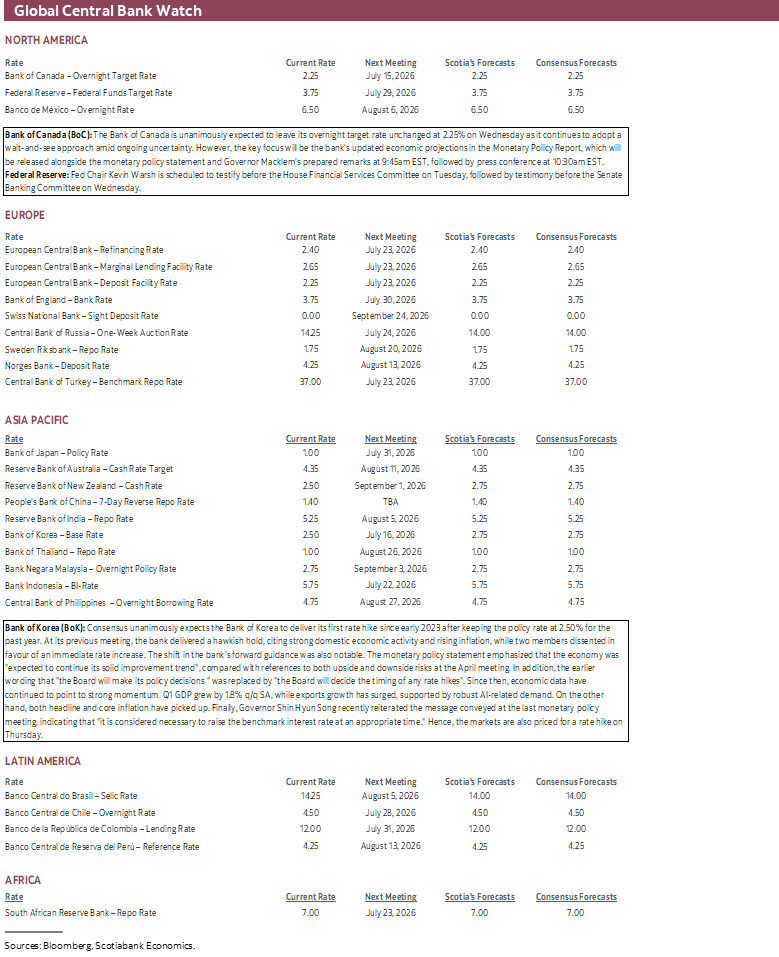
No policy changes are expected at this time. The policy rate is widely expected to remain unchanged at 2.25%. Forward guidance will probably be the usual blend of caginess marked by a blend of monitoring data, the war with Iran and commodity effects, trade negotiations etc. No changes to balance sheet plans are expected but perhaps we’ll hear more about Macklem’s recent ‘steady state’ remark.
Scotiabank Economics continues to project 75bps of rate hikes beginning in Q4 into Q1. We continue to believe growth is rebounding, pre-war inflation drivers will flow through as Canada continues to emerge from winter’s inflation soft patch, and off-peak but still higher commodity prices than earlier in the year flow through the economy and inflation. It’s also my continued belief that trade negotiations are an overstated threat.
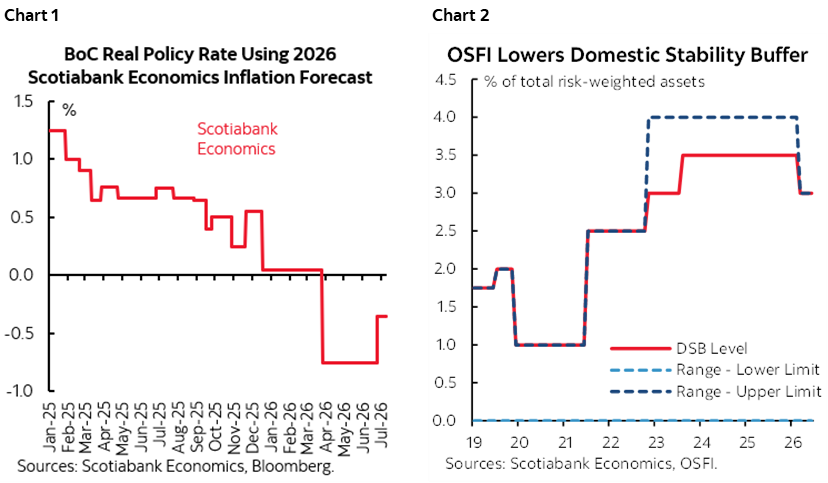
And yet key points on policy changes remain focused upon a) passive easing via allowing the real policy rate to plunge (chart 1), b) fiscal policy easing with more ahead into a Fall budget, and c) regulatory easing including OSFI’s recently announced reduction of capital requirements for banks (chart 2) that we figure was equivalent to about a quarter-point cut to the nominal policy rate.
Expected Statement Changes
Statements when new MPRs get delivered usually entail a full re-write relative to non-MPR statements like June’s. They are heavier on forecast updates and language which I’ll address in the next section.
There will be a few things to nevertheless watch for in the statement. They’ll signal lower energy prices this time, but presumably with caution given that the US-Iran MOU is on the thinnest of ice and given continental supply and demand imbalances in areas like gasoline and derivative markets.
They’ll probably continue to describe the US economy as “solid” but I think that’s an overstatement as argued elsewhere in this note.
They might argue that financial conditions have loosened further, given currency weakening since the June statement, given a flat 2-year GoC yield, and given gains in the local TSX stock market since June 10th.
They may pivot toward flagging the Q2 economic rebound in the statement while repeating that the economy remains in excess supply, albeit small in my view.
They will probably flag higher CPI inflation given that the April MPR said they expected inflation to peak at 3% y/y and yet it popped higher to 3.2% in May with June’s reading pending the week after the BoC’s communications.
The BoC may acknowledge the move higher in measures of inflation expectations contained within its Q2 surveys but may not if it chooses to flag them as stale on arrival.
Ultimately, the key will be the likely repetition of the line that says “we stand ready to respond” to bidirectional risks and that the BoC “is continuing to look through the war’s near-term impact on headline inflation, but will not let higher energy prices become persistent inflation.”
The latter line will buy them a hold through to September by which point we’ll have a lot more information at hand.
Forecast Changes—H1 GDP on Track, Inflation Up?
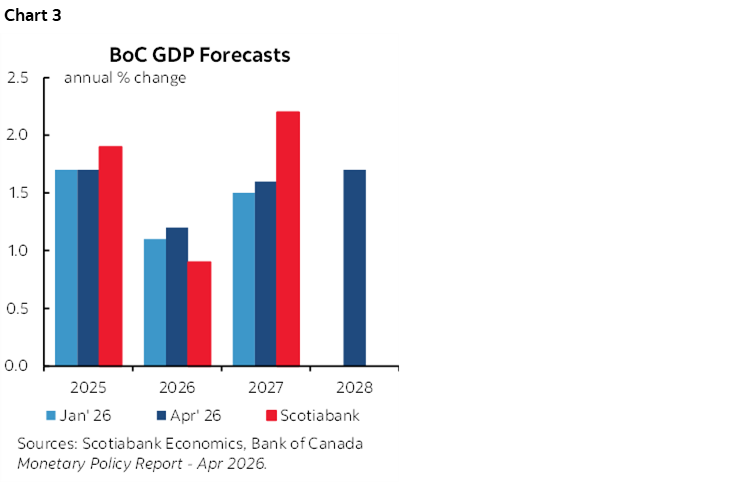
The BoC may need to revise down its 2026 GDP growth forecast in marked-to-market fashion after Q1 GDP disappointed at -0.1% q/q SAAR versus the BoC’s 1.5%. A partial offset may be to revise up its prior 1.5% forecast for Q2 as we’re tracking over 2% growth. Chart 3 compares our current forecast to the BoC’s April projection. The BoC has previously adapted its messaging following the Q1 disappointment to emphasize the rebound that is underway. What it signals for Q3 growth may inform expected sustainability.
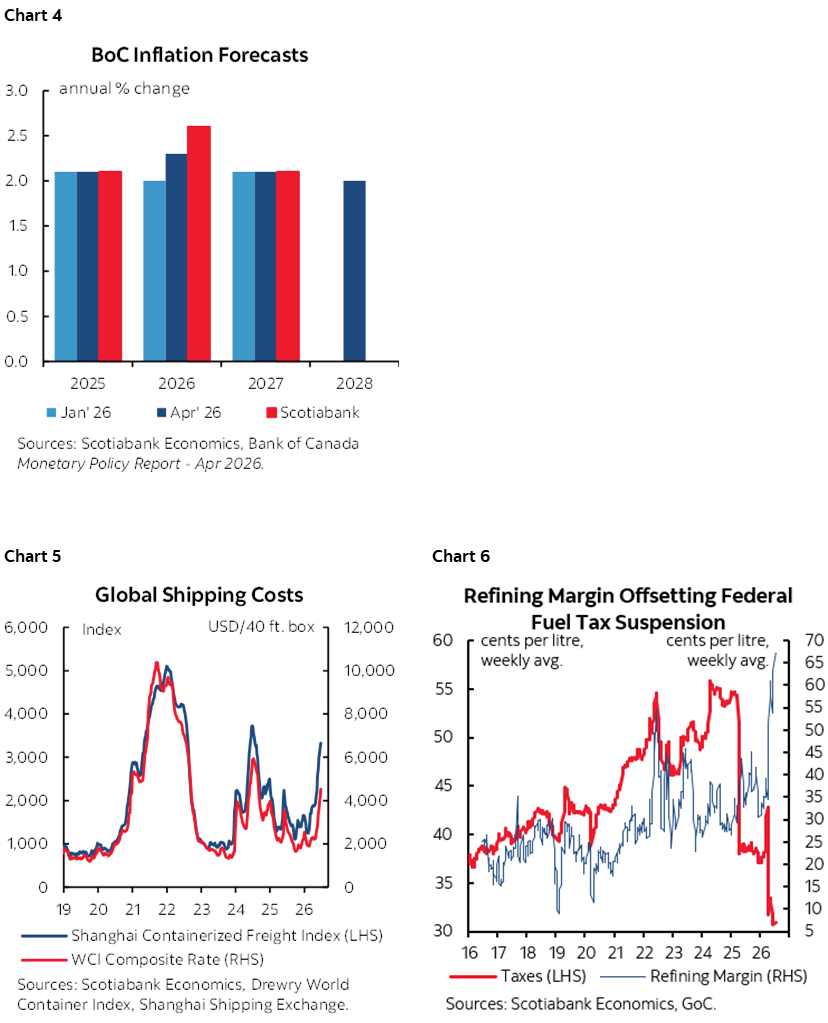
The rub lies in the fact that the BoC may choose to revise up its inflation forecast in 2026. Chart 4 compares our current inflation forecast to the BoC’s April MPR projections. Key may be if they agree with our 2027 view that remains in line with the BoC’s April projection. Two things to note include rising supply chain pressures manifest through shipping costs (chart 5) and that the fuel excise tax suspension is being absorbed in refiners’ margins and not passing through to consumers (chart 6).
Developments in the Middle East suggest that it would be highly premature to declare risks to energy and broader commodity markets to have diminished sustainably.
Recall, however, that a missing ingredient to the ability to evaluate their forecasts for growth and inflation relative to ours is their unknown rate path since the BoC does not provide explicit forward rate guidance.
There will be several newer pieces of information for the BoC to incorporate relative to its April forecasts.
Spot oil prices have dropped from about $100/barrel at the time of the April MPR to about $30 less now, but futures prices are only a little lower to what the April MPR had assumed by way of expectations for WTI to “settle around US$75 by mid-2027.” At the time of writing, the futures curve is only slightly lower by about $5–8/barrel relative to their April assumptions on the forward path (chart 7). Also of note is that commodity prices ex-energy have come off the peak but remain materially higher than year-end (chart 8).
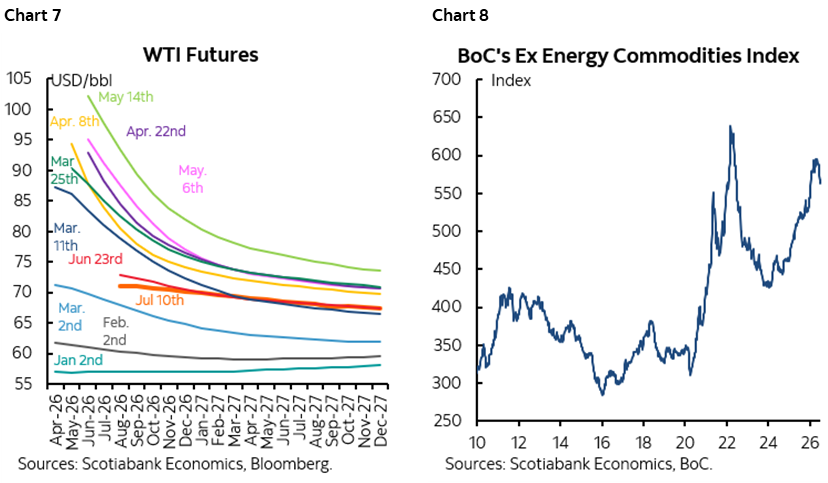
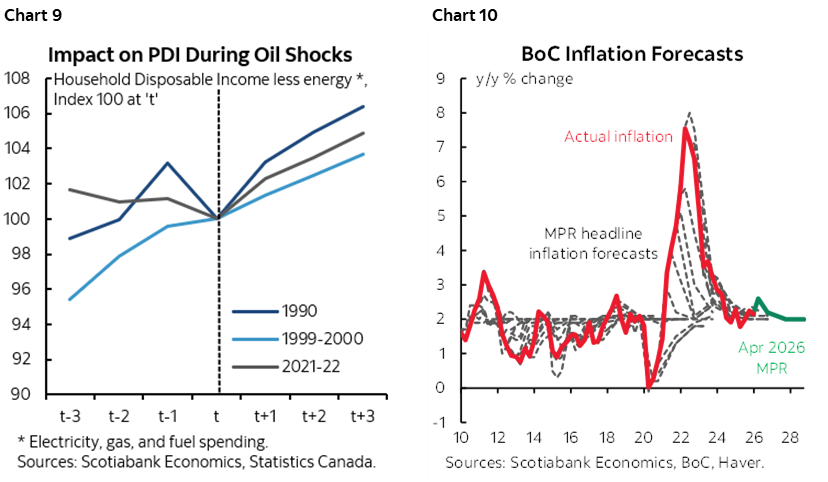
How the BoC plays the commodity story has so far been rather different under Governor Macklem than prior BoC regimes. Macklem has emphasized harm to the consumer from high commodities despite evidence that household incomes tend to hold up rather nicely in Canada when commodity prices rise (chart 9). He has so far placed little emphasis upon the terms of trade argument in that higher commodity prices drive more imported income into Canada that trickles down into improved fiscal balances, household incomes and corporate profits that in turn can drive faster economic growth. This style could reflect his dovish instincts as recognized by many European and Asian clients with whom I have met in Spring marketing and it’s not just him. Chart 10 shows that the BoC has a serial pattern of blowing its inflation forecasts by missing inflection points and chasing numbers higher over a long period of time. Or, Macklem could be acting patiently as former Governor Poloz did under different circumstances when he said nothing about tumbling oil prices over 2024H2 and then suddenly cut in January.
The BoC has yet to incorporate the Spring Economic Update that had applied extra stimulus. We expect this to marginally raise growth in 2026Q2 through 2027 compared to their April forecasts.
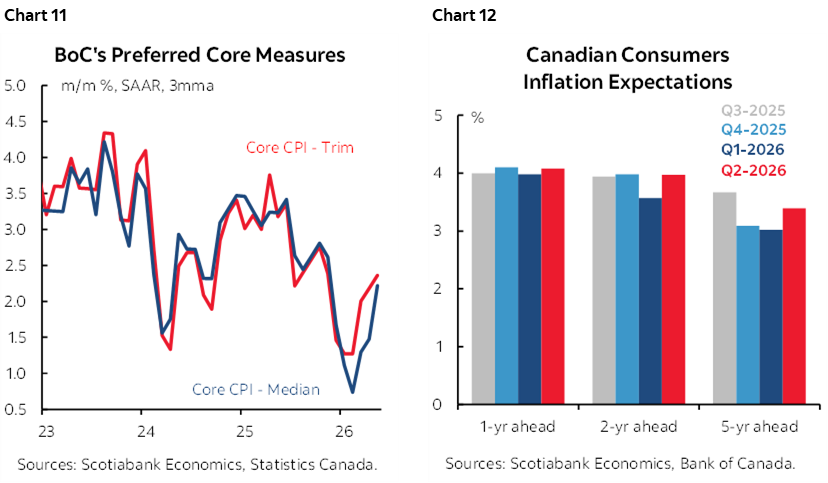
On data, apart from GDP, the BoC may be a little more positive on the job market given recent gains (recap here). On inflation, it has a choice. The least preferred choice would be to cite how trimmed mean and weighted median CPI are averaging just above 2% y/y which is what they are likely to do. I say least preferred because they are calculated on a compounded, weighted basis using m/m rolling contributions to the y/y rate which, in plain English, means they can be very slow moving and not representative of recent price pressures. The preferred choice would be to flag the evidence that Canada is leaving the inflation soft patch with accelerating m/m annualized readings (chart 11) and that consumers’ inflation expectations are above the top end of the BoC’s inflation target range across all horizons (chart 12).
On external developments, at the time of the April decision, USDCAD was trading at just under 1.36 versus the 1.41–42 range now. Part of the reason has been the shift in pricing toward tightening by the Federal Reserve, howsoever correct it may or may not be.
And on that latter count, the BoC is at the widest on the policy rate differential relative to the Federal Reserve. Should the Federal Reserve truly hike, then the BoC may come under greater pressure to follow and also join a growing chorus of tightening central banks around the world.
Balance Sheet—Define ‘Steady State’
No changes are expected in terms of balance sheet plans. The BoC typically says it will advise ahead of time should it plan to make changes. Tactical changes arrive in market notices. Updates and bigger plans get communicated through more formal speeches and typically from Deputy Governor Gravelle who heads the financial markets division. He may be overdue for such a speech, but I would watch for communications to arrive perhaps as soon as later in the year or into 2027.
Chart 13 shows balance sheet asset projections. The BoC has previously guided that it may return to gross purchases of Government of Canada bonds in 2027 after it ceased allowing the balance sheet to shrink primarily through repo as its late-2025 notice of intention to buy bills has been small potatoes thus far.
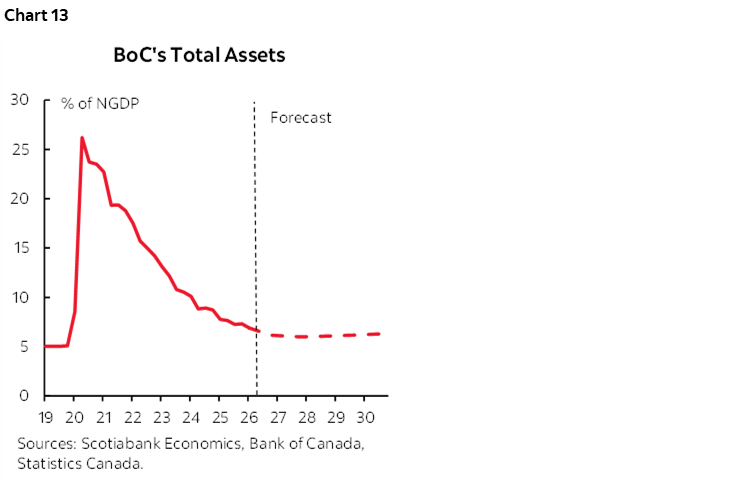
The path to a post-QE, normalized balance sheet has the BoC pursuing two goals. One is that it is targeting interest-bearing assets (repo and bills) to equal interest-bearing liabilities (settlement balances). The other is that it wishes to have GoC bond holdings equal currency in circulation. They remain some distance from achieving either of those goals and so perhaps Governor Macklem could clarify his comment at the ECB’s Sintra forum that the balance sheet has returned to a steady state. As maturing GoC bonds continue to drop off while currency in circulation continues to grow, my projections don’t point to gross bond purchases until well into 2027.
US CPI—WATCH SUPER-SUPERCORE!
By Wednesday, markets will have enough to go by to estimate the Fed’s traditionally preferred PCE inflation gauge that itself won’t come out until July 30th—the day after the FOMC’s decisions. CPI on Tuesday and select components from producer prices on Wednesday will serve as input. As crazy as it may sound, the communicated high degree of data dependency could mean that the readings will influence the bias though probably not the actual decision later this month.
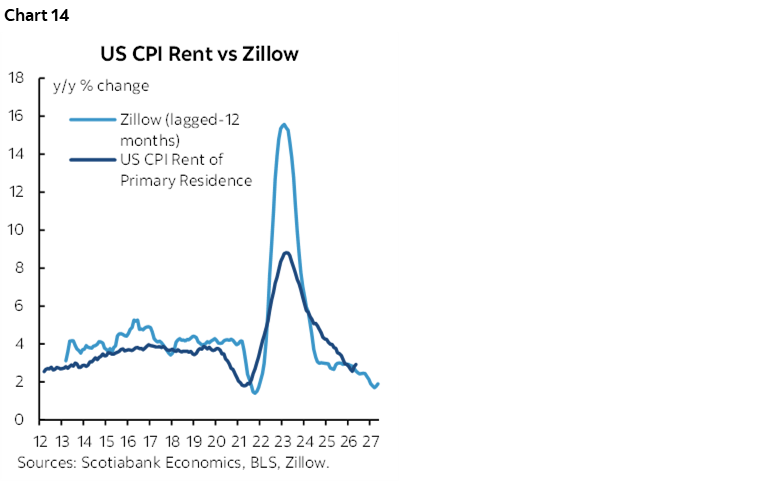
Total CPI is expected to be little changed (0.1% m/m SA) with core CPI excluding food and energy up 0.3% m/m SA. June is normally a seasonal up-month for unadjusted prices but there isn’t a clear seasonal adjustment factor bias as exists in some other months. I’m expecting core goods prices (ex-food and energy) to rebound alongside a quicker pace for core services inflation. Housing inflation may subside (chart 14).
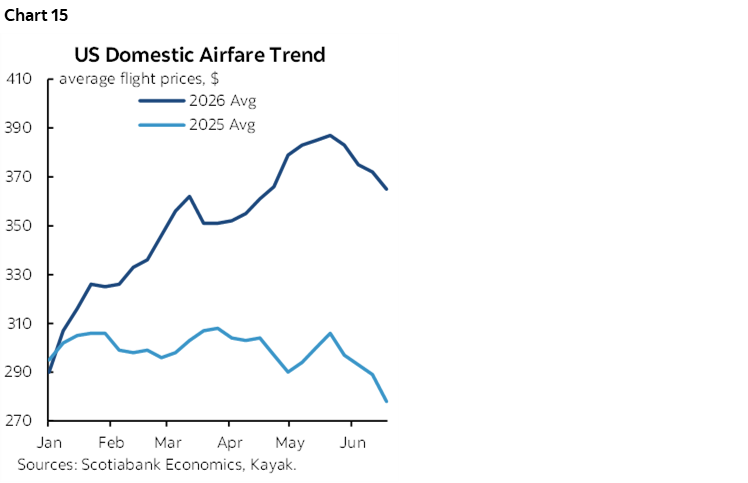
Be careful with changes in categories like airfare, lodging, food away from home etc that may reflect a World Cup bias, although we didn’t see much if any of that in payrolls and airfare looks to be easing (chart 15). Core services inflation (ex-housing and energy related services) may accelerate because of this point. It may be important to remove such influences in a form of super-supercore.
Producer prices are expected to slip by -0.1% m/m SA with core producer prices excluding energy and food up 0.3% m/m SA. Key among the drivers will be what happens to the categories that flow into PCE inflation. I’m expecting less of an effect through this channel than the prior month when portfolio management and investment advice fees jumped by 5% m/m toward the end of tax season, and when airline passenger services jumped by 2.5% m/m.
As argued in the section on Warsh’s testimony, the central tendency measures of price changes will be key and could remove one-offs like World Cup influences. The Cleveland Fed’s trimmed mean CPI will be updated shortly after CPI is released.
US EARNINGS SEASON—BIG BANKS KICK IT OFF
The Q2 earnings season commences in earnest this week. About 30 S&P500 firms will release starting with the usual focus upon financials.
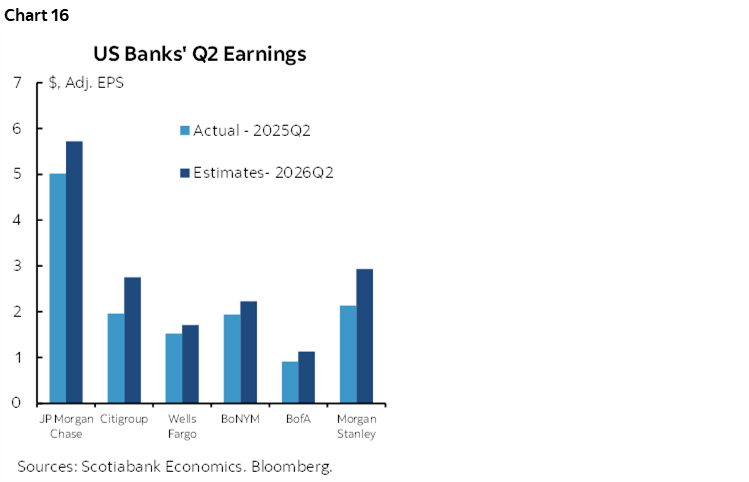
Tuesday will be the big bang with several key financials reporting just ahead of US CPI and Chair Warsh’s testimony. Goldman, BofA, JP Morgan, Citigroup and Wells Fargo kick it off. Wednesday then brings out Blackrock, Morgan Stanley, and BoNYM. A few other names over the rest of the week will include GE (Thursday) and Netflix (Thursday). Watch for discussion around regulatory changes like the Fed’s relaxation of capital rules in March. Guidance on tariff refunds will have to wait until nonfinancials begin to take over as earnings season progresses.
Chart 16 depicts analysts’ consensus expectations for EPS compared to the same quarter a year ago since earnings are not seasonally adjusted.
WARSH RETURNS TO CONGRESS—AND WHY HIKING COULD BE POLICY ERROR
Federal Reserve Chair Warsh returns to the Senate this time not seeking approval but to explain his views and address their questioning in the role as Chair. The semi-annual testimony on monetary policy starts before the House Financial Services Committee on Tuesday (10amET) and will then be followed by a repeat performance before the Senate Banking Committee at the same time the next morning. Each occasion will be preceded by the formal written remarks before the banter begins.
I’ll use this as an opportunity to share my own personal views on how Fed policy may—and should—evolve. I’m deeply sceptical toward the need to tighten US monetary policy and think that should the Committee elect to do so, then it could be policy error which could be a rather unfavourable opening act for the new Chair.
Bygones be Bygones
For starters, it’s unclear what Chair Warsh is really trying to signal when he laments the fact that inflation has overshot the 2% inflation target for the past five years since early 2021 while doing so in the context of how to conduct present and future policy. Lamenting this sounds like he is intimating a desire to do something about it which sounds like price level targeting. A persistent overshooting of the trend line on prices driven by 2% inflation each year can only be brought back to the trend line with sharp policy tightening and great pain for the US economy. I think the Fed will and should treat this in a bygones-be-bygones sense as the Fed can’t address over five years of overshooting its inflation target. Price level targeting has generally been rejected as a policy framework by global central banks and it’s highly unlikely that Warsh believes otherwise, in which case, why bring it up? Sometimes, past mistakes should be left in the past.
An indication of why can be found in measures of inflation expectations. None of the measures are terribly good in my opinion, but markets are not signalling an extrapolative approach to five years of materially overshooting 2% in measures like the Fed’s 5y5y measure of inflation expectations or TIPS breakevens. Markets are treating the pandemic-era’s inflation as temporary. In fairness, however, markets thought inflation was the great risk coming out of the Global Financial Crisis, and were dismissive toward inflation risk due to the pandemic.
An Overstated Inflation Problem?
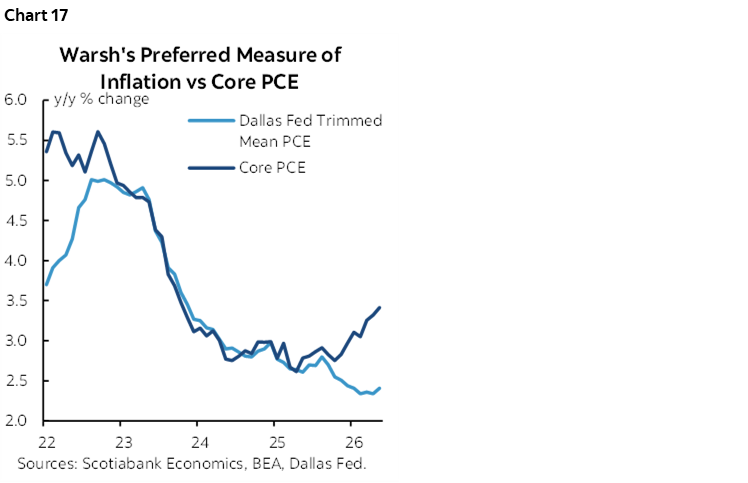
I don’t presently find that the US has a deep inflation problem. Warsh’s previously stated openness toward central tendency inflation measures like trimmed mean PCE—or, say, weighted median PCE—is probably on the mark (chart 17). Those measures stand at 2.4% y/y and 2.8% y/y respectively at the moment versus 4.1% for PCE inflation and 3.4% for core PCE inflation. The central tendency measures are warm, but not ripping.
An extension of the latter point is that today’s inflation looks like more of a relative price shock than a generalized outburst of inflationary pressures. Most of the pressure is in the tails of the price distribution toward which monetary policy is less well suited to address. Monetary policy cannot do anything about near-term inflation and is limited in its ability to address the tails.
Second-round effects of the commodity price shock on core inflation measures are likely to be limited and temporary—and I certainly didn’t argue that in the pandemic. Today’s supply shock is less pervasive than yesterday’s. There is no demand surge marked by coming out of hibernation in the pandemic. Nominal wage growth of 3.5% y/y is getting compressed to nothing by higher prices which likely means that households will have little ability to absorb price increases. That could shift the burden toward companies absorbing higher prices in today’s high profit margins in order to protect their sales volumes, and by factors like inventory stocking at older prices through front-running order books, which we’ve seen this year. US wages get set in real time much more so than in, say, Europe, or Canada, where collective bargaining incorporates wage adjustments reflecting price pressures and cements them for years to come.
And further to the latter point is the fundamentally different attitude of US businesses upon encountering cost pressures. They slash costs, reduce payrolls or payroll growth, seek more from their workforces including higher productivity, and emerge stronger on the other side.
A Slowing Economy…
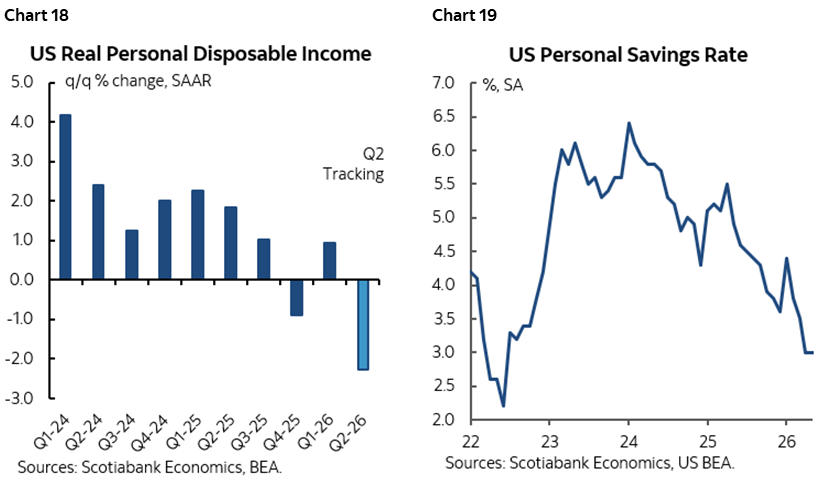
They are also faced with a slowing economy that may increasingly limit their pricing power. You’ve heard this view for years, and it’s finally happening. The strength of the US economy is now being overstated for three consecutive quarters. The US economy only grew by ½% q/q SAAR in 2025Q4, 1½% in Q1, and is tracking something similar in Q2. Consumers have not seen real income gains in multiple quarters (chart 18), have mitigated the effects on spending by cutting the saving rate in half compared to a couple of years ago (chart 19), and are going into tighter real wages over coming months and quarters. A consumer slowdown appears to be underway.
…Into Fiscal Tightening…
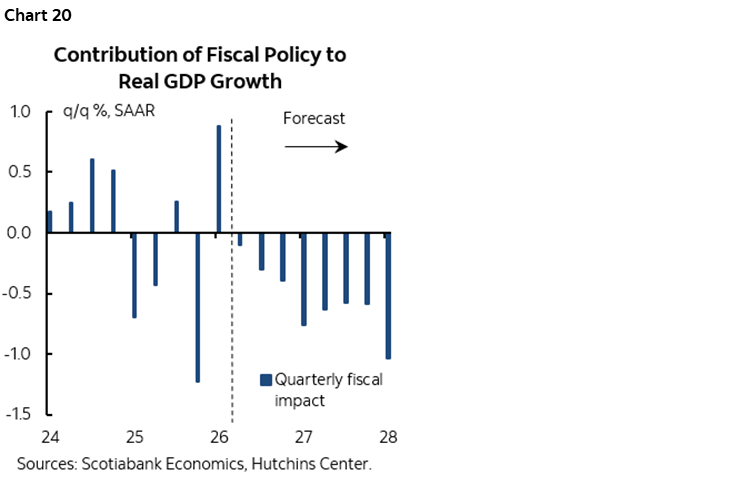
Fiscal policy is also in the early stages of losing its positive effects on growth. The folks at the Hutchins Center at the Brookings Institution provide an all-encompassing historical and forecast measure of fiscal contributions to GDP growth that combines federal, state and local government policies on the taxation and expenditure sides. Chart 20 shows they expect present policy will shave about 1% off GDP growth in 2027.
…May Reduce or Eliminate Excess Demand
A slowing US economy to date and forward-looking risks could well take the overall US economy from excess aggregate demand toward a closed output gap. If so—and it’s a reasonable case—then one of the drivers of upside risk to core inflation would drop out.
Courting Accidents
If fiscal policy is already expected to tighten, and monetary policy cannot address near-term inflation, and excess demand conditions abate, then tightening monetary policy now could carry pernicious lagging effects on the economy precisely into the time period when fiscal policy is retreating. In such a scenario, it’s not difficult to envisage GDP growth plumbing the depths of the cycle and thereby exposing the US to greater downside risk should fresh shocks or other policy errors arise.
The AI Wildcard
A wildcard is AI. It is likely contributing a few tenths of a percentage point to present inflation. The wealth effect it creates through equities is propping up activity more than would otherwise be the case. The investment surge is stimulating activity. Heavy AI-related investment is driving prices higher for electricity, semiconductors, DRAM memory chips, commercial property prices in some markets, and related building costs and labour.
But should policy tighten to address this influence on inflation? Not if the demand comes first and the potential influences upon productivity and the supply side come later. My bank side colleagues did this speculative model-based piece on AI’s influences that’s worth a look. In my opinion, the direction, magnitude and timing of AI’s influences upon jobs, productivity, wages, inflation, and growth are all highly uncertain. In my opinion, the damage it could do to the labour force by harming highly repetitive and labour intensive jobs could dominate the dual mandate. Ergo, to tighten policy—or to ease policy—on an AI bet risks being entirely speculative and potentially disastrous.
Labour Market Woes?
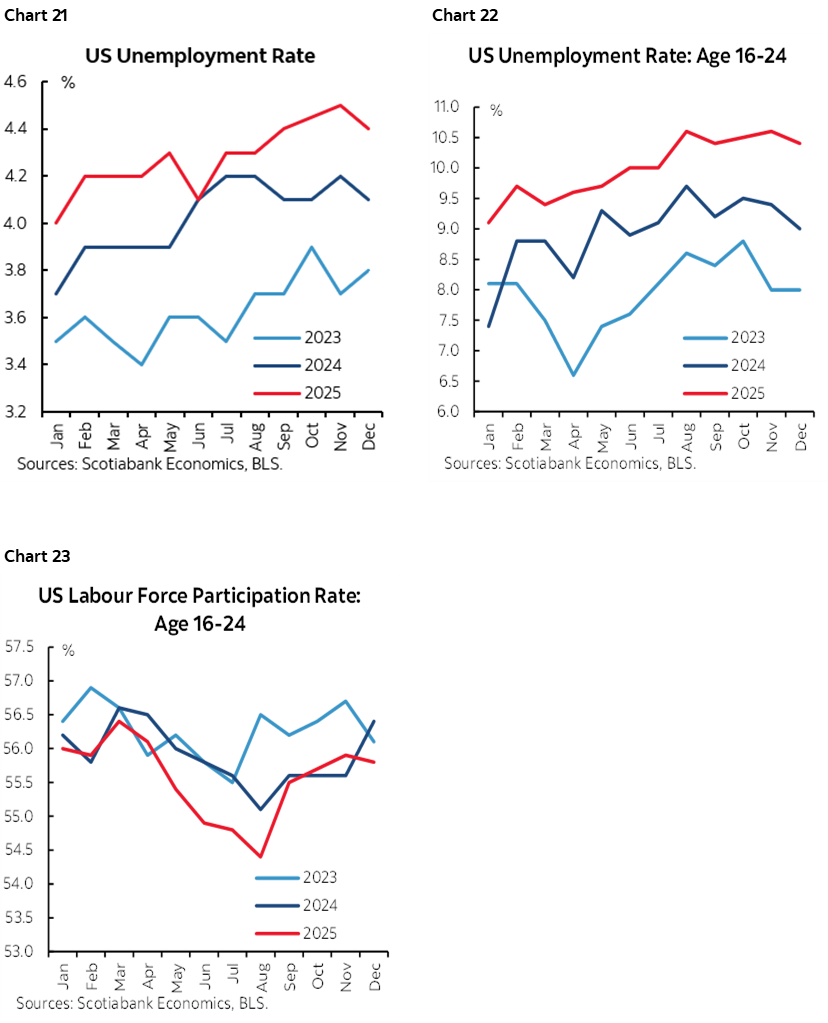
The dual mandate also necessitates a focus upon the labour market. It’s feasible that the US unemployment rate repeats the upward drift over H2 that has characterized the pattern over the past three years since emerging from the pandemic (chart 21). One plausible explanation involves focusing upon cohort effects. The 16–24 age cohort has witnessed a pattern of surging participation rates over H2 in recent years and with it rising unemployment rates over H2 (charts 22, 23). A plausible theory is that many more went to school in the pandemic, took longer to complete their studies, and have struggled with becoming integrated into job markets after graduating partly due to their sheer numbers and perhaps due to the effects of the pandemic.
Another plausible theory is that the pandemic’s aftermath changed the company reporting cycle’s influence. Challenge layoffs tend to peak early in the year when companies are preparing to report full year earnings and engage in window-dressing behaviour. They may fill full-year hiring quotas into the Spring months and then transition to a lower hiring pattern.
There are other plausible explanations as well, such as residual seasonality given the mixed timing of the pandemic’s shocks, the policy responses, the arrival of vaccines, and behavioural adaptations to the shocks. Data quality has suffered over the years as well, including falling nonfarm sampling rates on first pass, and record use of proxy methods for gathering price data.
Policy Error Would Jeopardize Everything Else
Overall, from a starting point of marginally restrictive policy, I don’t find the argument for tightening monetary policy in the US to be compelling. Scotiabank Economics continues to lean more toward the next policy rate moves being lower—not higher.
That could be wrong, but if so, then the arguments I’ve provided would suggest that hiking the policy rate would risk conducting policy error.
In conclusion, I like the fresh spirit that Chair Warsh has brought to the Fed. His taskforces are intriguing. They could revamp the Fed for the challenges that lay ahead and help it escape past approaches that may no longer be suitable. Yet failing at the Fed’s most important job by perhaps inappropriately tightening policy to a further degree could further jeopardize independence, invite greater Congressional oversight, and further undermining by the Trump administration.
BANK OF KOREA—A SLAM DUNK?
Here’s a simpler central bank. The BoK is widely expected to hike by 25bps to 2.75% on Thursday. Why? Partly because they’ve strongly hinted at such a move. Governor Shin Hyun Song recently guided “it is considered necessary to raise the benchmark interest rate at an appropriate time” while flagging persistent inflationary pressure. The volatile won’s 12% depreciation to the USD since the middle of last year has added to import price pressures and commodity price influences.
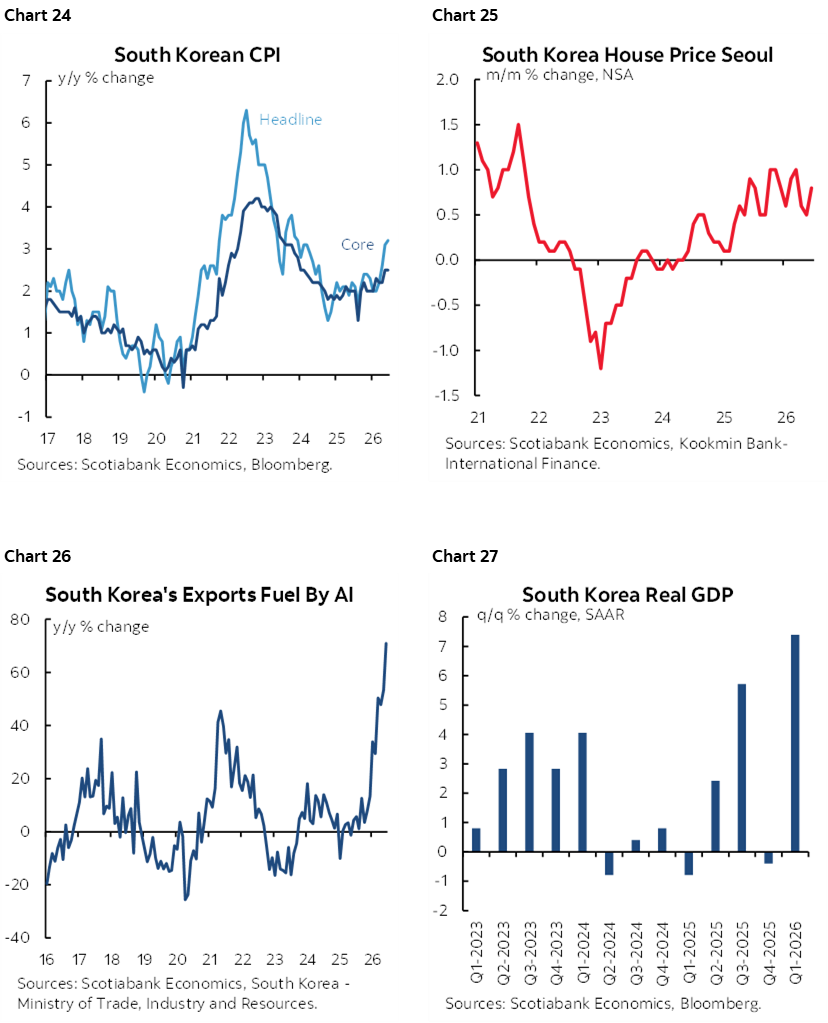
Charts 24–27 provide context for a tightening bias as core CPI inflation is rising, house prices continue to rise and stoke stability concerns, exports are soaring thanks in large part to chips and broader tech, and this is buoying economic growth.
The BoK would join a lengthening list of global central banks that have recently tightened policy including the BoJ, ECB, the RBA, the RBNZ, Norges, BSP among others.
No other central banks are expected to deliver policy decisions over the coming week within our coverage universe other than the BoC and BoK.
GLOBAL MACRO
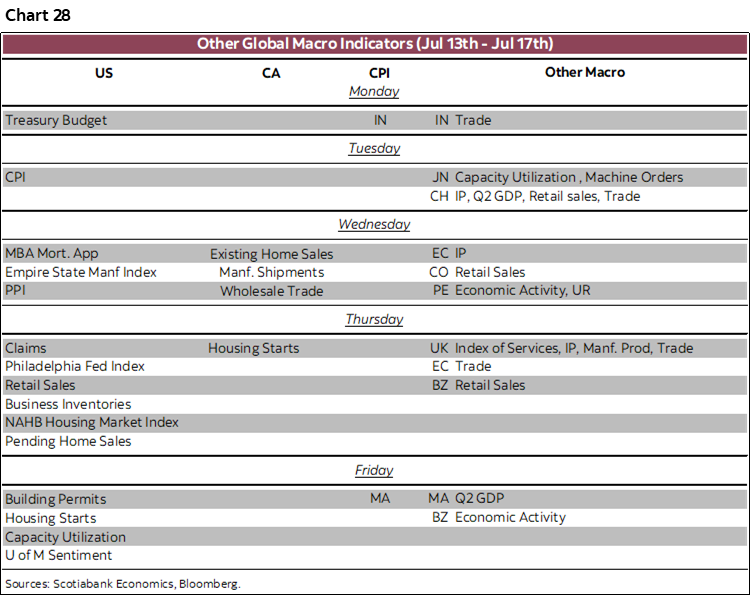
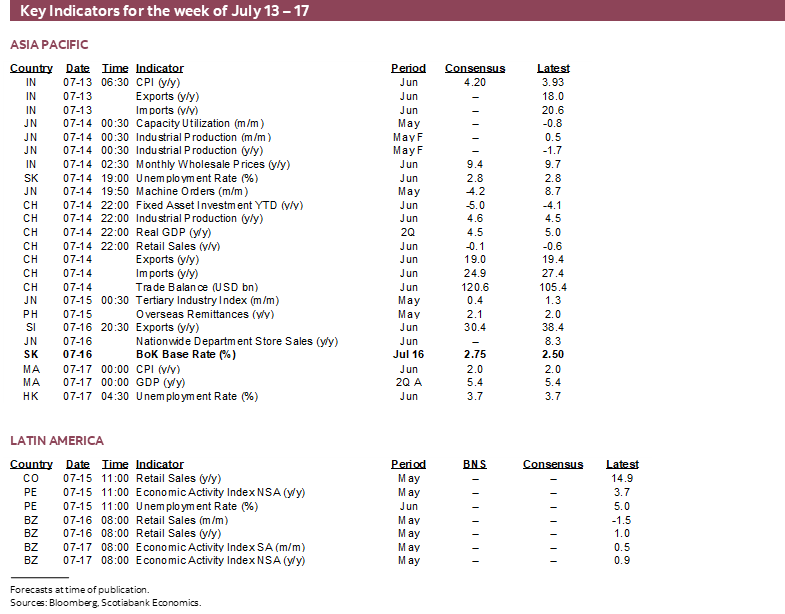
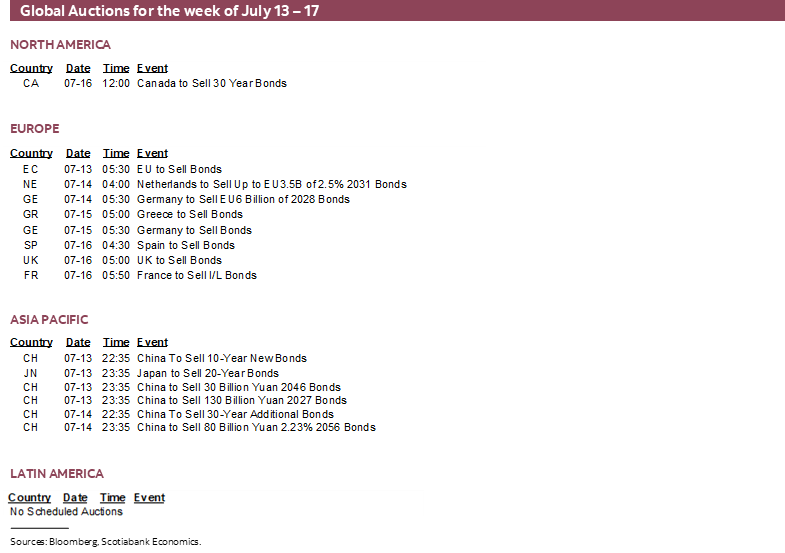
Chart 28 summarizes other global macro releases on tap for the week. The main focal points will be US retail sales, Chinese GDP and related readings, and a monthly batch of UK economic indicators. I’ve partnered with my colleague Jay Parmar on what follows.
Light Canadian Releases
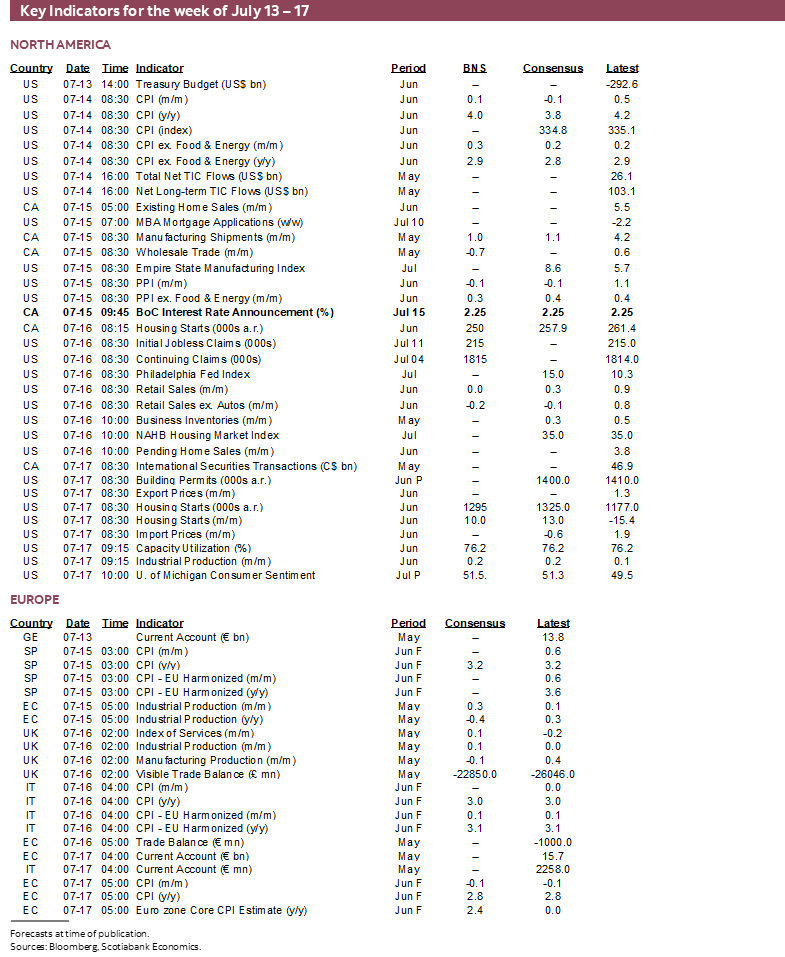
Canada will also release a handful of macro reports that are in between marquee reports on jobs, inflation and GDP. Home resales during June (Wednesday) will seek a third straight monthly gain as the Spring housing market takes off but could struggle in that regard on the heels of the large 5.5% m/m SA gain in May. Manufacturing shipments are expected to post about a 1% m/m nominal rise in May (Wednesday) based on prior Statcan guidance but watch volumes and details. Wholesale trade, however, was previously guided to have fallen by -0.7% m/m in May (Wednesday) but watch volumes. Finally, I’m expecting a bit of a pullback in housing starts during June (Thursday) to a still solid annualized pace of about a quarter million.
US Retail Sales to Headline Indicator Risk
The US reports a series of macro reports, but the main ones of interest will be retail sales for June (Thursday), industrial output in June (Friday) and UMich consumer sentiment in July (Friday). Retail sales could get a lift from auto sales, but an offset will be lower gasoline prices with the balance settled by what happens to sales ex-autos and gas that is expected to post a small nominal gain. Factory output is also expected to grow slightly.
China’s Economy—Subdued Growth
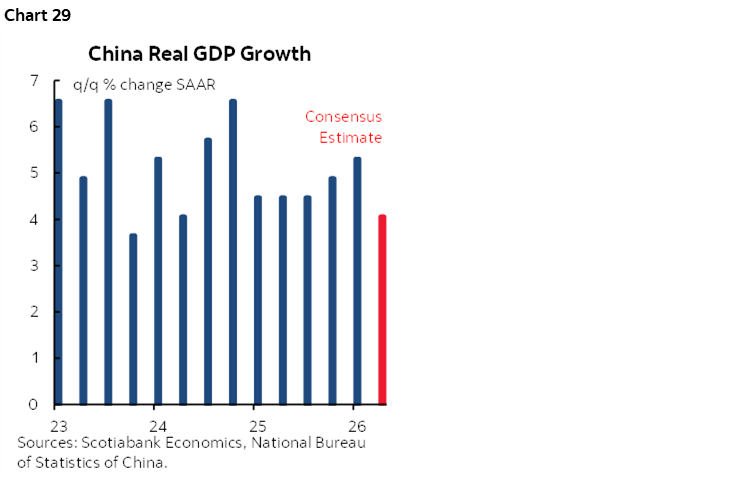
Other global macro developments next week will be largely focused on China, which is scheduled to release its Q2 GDP figures, along with June home price data and key activity indicators—including retail sales and industrial production—on Tuesday. The economy is expected to expand by 1.0% q/q SA in Q2, extending the recent pattern of subdued growth (chart 29). After falling short of its 2025 GDP growth target of 5% (vs. actual 4.5%), Q2 GDP growth on a q/q annualized basis is expected to come in at 4.1%, once again below the Chinese government's 2026 growth target range of 4.5%–5.0%.
Key economic activity data through May suggest that China's retail sales growth has slowed for three consecutive months, with another moderation expected in June. Investment activity has also remained subdued across both private and state-owned enterprises. As a result, domestic demand is once again expected to remain the primary drag on Q2 growth amid weak household consumption, soft private investment, and the absence of any meaningful additional fiscal support thus far.
However, strong external demand is expected to continue supporting economic growth through robust exports and industrial production. Although industrial production growth slowed in April, it rebounded in May, with another solid increase expected in June, supported by strong AI-related demand and front-loading of inventories.
In addition, China will release its June property price data on Tuesday. The figures will provide insight into whether month-over-month price declines continue to moderate or begin to accelerate again following recent signs of stabilization in the property market.
UK Data Dump
The UK will also release a set of economic activity indicators for May on Thursday, providing further insight into how the Middle East conflict is affecting the economy. After a strong start to the year, monthly GDP contracted by 0.1% m/m in April, just as the conflict began to weigh on global activity, and is expected to post a modest rebound of 0.1% m/m in May. However, headwinds remain as the full impact of the conflict has yet to be felt, while higher costs continue to squeeze households' real incomes and weigh on consumer spending and economic activity.
Indian Inflation—Higher Regulated Prices
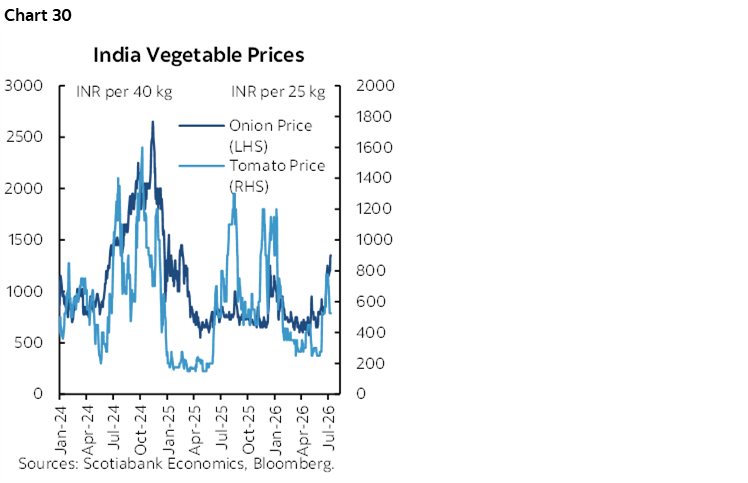
RBI watchers will closely monitor June inflation data on Monday for further evidence of broadening price pressures as firms pass through higher input costs. May's reading already showed a partial pass-through of elevated global commodity prices to domestic fuel and jewelry prices. While lower commodity prices in June should provide some relief, mid-May's auto fuel price hike and higher cooking fuel prices are expected to keep energy inflation on an upward trajectory alongside key food commodities (chart 30). The RBI's latest projections show headline inflation peaking at 5.9% by year-end and core inflation at 4.7%, with risks skewed to the upside.
Light in LatAm
Finally, in LatAm markets, key developments next week will be the release of May economic activity data from Peru on Wednesday and Brazil on Friday. The focus will be on whether both economies continue to demonstrate resilient growth despite an increasingly challenging external environment
DISCLAIMER
This report has been prepared by Scotiabank Economics as a resource for the clients of Scotiabank. Opinions, estimates and projections contained herein are our own as of the date hereof and are subject to change without notice. The information and opinions contained herein have been compiled or arrived at from sources believed reliable but no representation or warranty, express or implied, is made as to their accuracy or completeness. Neither Scotiabank nor any of its officers, directors, partners, employees or affiliates accepts any liability whatsoever for any direct or consequential loss arising from any use of this report or its contents.
These reports are provided to you for informational purposes only. This report is not, and is not constructed as, an offer to sell or solicitation of any offer to buy any financial instrument, nor shall this report be construed as an opinion as to whether you should enter into any swap or trading strategy involving a swap or any other transaction. The information contained in this report is not intended to be, and does not constitute, a recommendation of a swap or trading strategy involving a swap within the meaning of U.S. Commodity Futures Trading Commission Regulation 23.434 and Appendix A thereto. This material is not intended to be individually tailored to your needs or characteristics and should not be viewed as a “call to action” or suggestion that you enter into a swap or trading strategy involving a swap or any other transaction. Scotiabank may engage in transactions in a manner inconsistent with the views discussed this report and may have positions, or be in the process of acquiring or disposing of positions, referred to in this report.
Scotiabank, its affiliates and any of their respective officers, directors and employees may from time to time take positions in currencies, act as managers, co-managers or underwriters of a public offering or act as principals or agents, deal in, own or act as market makers or advisors, brokers or commercial and/or investment bankers in relation to securities or related derivatives. As a result of these actions, Scotiabank may receive remuneration. All Scotiabank products and services are subject to the terms of applicable agreements and local regulations. Officers, directors and employees of Scotiabank and its affiliates may serve as directors of corporations.
Any securities discussed in this report may not be suitable for all investors. Scotiabank recommends that investors independently evaluate any issuer and security discussed in this report, and consult with any advisors they deem necessary prior to making any investment.
This report and all information, opinions and conclusions contained in it are protected by copyright. This information may not be reproduced without the prior express written consent of Scotiabank.
™ Trademark of The Bank of Nova Scotia. Used under license, where applicable.
Scotiabank, together with “Global Banking and Markets”, is a marketing name for the global corporate and investment banking and capital markets businesses of The Bank of Nova Scotia and certain of its affiliates in the countries where they operate, including; Scotiabank Europe plc; Scotiabank (Ireland) Designated Activity Company; Scotiabank Inverlat S.A., Institución de Banca Múltiple, Grupo Financiero Scotiabank Inverlat, Scotia Inverlat Casa de Bolsa, S.A. de C.V., Grupo Financiero Scotiabank Inverlat, Scotia Inverlat Derivados S.A. de C.V. – all members of the Scotiabank group and authorized users of the Scotiabank mark. The Bank of Nova Scotia is incorporated in Canada with limited liability and is authorised and regulated by the Office of the Superintendent of Financial Institutions Canada. The Bank of Nova Scotia is authorized by the UK Prudential Regulation Authority and is subject to regulation by the UK Financial Conduct Authority and limited regulation by the UK Prudential Regulation Authority. Details about the extent of The Bank of Nova Scotia's regulation by the UK Prudential Regulation Authority are available from us on request. Scotiabank Europe plc is authorized by the UK Prudential Regulation Authority and regulated by the UK Financial Conduct Authority and the UK Prudential Regulation Authority.
Scotiabank Inverlat, S.A., Scotia Inverlat Casa de Bolsa, S.A. de C.V, Grupo Financiero Scotiabank Inverlat, and Scotia Inverlat Derivados, S.A. de C.V., are each authorized and regulated by the Mexican financial authorities.
Not all products and services are offered in all jurisdictions. Services described are available in jurisdictions where permitted by law.