Next Week's Risk Dashboard
- OPEC+ meeting faces bigger issues than near-term output
- NATO Summit to amplify divisions
- FOMC minutes could reveal more about the ‘family fight’
- Canadian jobs — what comes after the big gain…
- …and the state of the labour market
- BoC surveys may raise inflation expectations
- Analysts to sharpen pencils ahead of following week’s US earnings
- BCRP to stand pat post-election amid rising inflation
- RBNZ could hike
- Bank Negara Malaysia to hold as subsidies keep inflation low
- Inflation: China, Philippines, Taiwan, Norway, Sweden, Brazil, Chile, Colombia, Mexico
- Global macro
Chart of the Week
When it comes to family fights, some occur within more dysfunctional ones than others. That point will be emphasized this week at the OPEC+ meeting that faces more challenges ahead than just August production quotas. It will again be emphasized at the NATO Summit in Turkey on July 7th–8th where Trump is expected to rage against allies for not supporting his poorly planned and executed war with Iran and for choosing not to have the same military-industrial complex and interventionist foreign policy as the United States. Another ‘fight’ may be revealed within further insights that may be provided regarding the potentially seismic changes that are embroiling officials at the Federal Reserve under new Chairman Warsh.
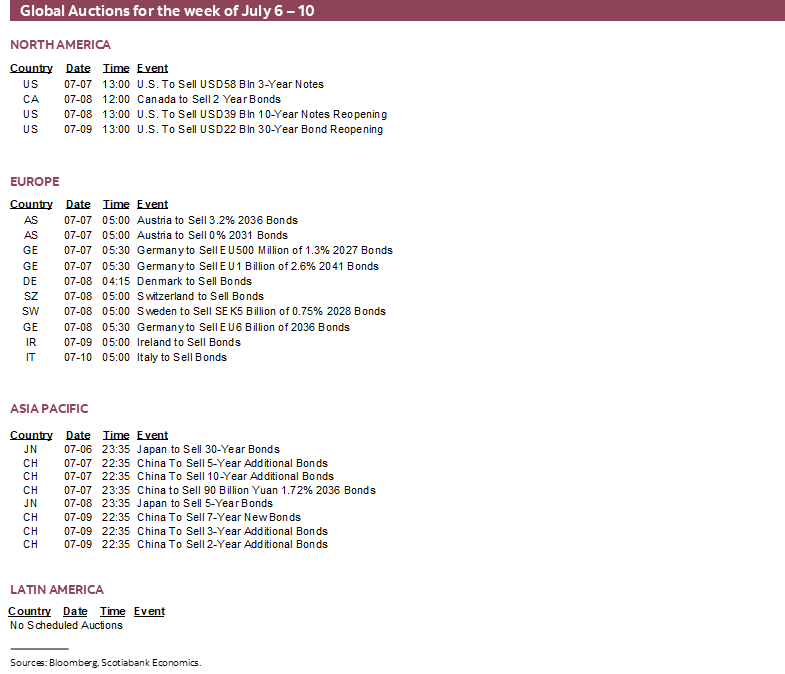
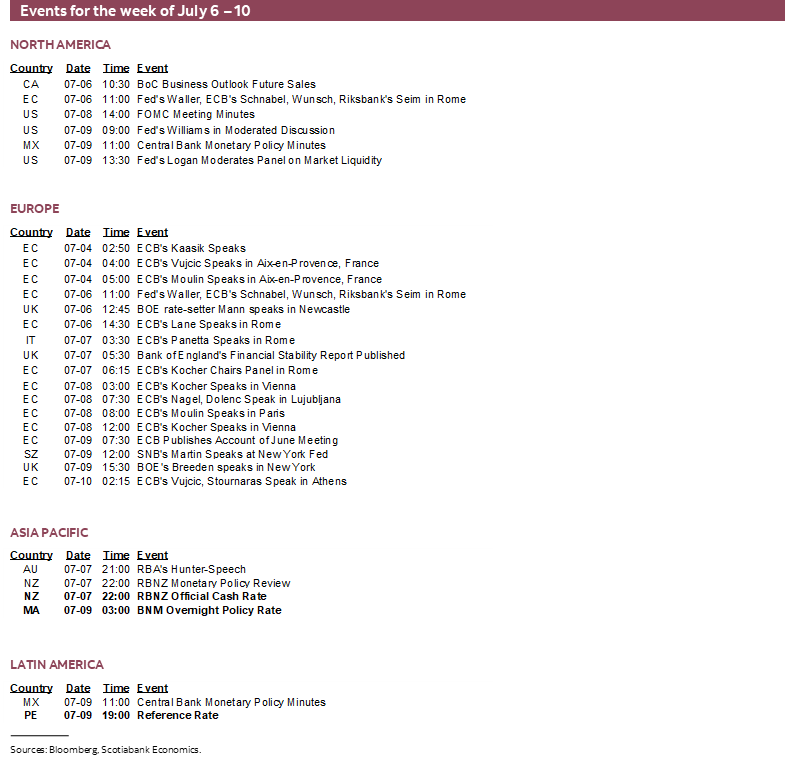
Toss in an order of Canadian jobs, three central bank decisions (RBNZ, BCRP, Negara), pre-decision BoC surveys including inflation expectations, FOMC minutes, ECB minutes, the BoE’s financial stability assessment and a round of inflation data spanning several economies and I’d say we have enough to call it an active week for global and regional market risks.
The coming week will also see analysts sharpening their pencils ahead of the following week’s start to the Q2 US earnings season that will report on wartime effects and tariff rebates.
OPEC+—A DYSFUNCTIONAL FAMILY FIGHT
Lovely Vienna will once again play host city to the OPEC+ meeting on Tuesday and Wednesday. Somehow, I doubt that Federal Reserve Chair Warsh’s ‘good family fight’ will be portable to this gathering. For one thing, the ‘family’ has gotten smaller after the United Arab Emirates withdrew on May 1st. Several of the rest of the members are squabbling, to put it mildly. Key will be debate over whether to remain committed to higher production quotas in August and the path thereafter.
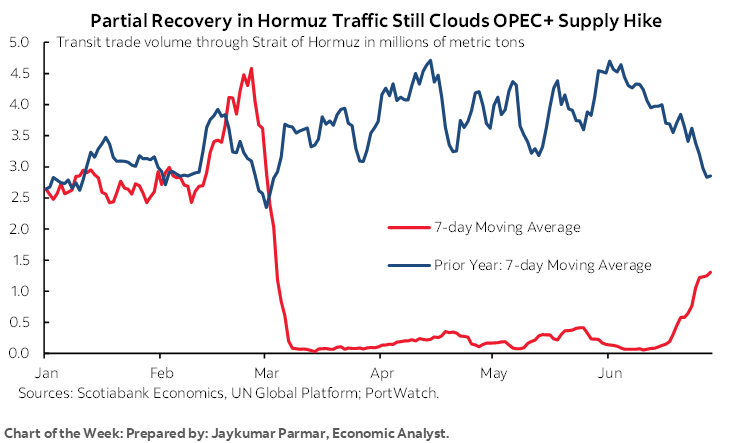
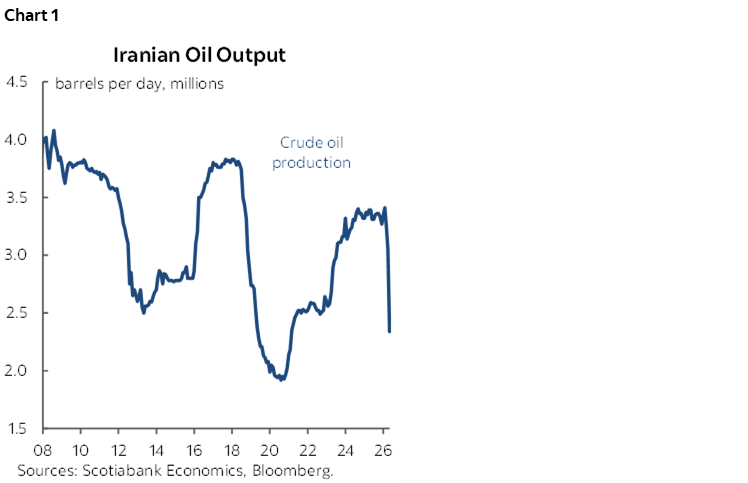
Their ability to deliver upon such quota increases is doubtful, given damage to energy infrastructure and ongoing progress toward reopening the Strait of Hormuz. As my colleague Jay Parmar’s chart of the week on the front cover demonstrates, the Strait’s reopening progress remains a far cray away from pre-war norms. More important over time may be whether sanctions against Iran can truly be dropped and the impact this may have upon a renewed source of supply on global oil markets (chart 1). It remains uncertain how the US Congress and other global polities can enact upon the pledge to drop sanctions within the US-Iran MOU.
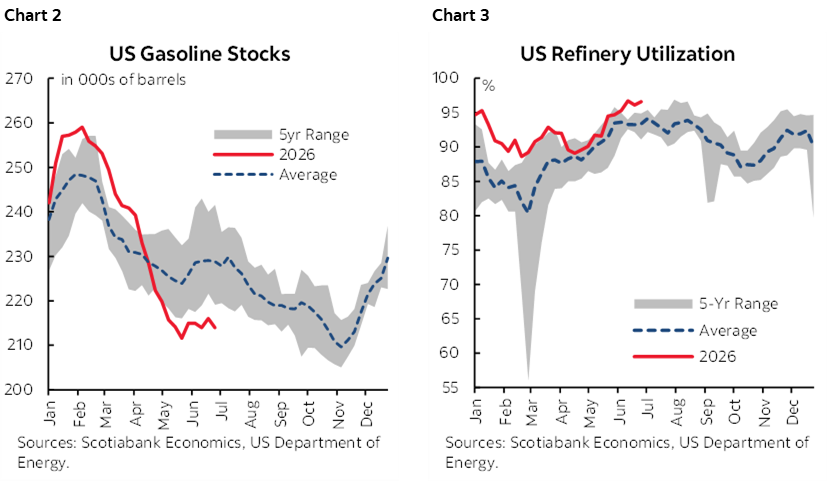
Nevertheless, as previously noted, the N.A. gasoline market will remain tight and slow to pass through lower energy prices given tight inventories (chart 2) and sky-high refinery utilization rates (chart 3).
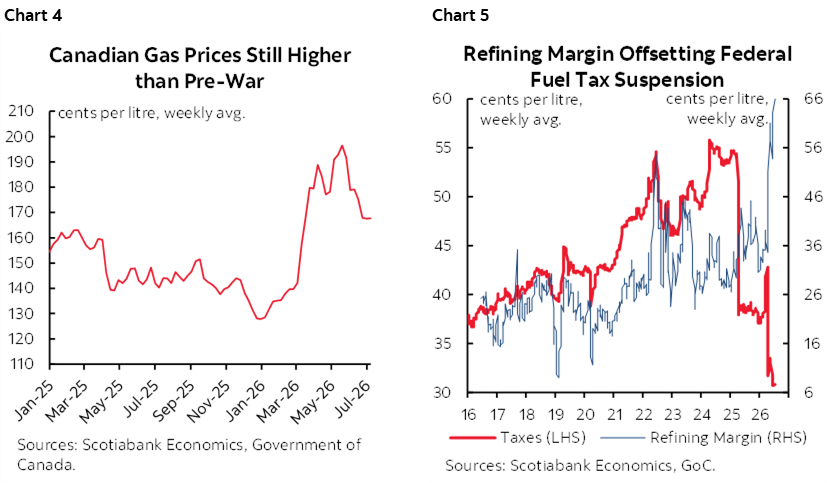
In Canada, gasoline prices have come down but remain sharply higher than before the war broke out and for similar reasons to the US given the integrated markets (chart 4). An added factor is the ongoing crowding-in of refining margins in the wake of the suspension of the fuel excise tax until Labour Day and the prior elimination of the consumer portion of the carbon tax (chart 5).
CANADIAN JOBS—AFTER THE BIG GAIN
The Labour Force Survey for June will further inform how Canada’s job market is performing. Friday’s release could post another more moderate gain than the prior month’s 88k increase in employment that pushed the unemployment rate down three-tenths to 6.6%. My guesstimate is a gain of 10k and a flat unemployment rate.
I’ll explain some of the rationale for the estimate and then assess the state of the labour market.
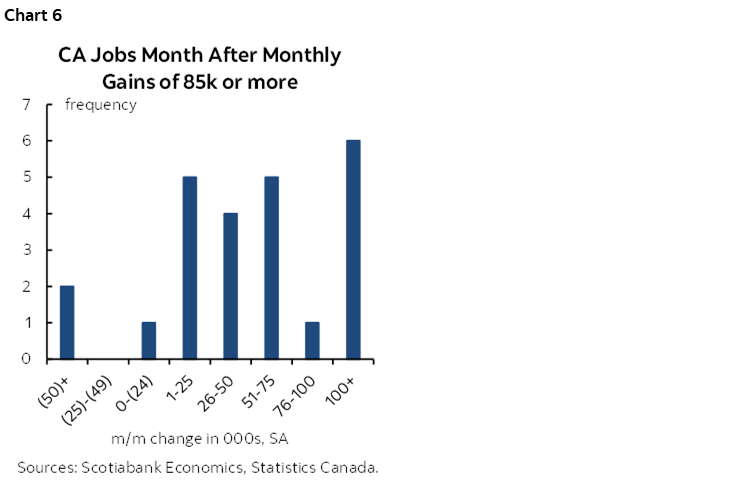
After the large 88k job gain in May it may be natural to assumed that June could offer some payback. The historical evidence and the methodology employed by the Labour Force Survey would counsel against expecting as much. For starters, chart 6 shows what has historically happened the month after large gains of 85k or more in history; ups and more common than downs.
Secondly, the LFS methodology employs a rotating panel sample in which the same survey dwellings remain in the sample for six consecutive months. As each month arrives, the first month in the sample is replaced by the latest month. Therefore, one conceivable answer for why past big gains can beget further gains is that most of the sample remains intact from month to month.
You could also offer a more intuitive explanation for persistence. While conditions can change over time, if businesses had confidence to hire one month, then that confidence may persist the next.
On that note, we can turn to what’s happening to hiring confidence. Unfortunately, the measures that are available in Canada are not very helpful and can conflict. The Bank of Canada’s Business Outlook Survey will update hiring intentions in Monday’s Q2 report but with a lag, but the April edition pointed toward higher hiring expectations over the coming year. The CFIB’s (a small business lobby group) measure of hiring plans posted slightly more employers planning to reduce jobs than add to them. The ‘Signal 49’ folks (formerly the Conference Board of Canada) produce a measure that shows hiring intentions on the rise.
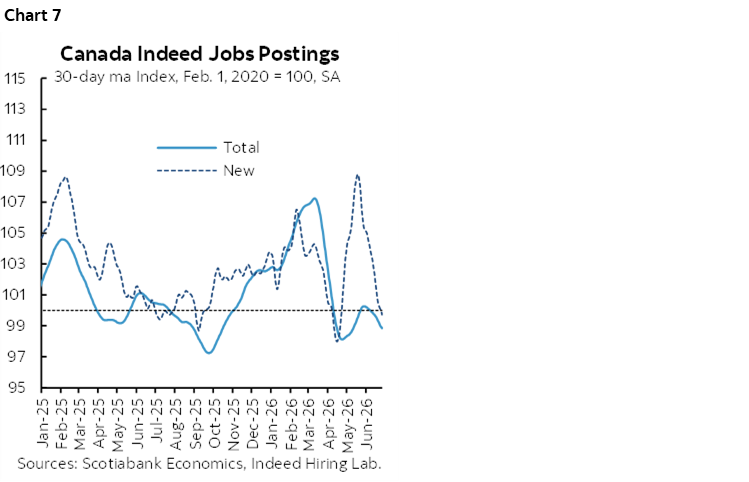
Perhaps the clearest gauge of hiring intentions comes from job postings. New postings had temporarily surged but have fallen back down and dragged total postings with them (chart 7).
Intentions and postings don’t necessarily indicate actual hiring. There can be lags in filling postings and when they show up in jobs numbers through the offer, acceptance and start date lags. There are also jobs that never make it to postings.
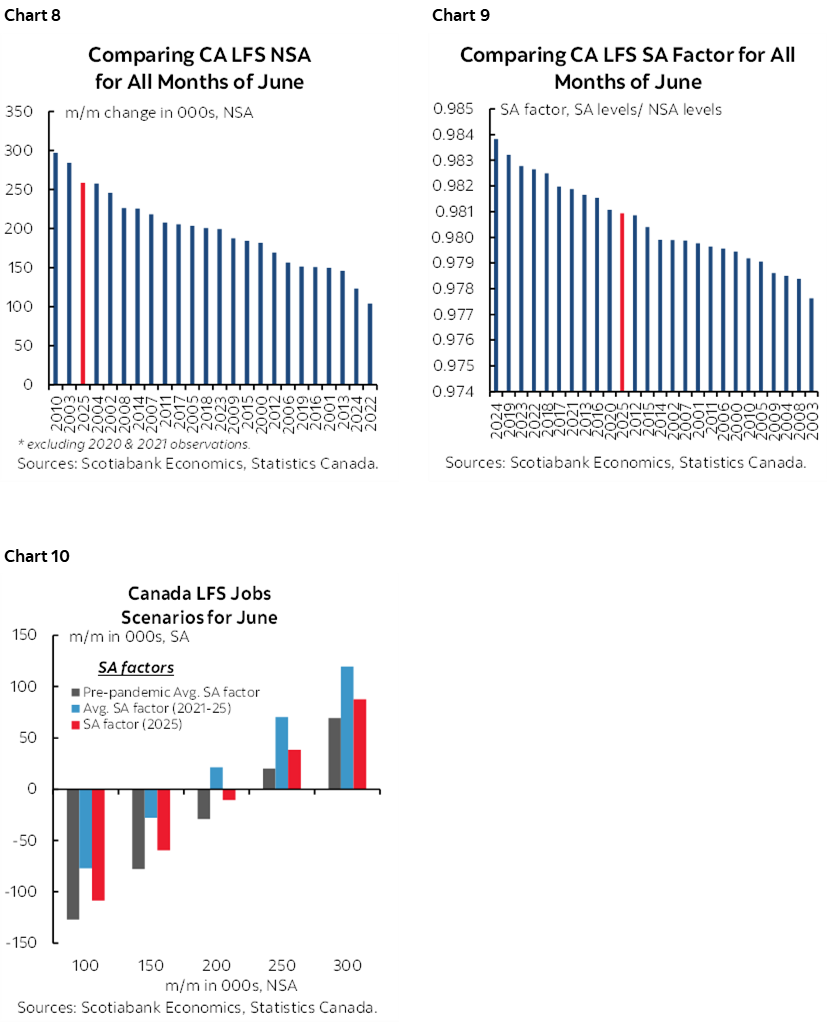
In casting a wider net, we can point to June normally being a significant up-month for seasonally unadjusted jobs with June usually posting between 100–300k extra jobs (chart 8). There may be residual hiring for the summer job market. The seasonal adjustment factors used by Statcan have not been particularly distorted in recent years compared to history (chart 9). Marrying reasonable estimates for the two variables reveals a middle ground estimate for a small job gain (chart 10).
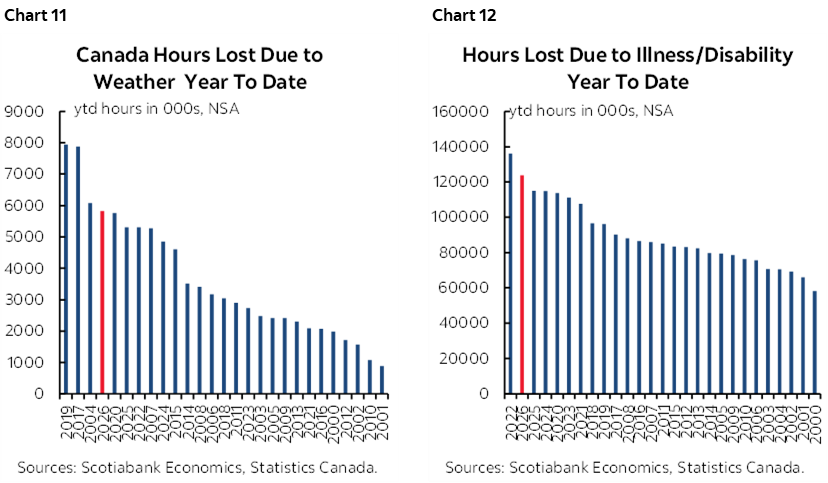
One knock-on question is whether this will be a typical June in terms of hiring seasonality. There could still remain some residual seasonal hiring carried over from previously because weather (chart 11) and illness (chart 12) have been persistently cited as reasons for reduced hours worked on a year-to-date basis which may be a signal about delayed hiring. Simply put, a worse than usual Winter and delayed Spring combined with a worse than average flu season could have held back the search, posting, interview, offer, acceptance and start process.
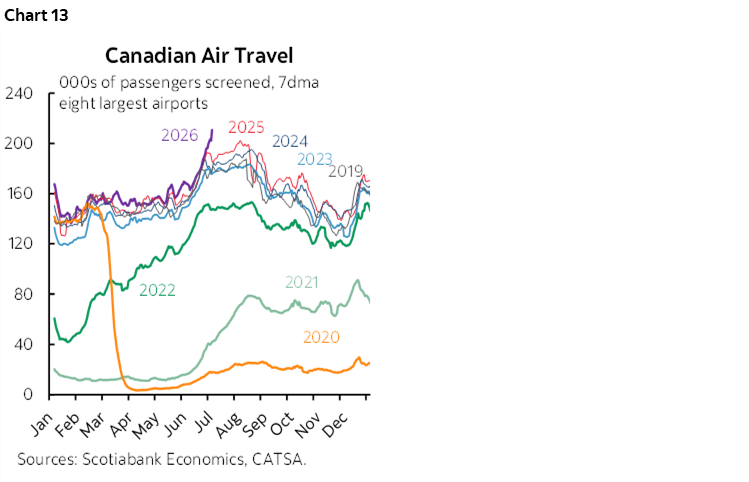
As for the World Cup, I’m not expecting much but will keep an eye out for any unusual gains in categories like accommodation and food services. The US did not see any obvious World Cup hiring gain as the leisure and hospitality sector lost 61k jobs in June. Canadian flight data has shown that increased activity over the World Cup period (chart 13) unlike the US perhaps because the US was held back by concerns about air traffic controllers, immigration hurdles and high prices.
Also keep an eye on tracking hours worked as a GDP rebound signal and wage growth that has been highly volatile over recent months.
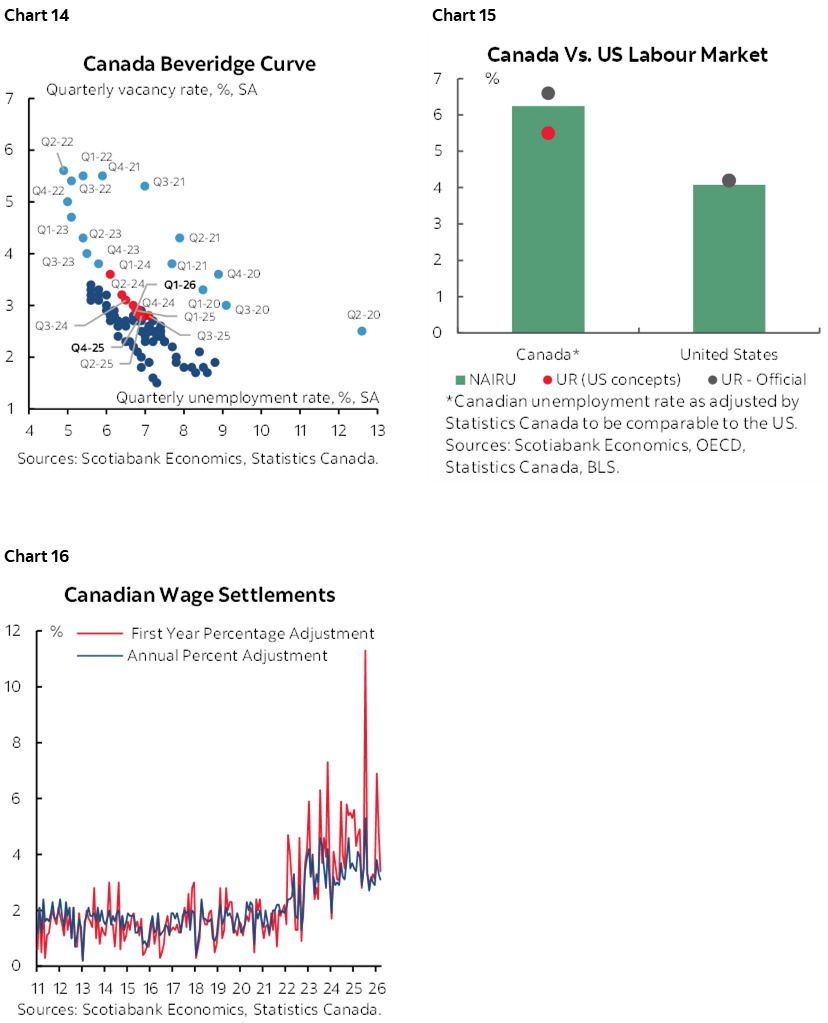
In a broader sense, Canada’s labour market is in a rough state of balance. The so-called Beveridge Curve—which plots the job vacancy rate against the unemployment rate—is showing present readings around historical norms (chart 14). The unemployment rate of 6.6% is close to the OECD’s estimate of the natural equilibrium rate of unemployment (chart 15). The unemployment rate is forecast to decline as tighter immigration policy shrinks the labour force and the LFS methodology catches up. Further, wage settlements for the roughly one-third of workers that are unionized in Canada (10% in the US) and hence subject to collective bargaining exercises remain elevated with expected gains over the next 3–4 year contract periods well above the BoC’s 2% inflation target (chart 16).
CENTRAL BANKS—DECISIONS, MINUTES & SURVEYS
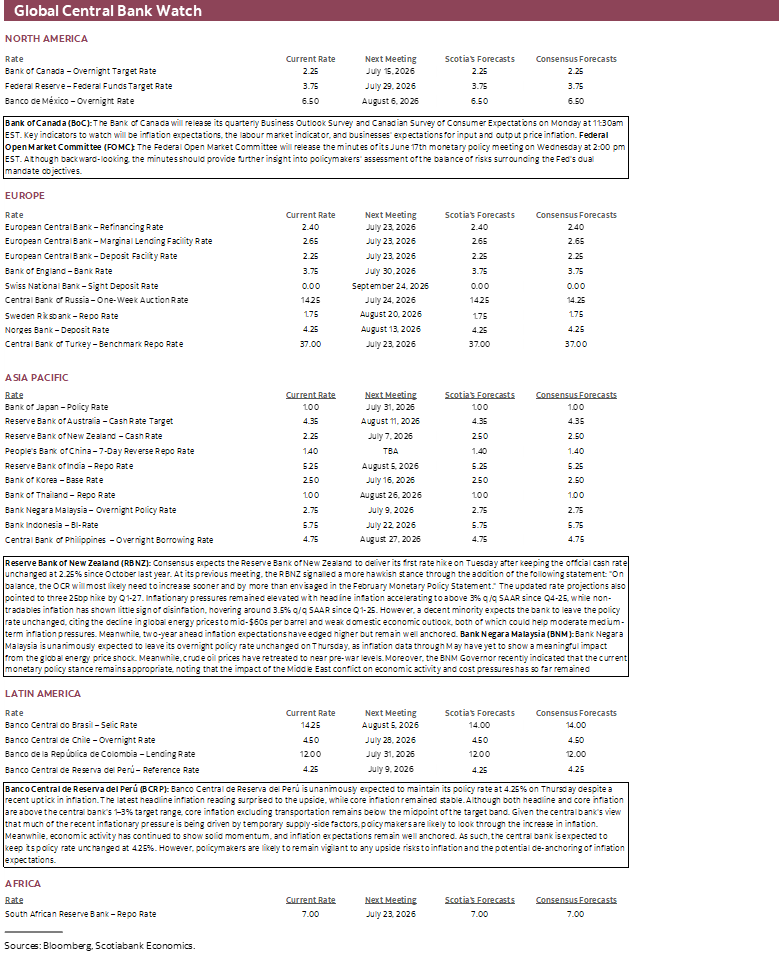
Three regional central banks will offer decisions and four will enhance prior communications.
RBNZ—Guidance Vs. Fresher Developments
New Zealand’s central bank may deliver its first hike since early 2023 on Tuesday. Markets have priced about three-quarters of a 25bps increase in the official cash rate. A majority within consensus expects a hike but a sizeable minority thinks that the RBNZ will whiff.
Key is to trade off prior policy guidance against more recent developments. At its last meeting on May 26th, the RBNZ’s statement explicitly stated that the rate “will most likely need to increase sooner and by more than envisaged in the February Monetary Policy Statement.” Three members voted for an increase at that meeting with four against including Governor Breman.
Important to note is that that RBNZ was planning future rate hikes as soon as year-end or early 2027 before the US-Iran war and its impact upon commodities, particularly oil. The war motivated the RBNZ to pull forward that guidance into 2026Q3. The February and May guidance depicted in chart 17 demonstrates this point.
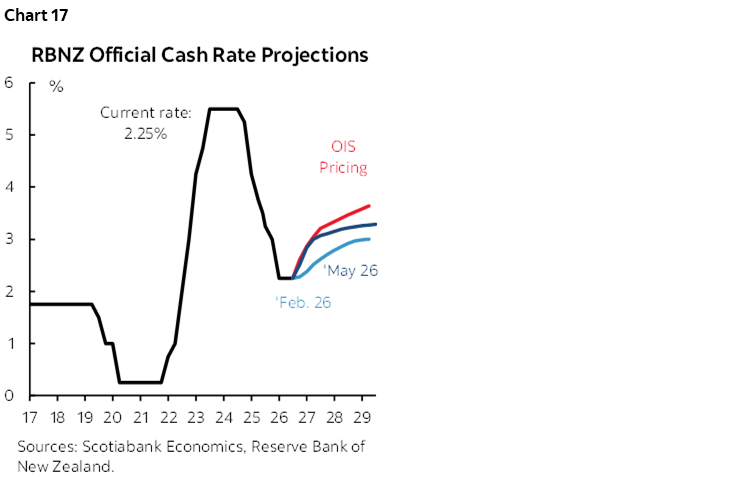
Part of the reason was that inflation had been above 3% y/y again in Q1 and was trending higher from the 2.2% trough of 2024Q3. The RBNZ may still feel that it has a case for hiking based on pre-war conditions and that broad commodity prices remain above pre-war levels.
Still, the option to hold and continue to monitor inflation risk may be attractive to enough members.
BCRP—Too Soon
Peru’s central bank is widely expected to hold its reference rate unchanged at 4.25% on Thursday.
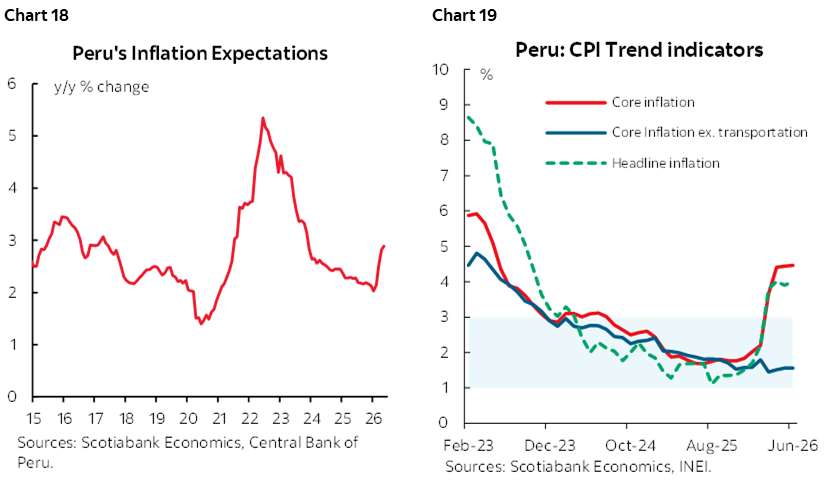
It took a while for the two rounds of elections and vote counts to proceed, but Keiko Fujimori narrowly won the election against leftist candidate Roberto Sánchez who has pledged to contest the result. Charts 18–19 nevertheless provide inflation warning signs. Even with CPI running at 4% y/y in June and rising while the economic activity index proxy for GDP growth remains at a solid 3.7% y/y, BCRP may elect to avoid perceptions that it is hastily assessing inflation risk in light of lower oil prices, and may wish to give more space for the election results and the ensuing policy aftermath.
Bank Negara Malaysia—Holding Due to Fuel Subsidies
Malaysia’ central bank is expected to leave its overnight rate unchanged at 2.75% on Thursday. The Negara Governor noted on May 15th that “broader price conditions remain relatively contained as of early May” and since then CPI landed at 2% y/y. A key reason for this, however, is that the government is spending a tonne of money on fuel subsidies to keep prices contained; an estimated 40 billion ringgit (about US$10 billion) will be spent this year relative to a more modest stipend that had been budgeted.
FOMC Minutes—Markets Pre-Judged Against Guidance
Minutes to the June 16th–17th FOMC meeting are due out on Wednesday at 2pmET. They may add further colour to the range of issues discussed and presented in the communications that were offered after the meeting (recap here).
I felt that much of the post-meeting assessments that were offered across the street and the reaction in financial markets was excessively hawkish. Why? Warsh repeatedly cautioned against pre-judging the outcome of the five task forces that are expected to report back on key matters toward year-end yet markets pre-judged the outcomes by pricing hikes starting as soon as July. Markets only heard frequent references to price stability, ignoring cautions on jobs including Warsh’s recent comments at the ECB’s Sintra Forum before payrolls disappointed (recap here). Markets looked to the dots that shifted upward, ignoring the fact that the mode still calls for a hold through to year-end and there is a 50–50 split on the Committee between holding with one favouring a cut versus the rest who lean toward hiking this year. Markets ignored the fact that Warsh’s dot—the most important of all of them—was held back. Markets ignored the fact that the dots usually perform terribly. Markets ignored Warsh’s caution that FOMC participants submitted their projections “with pencils, the kind with big erasers.” In short, markets applied greater certainty to the signals from the FOMC than the FOMC itself provided to markets.
BoC Surveys—Inflation Expectations the Key
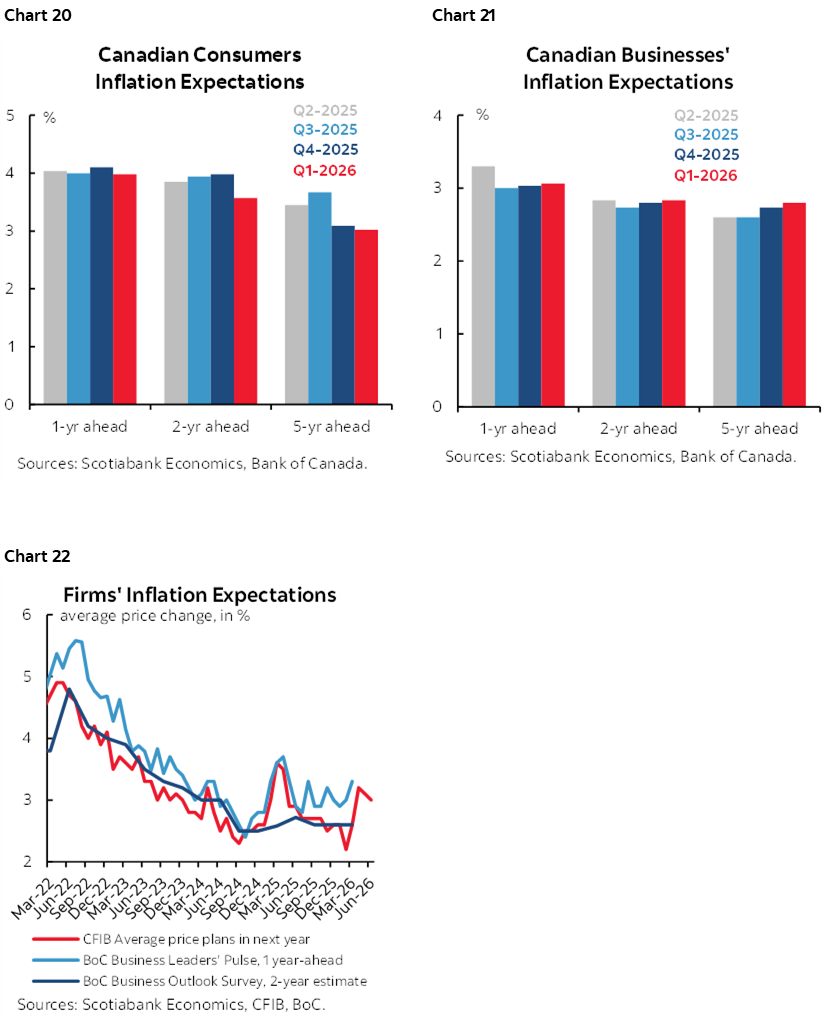
The BoC’s quarterly pre-MPR surveys of consumers and businesses arrive on Monday morning (11:30amET) and are likely to show further increases in inflation expectations. Chart 20 shows where consumer inflation expectations stood in Q1 with all time frames at or above the 3% upper end of the BoC’s 1–3% inflation target range. Chart 21 shows businesses’ inflation expectations across different time periods and how they are all in the upper end of the inflation target range. Chart 22 then shows that the BoC’s BOS survey measure of 2-year ahead inflation expectations has some catching up to do in relation to both the BoC’s slightly fresher Business Leaders’ Pulse measure of inflation expectations. The CFIB’s small business measure of inflation expectations is the freshest of all (to June) and tends to track beneath the BoC’s measures which implies they will rise more than the CFIB measure.
Also out over the coming week will be the Bank of England’s financial stability report on Tuesday and minutes to the ECB’s June 11th meeting when they hiked the deposit rate by 25bps which may further inform the path forward in terms of second-round effects and lower energy prices.
OTHER GLOBAL MACRO
The rest of the global line-up will be light this week.
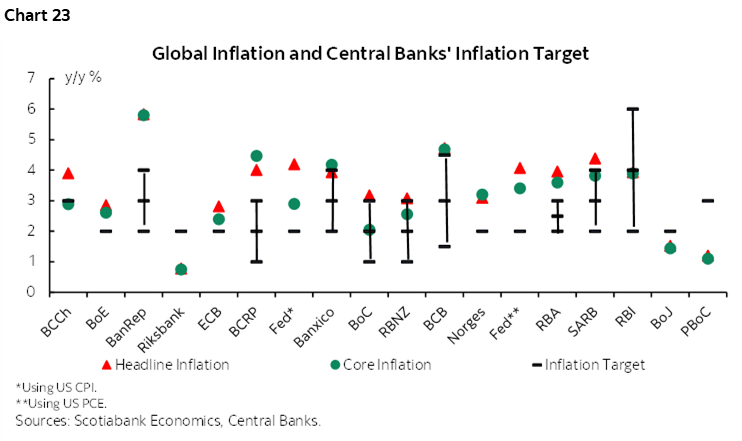
Several countries across Asia, Latin America and a couple Scandinavians will report CPI figures for June. The Philippines (Monday) will be followed by Taiwan and Colombia (Tuesday), then China, Chile and Sweden (Wednesday) followed by Mexico on Thursday and then Norway and Brazil on Friday. Chart 23 shows tracking of where several countries stand on inflation relative to targets.
Canada only reports purchasing managers’ indices for June (Monday), trade figures for May (Tuesday) that will help out with Q2 GDP tracking and that are looking up, and the little watched Ivey PMI for June (Tuesday).
Americans returning from the July 4th holiday will face an easy week for calendar-based developments. ISM-services for June (Monday), a wider expected trade deficit in May (Tuesday) and existing home sales during June (Thursday) that could benefit from rising pending home sales that reflect contract signings before closings.
In Europe, the main focus will be on Germany’s industrial and export drivers of growth. Factory orders (Monday) have been volatile but recently trendless while exports (Thursday) have been rising. Asia-Pacific markets face little by way of additional fresh developments other than aforementioned central banks and inflation figures.
DISCLAIMER
This report has been prepared by Scotiabank Economics as a resource for the clients of Scotiabank. Opinions, estimates and projections contained herein are our own as of the date hereof and are subject to change without notice. The information and opinions contained herein have been compiled or arrived at from sources believed reliable but no representation or warranty, express or implied, is made as to their accuracy or completeness. Neither Scotiabank nor any of its officers, directors, partners, employees or affiliates accepts any liability whatsoever for any direct or consequential loss arising from any use of this report or its contents.
These reports are provided to you for informational purposes only. This report is not, and is not constructed as, an offer to sell or solicitation of any offer to buy any financial instrument, nor shall this report be construed as an opinion as to whether you should enter into any swap or trading strategy involving a swap or any other transaction. The information contained in this report is not intended to be, and does not constitute, a recommendation of a swap or trading strategy involving a swap within the meaning of U.S. Commodity Futures Trading Commission Regulation 23.434 and Appendix A thereto. This material is not intended to be individually tailored to your needs or characteristics and should not be viewed as a “call to action” or suggestion that you enter into a swap or trading strategy involving a swap or any other transaction. Scotiabank may engage in transactions in a manner inconsistent with the views discussed this report and may have positions, or be in the process of acquiring or disposing of positions, referred to in this report.
Scotiabank, its affiliates and any of their respective officers, directors and employees may from time to time take positions in currencies, act as managers, co-managers or underwriters of a public offering or act as principals or agents, deal in, own or act as market makers or advisors, brokers or commercial and/or investment bankers in relation to securities or related derivatives. As a result of these actions, Scotiabank may receive remuneration. All Scotiabank products and services are subject to the terms of applicable agreements and local regulations. Officers, directors and employees of Scotiabank and its affiliates may serve as directors of corporations.
Any securities discussed in this report may not be suitable for all investors. Scotiabank recommends that investors independently evaluate any issuer and security discussed in this report, and consult with any advisors they deem necessary prior to making any investment.
This report and all information, opinions and conclusions contained in it are protected by copyright. This information may not be reproduced without the prior express written consent of Scotiabank.
™ Trademark of The Bank of Nova Scotia. Used under license, where applicable.
Scotiabank, together with “Global Banking and Markets”, is a marketing name for the global corporate and investment banking and capital markets businesses of The Bank of Nova Scotia and certain of its affiliates in the countries where they operate, including; Scotiabank Europe plc; Scotiabank (Ireland) Designated Activity Company; Scotiabank Inverlat S.A., Institución de Banca Múltiple, Grupo Financiero Scotiabank Inverlat, Scotia Inverlat Casa de Bolsa, S.A. de C.V., Grupo Financiero Scotiabank Inverlat, Scotia Inverlat Derivados S.A. de C.V. – all members of the Scotiabank group and authorized users of the Scotiabank mark. The Bank of Nova Scotia is incorporated in Canada with limited liability and is authorised and regulated by the Office of the Superintendent of Financial Institutions Canada. The Bank of Nova Scotia is authorized by the UK Prudential Regulation Authority and is subject to regulation by the UK Financial Conduct Authority and limited regulation by the UK Prudential Regulation Authority. Details about the extent of The Bank of Nova Scotia's regulation by the UK Prudential Regulation Authority are available from us on request. Scotiabank Europe plc is authorized by the UK Prudential Regulation Authority and regulated by the UK Financial Conduct Authority and the UK Prudential Regulation Authority.
Scotiabank Inverlat, S.A., Scotia Inverlat Casa de Bolsa, S.A. de C.V, Grupo Financiero Scotiabank Inverlat, and Scotia Inverlat Derivados, S.A. de C.V., are each authorized and regulated by the Mexican financial authorities.
Not all products and services are offered in all jurisdictions. Services described are available in jurisdictions where permitted by law.