

Next Week's Risk Dashboard
- The bond market that I warned about and why it may be more attractive
- Deal or no deal? Tariffs and CUSMA crunch time
- US to impose ‘never been seen’ sanctions on Iran...
- ...and how they could be destabilizing
- Canadian CPI — when core isn’t core
- FOMC minutes — Stale and fresh…
- …with the focus on Warsh’s four questions
- Canada’s housing market is surging
- Get used to a weak US housing market
- Global PMIs — front-loaded strength?
- Australia wages and jobs still going strong?
- UK jobs & wages still cooling?
- Q2 GDP: Japan, Chile, Peru, Colombia
- Riksbank after the vote…
Chart of the Week
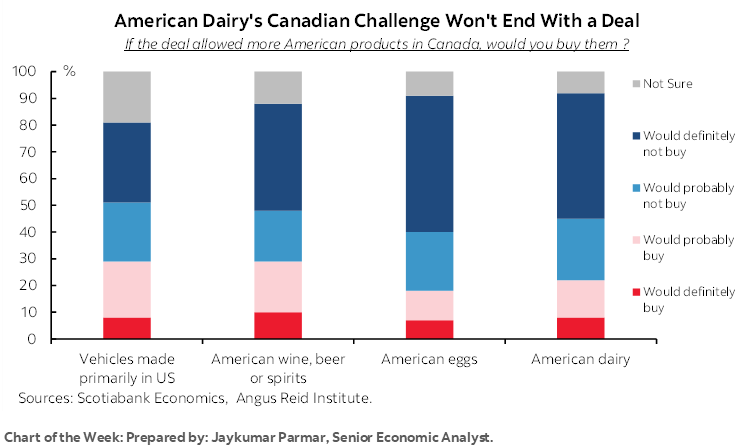
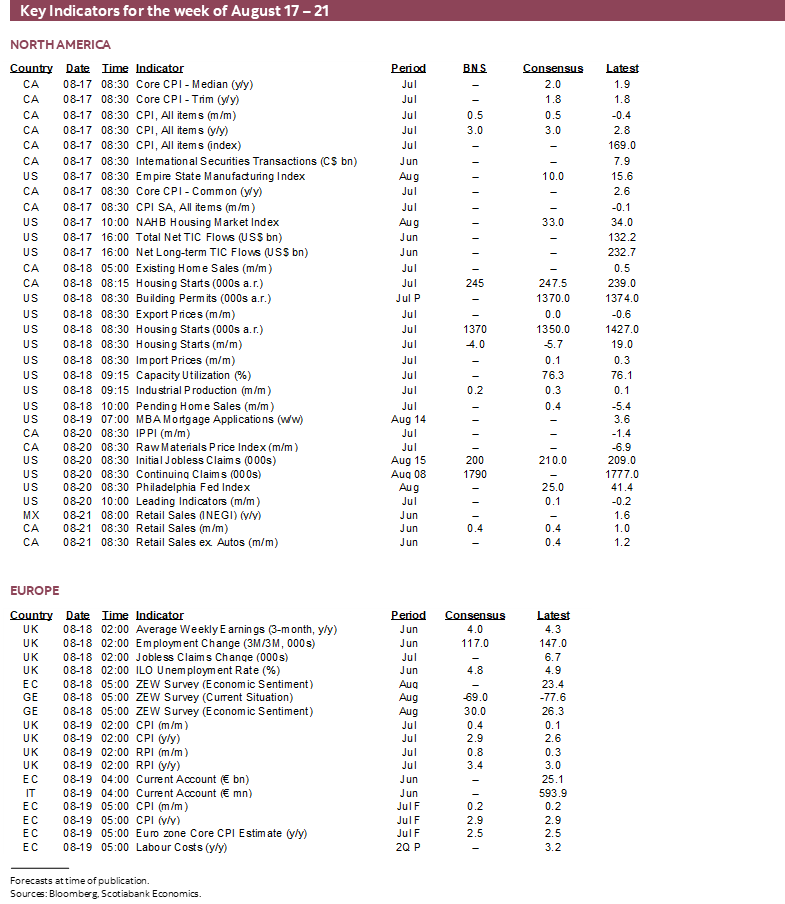
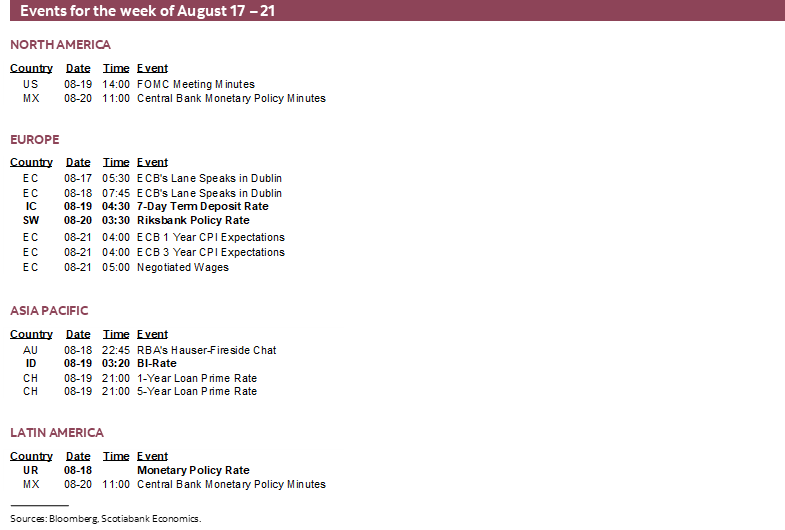
Tariffs and sanctions could well dominate market developments over the coming week over and above a bevy of global macro readings across many areas of the world. FOMC minutes will be mostly stale on arrival but with a twist, and only two regional central banks will weigh in with expected holds.
And yet front and centre in terms of market concerns is also how much further the bond selloff may go. It’s what I warned about in writings dating back to before the US election in November 2024.
As procyclical fiscal policy began to be priced in on rising bets that Trump would win the election, the US 10-year Treasury yield climbed from about 3¾% in September 2024 to 4.7% now. At the time, I noted that “This isn’t 2016 when bond markets didn’t care about inflation and issuance. This is 2024, the US economy doesn’t need pump priming, it’s in excess demand and will remain there next year, and Trump’s plans risk being highly destabilizing to world markets.”
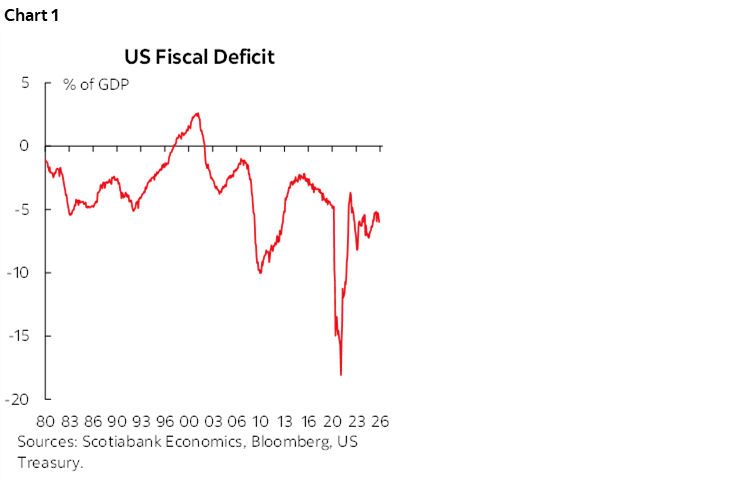
Yet the OBBA tried to repeat the TCJA of 2018 in a totally different backdrop for inflation risk and how bond markets would react and the result has been to rock bond markets and drive persistently high deficits (chart 1). The Trump administration delivered upon everything I said it would prior to the election from trade frictions to geopolitical risk to wider deficits and higher bond issuance, tighter immigration policy and more spirited attacks on federal agencies and the Fed.
Yet my belief is that we have a much more attractive entry point to US Treasuries with US 10s around 4.7% and 30s at 5¼%. Here are some supporting reasons:
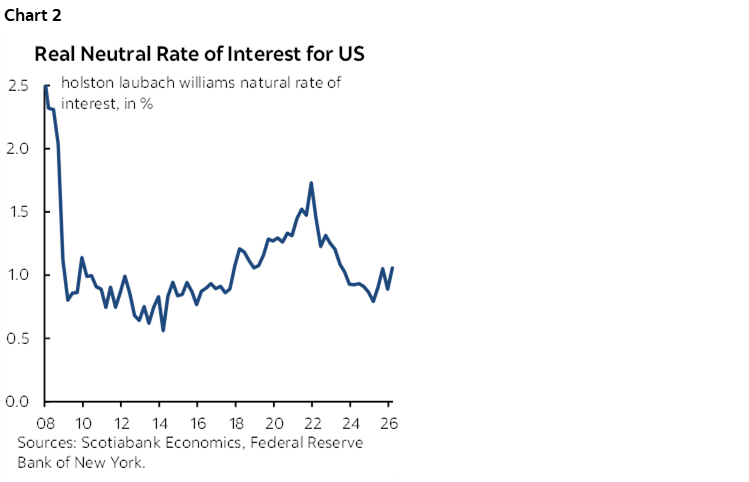
- I find it reasonable to continue to believe that the Fed’s real neutral R* rate of interest is about 1% (chart 2).
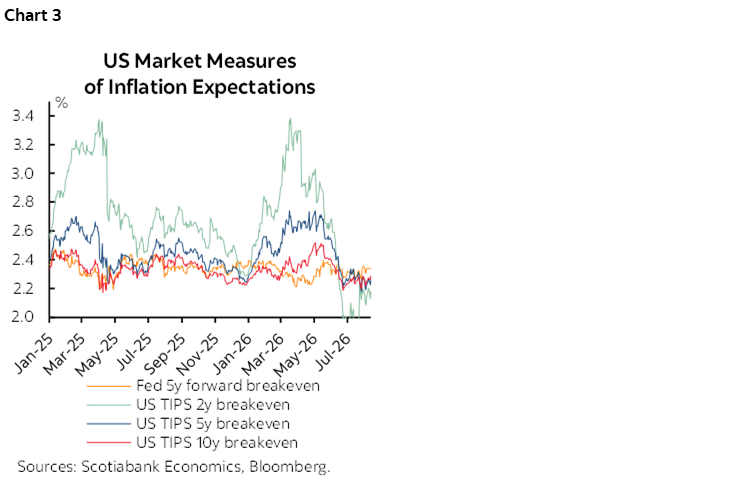
- Five-year expected inflation is at or a little above 2% which is also probably reasonable if not a tad high (chart 3).
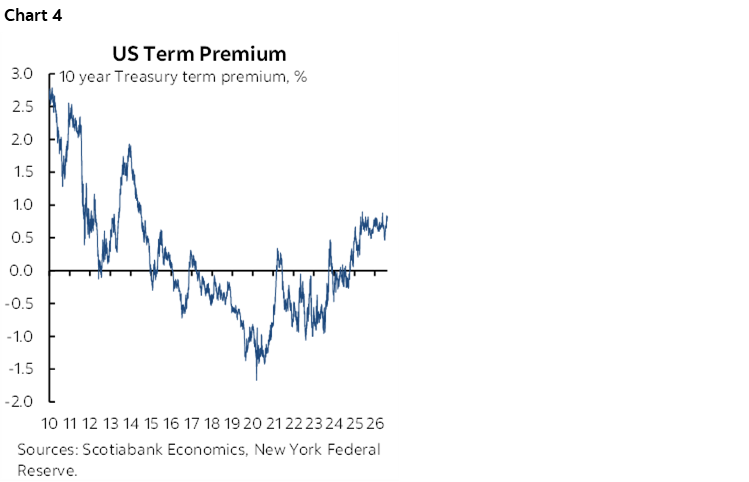
- The term premium has, in my opinion, gone far enough away from a low of -65bps in 2020 to over +80bps now and at the highest on a zero-coupon US 10-year bond since just after the GFC (chart 4). One reason it may have moved higher of late is because Chair Warsh’s communications may have confused markets or created a heightened sense of uncertainty.
- Nominal US GDP growth can be correlated with the nominal US 10-year yield but a) there can be large deviations in the relationship at times, and b) today highlights the importance of viewing it in an expected sense. It’s wrong to point to current NGDP growth of 6½% y/y as justification for a continued bond sell off at least given my view that real growth and expected inflation are likely to come in far below that on average over the next ten years. Applying the same simplistic logic coming out of the pandemic when NGDP growth accelerated to over 17% y/y would have made for a totally bonkers Treasury yield forecast.
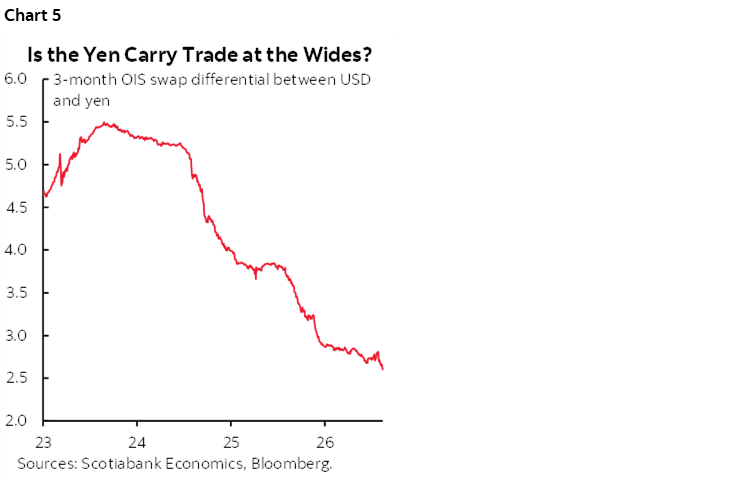
- A limiting influence upon the US Treasury sell off is the yen carry trade. It has grown in its attractiveness as trend yen weakness funds interest in the front-end of the US Treasury market (chart 5). This may be part of why the US 2s sell off has moderated since late July.
- Last for now is that on a fundamentals basis, I still find it difficult to believe in the case for Fed tightening in terms of a wavering job market and various inflation arguments provided in last week’s weekly.
At this point I don’t see strong reason to back off our forecast for the US 10-year Treasury yield to continue to pull off the peaks toward 4½% at the end of Q3 and 4.35% end of Q4.
TARIFFS AND CUSMA—STAY TUNED
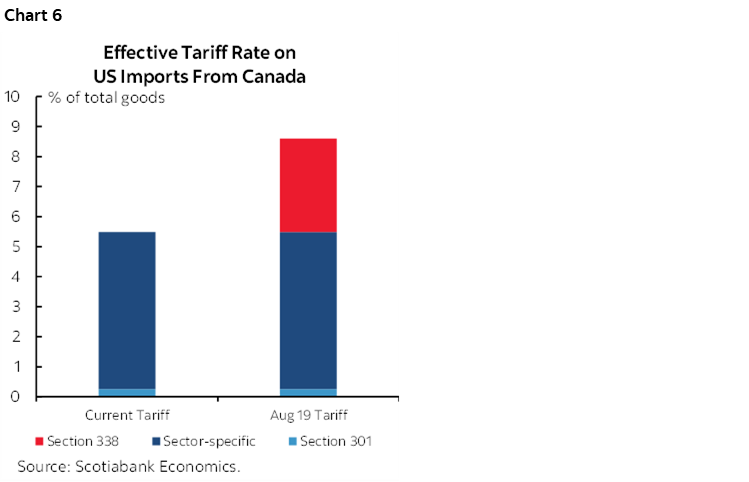
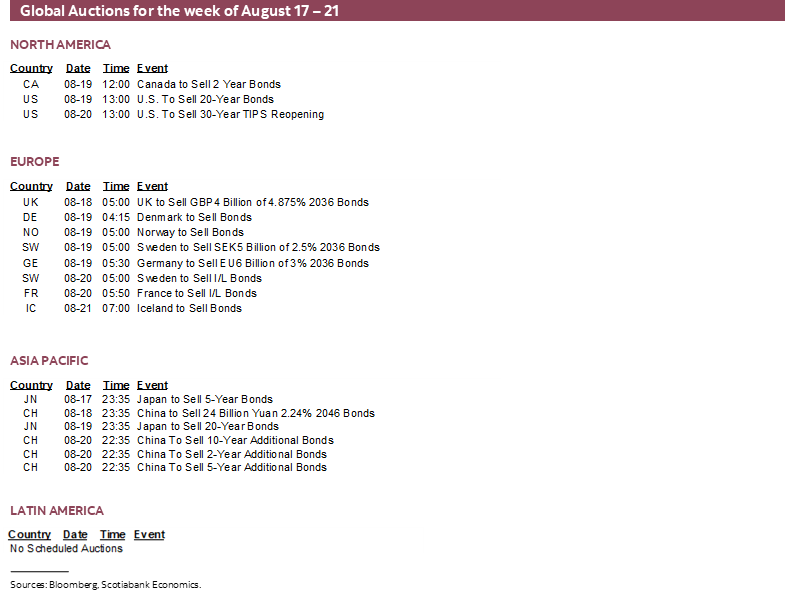
Wednesday at midnight is the deadline for an interim agreement to be struck between Canada and the US in order to avert new 50% tariffs on $20 billion of Canadian exports to the US. As previously noted, such a tariff hike could meaningfully raise the average effect tariff rate on Canadian exports (chart 6) while remaining below what is charged to virtually every other major US trading partner.
A grand all-encompassing agreement is unlikely at this stage. It’s actually in Canada’s interests to hold back some cards especially given the Trump administration’s unreliability. For now, either Trump extends the deadline, or an interim agreement is struck. It’s unclear which scenario will prevail, but we maintain cautious optimism. Why? Because going ahead with tariffs would exact a toll on both sides. The US administration would inflame tensions with a major trading partner and further harm how US voters view its foreign and affordability policies ahead of the November 7th midterms. The tariffs would likely invite retaliation that should be delivered in my view. Most economists would argue that retaliation only imposes further pain. Done properly in highly targeted fashion against politically influential areas of the US economy it can be the only language understood by the US administration.
I wrote about this last week and since then we’ve seen fits and starts in terms of reported progress and tensions. Leakers on both sides are either punching above their weight, floating trial balloons, misinformed, or sharing genuine guidance. Flies on the wall left to sift through the volatility in media reports are best advised to simply see what comes.
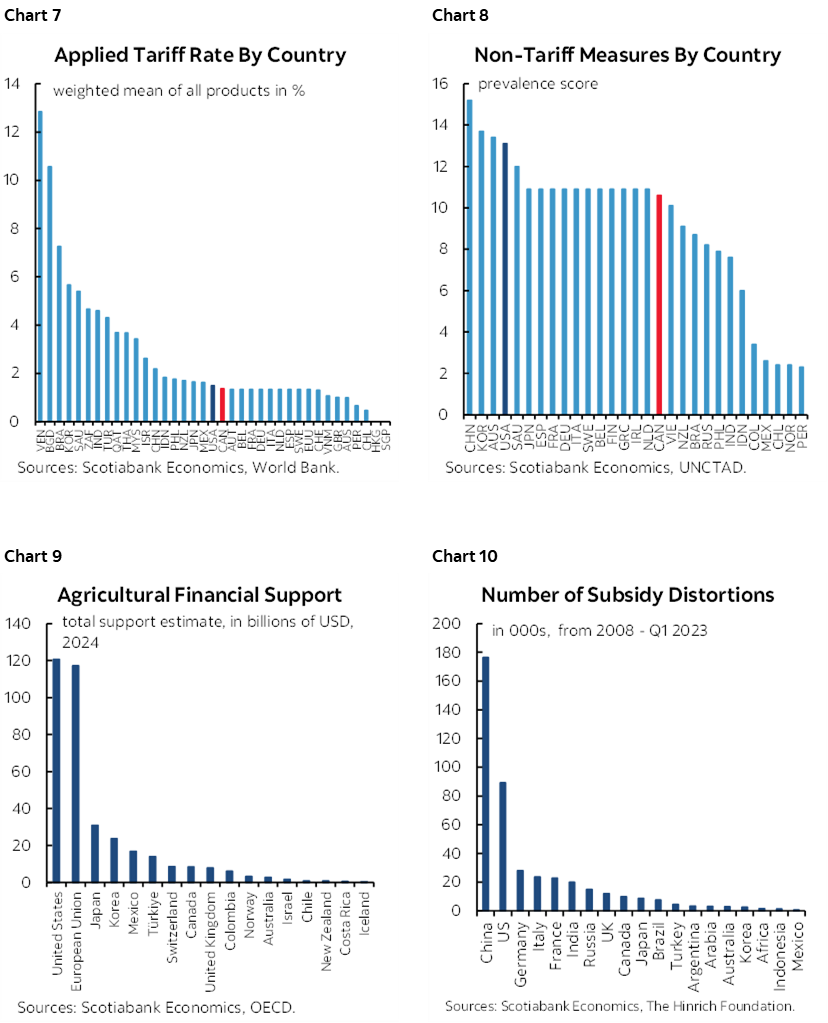
The US started a trade war—that it doesn’t like calling a trade war—with multiple countries and has the nerve to complain about retaliation. It had no justification for doing so against Canada where the average tariff rate was the same as the US (chart 7), non-tariff barriers were the same (chart 8), and Canada subsidizes its economy much less so than the US (charts 9, 10).
Fwiw, I would fully support rejecting a bad deal on trade with overly expensive commitment to defence and security initiatives with taxpayers and bond markets left to foot the ball even if it meant a protracted period of uncertainty. This stance worked in 1988, 1992 and 2018 and today Canada holds many cards as argued last week. Canada should be prepared to walk.
ON ALERT FOR SANCTIONS
Watch for a potentially major escalation of trade and market tensions beginning this week. That’s because US Treasury Secretary Bessent pledged to introduce “measures like have never been seen in the history of economic isolation of a country” over the coming week.
What could Bessent do to economically isolate Iran further and that has ‘never been seen’? What could be the effects?
Target China and India: China is the main buyer of Iranian oil and is involved in undermining US sanctions. The US sanctions some individual Chinese entities and in April announced sanctions against Chinese “Teapot” refineries (here). The US could up the actions by sanctioning all—this time including large—Chinese banks and blocking access to the US and global financial systems. That would push China further away from the SWIFT system and block access to correspondent and other forms of banking. It could block access to US dollar funding markets. This would very likely enrage China and risk multiple forms of retaliation and escalation.
Broaden the scope of sanctions on Iran: This would extend the scope to any global group, company or entity that is involved in buying, financing, insuring or shipping Iranian oil. Looking at you, global banks, currency exchanges, commodity traders, shippers etc. Actions under this category would aim to entirely thwart the sale of oil from Iran to China in yuan and converted to dollars and other currencies via exchange houses in Iran and elsewhere. You target other Middle Eastern nations facilitating this trade by blocking their access to dollar funding and global banking markets. Like Dubai’s one-foot-in-and-one-foot-out stance on the war that continues to facilitate Iranian transactions. Dubai fancies itself as a financial centre; you destroy such ambitions.
Target Iranian crypto assets: This Treasury announcement last month targeted individuals and entities under a specific Iranian person’s name. The US could broaden this action to include freezing access to all Iranian global holdings of crypto, gold, real estate, foreign accounts etc.
Target global ports: Anyone foreign port that facilitates trade and transactions with shipping companies that transited Iranian ports could be targeted.
And there may well be other creative options in scale and scope. The broad point is to escalate the economic and financial blockade of the Iranian economy and financial system by enveloping all parts of the global economy—namely China—and global financial system that allow Iran to continue to sell oil and access funding markets.
Would it work? I’m not sure but I doubt it. Iran knows suffering. Iran is used to being a pariah. Iran still has friends in low places. Iran, and the proxies it supports, have their own means of escalating including unleashing unspeakable terror.
The consequences to the global economy and financial system could also limit or entirely thwart chances at success. I’m sure they know the risks (errr…..), but Treasury would sharply amplify tensions with China (and India) and could potentially cripple individual banks while not ruling out increased systemic risk within the broader financial system. That could boomerang back upon major central banks across the world including the Fed. Cutting off access to dollar funding markets could destabilize major players in the financial system. The spillover effects through a complicated web of connections shouldn’t be treated lightly.
The US is finally getting that it can’t just bash and bomb its way to victory against Iran. I’m not sure it gets the limitations and risks that could be associated with escalating broader measures at an all-encompassing global level. It could well take a bungled war that the US and Israel went into without much thought, without a strategy, and without an exit plan while not consulting Congress or allies and compound the missteps even further and potentially more seriously.
CANADIAN INFLATION—WHEN CORE ISN’T CORE
Canada refreshes CPI for the month of July on Monday morning. This is the last reading before the Bank of Canada’s next decision on September 2nd at which we expect the BoC to hold its overnight rate unchanged at 2.25% in a statement-only affair. The October MPR will present fresh forecasts.
Total CPI is estimated to have risen by 0.5% m/m seasonally unadjusted that would translate into about a 0.3% m/m SA rise. The year-over-year rate is projected to increase to 3.0% from 2.8% previously.
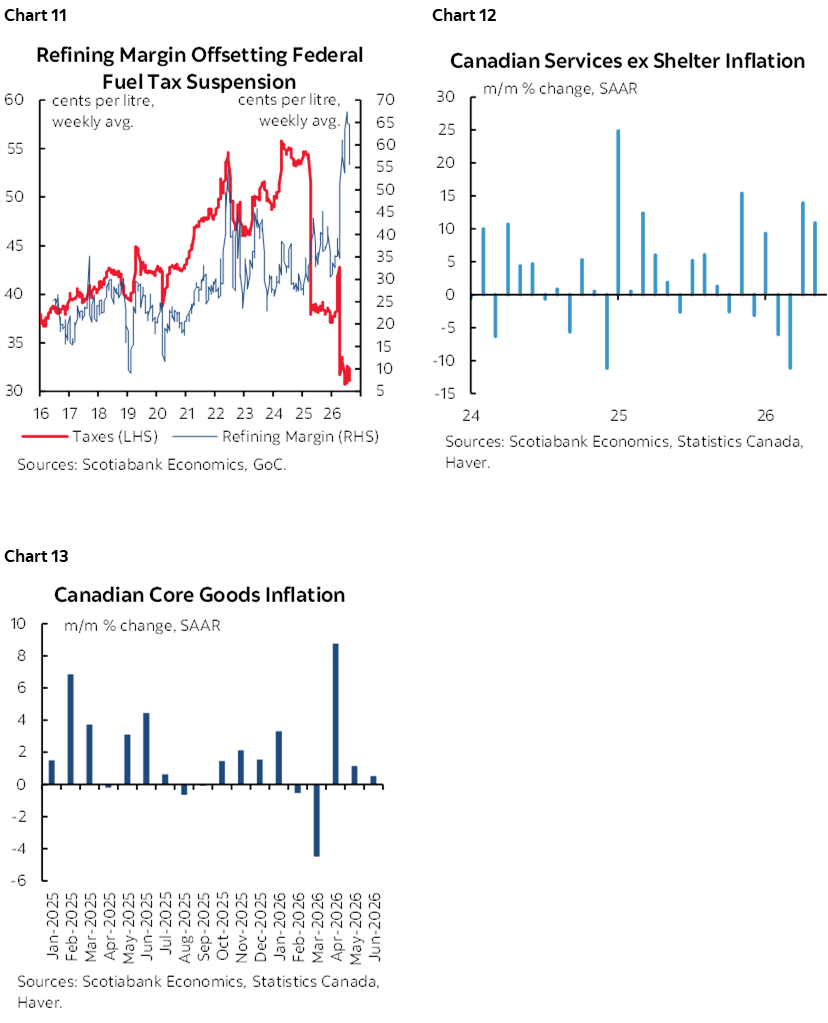
Year-ago base effects would drop the y/y total CPI rate to about 2½% if there were no other price changes. July is normally a seasonal up-month across several categories. Gasoline prices will add a bit to m/m CPI and food prices are also expected to contribute. In my view, there is a strong case for ending the gasoline tax holiday on schedule after Labour Day because refineries have grabbed the space for themselves (chart 11). To the downside, core service prices ex-shelter are expected to retrench from the prior two strong readings (chart 12), although core goods inflation may be ripe for a rebound (chart 13). Some of that surge was driven by travel services which was partly driven by the release of pent-up demand for travel and partly by World Cup effects on Vancouver and Toronto.
Key, however, will be the core measures of inflation that have been diverging somewhat. In May and June, traditional core CPI (ex-food and energy) climbed by 3.1% m/m SAAR and 3.9% respectively. The three-month moving average of this measure has been running at 2.6%.
By contrast, trimmed mean and weighted median CPI have been volatile. March and April saw both measures accelerate out of the prior soft patch, only to stumble somewhat again in May and June. The average increase in trimmed mean CPI over the prior two months was 1.6% m/m SAAR and it was 1.7% for weighted median CPI.
It’s impossible to credibly forecast month-over-month changes in trimmed mean and weighted median CPI given the lack of enough price data and the extreme sensitivity of the calculations. We want a smoothed measure for recent price changes as opposed to the year-over-year trimmed and weighted median measures that are slowing moving, compounded, month-over-month changes in prices.
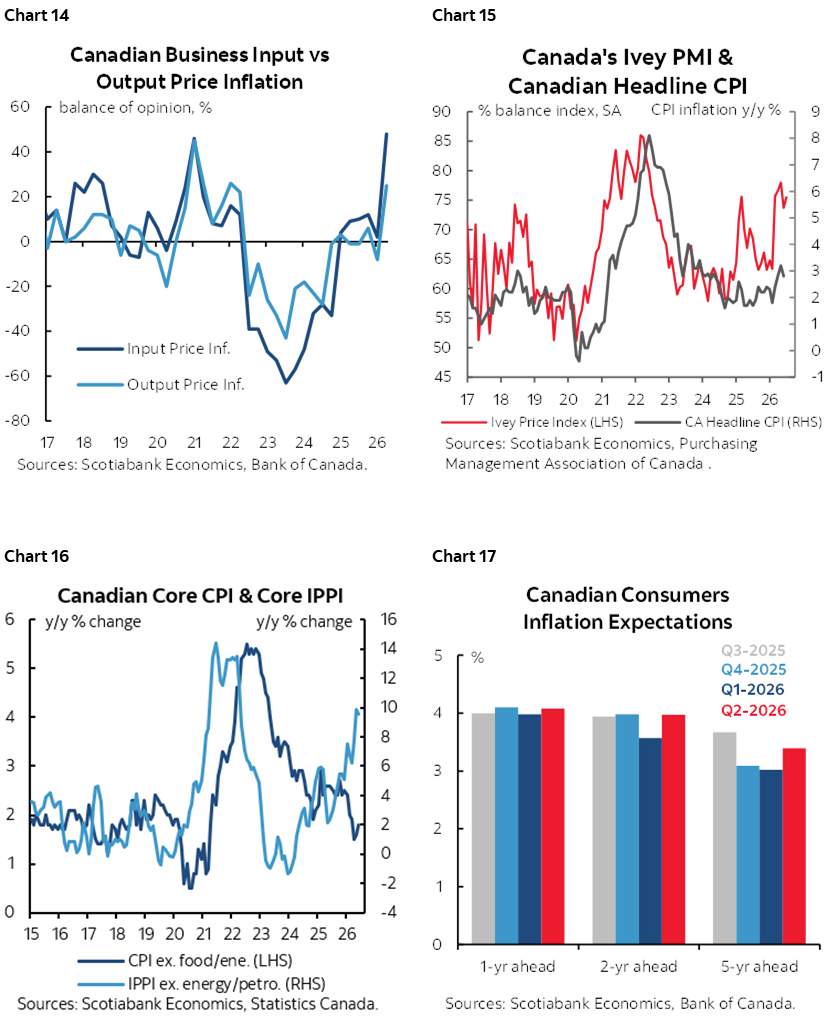
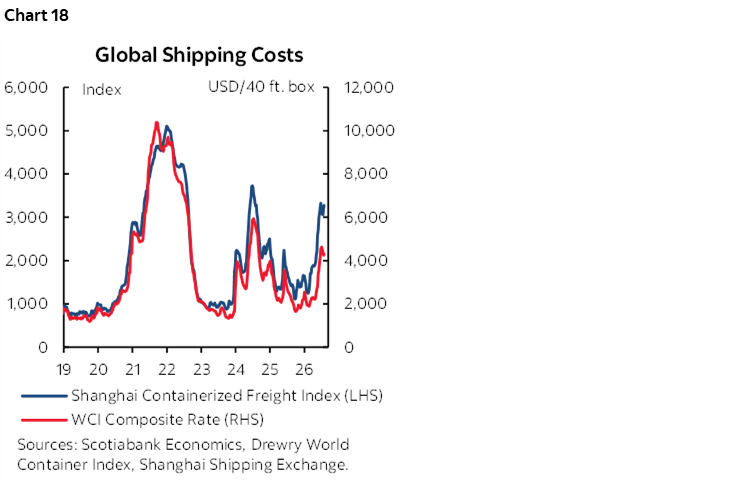
Inflation risk remains elevated going forward. Survey measures indicate building price pressures with pass through risk (charts 14, 15). Core industrial product price inflation points to lagging upside to core CPI (chart 16). Inflation expectations remain elevated (chart 17). Gas prices are likely to remain high. Transportation costs have been under upward pressure (chart 18).
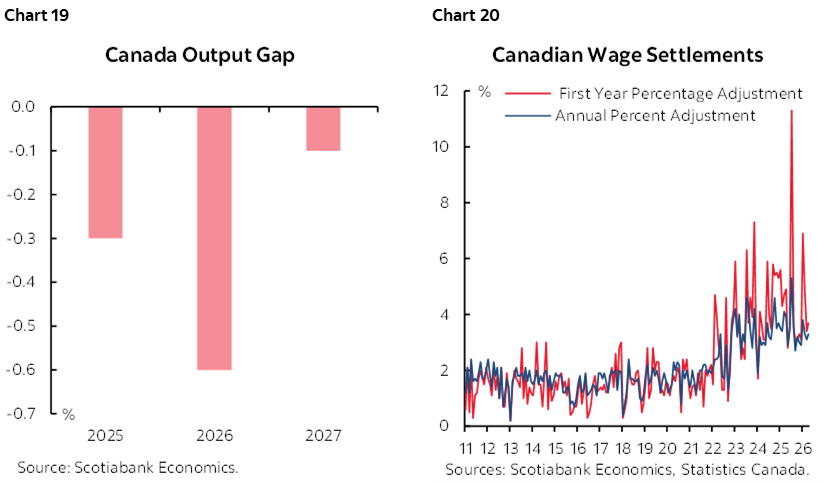
Further, Scotia Economics continues to anticipate narrowing excess capacity as growth rebounds smartly (chart 19) while cost pressures remain significant. Wages are volatile but wage settlements drawn from the one-third of the workforce that is unionized continue to rise above the BoC’s inflation target (chart 20) while productivity trends remain soft. Thus, unlike the US where only 10% of the workforce is unionized and facing real wage compression, Canada’s wage settlements suggest real wages will keep pace for years to come.
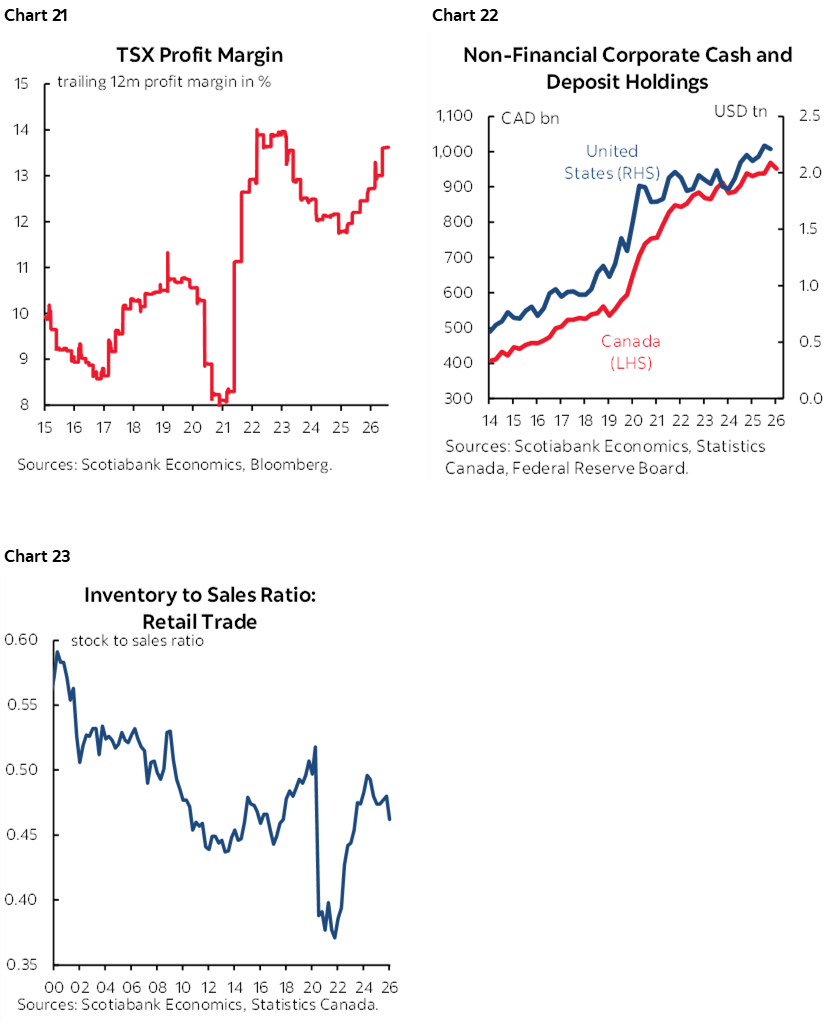
Beyond slack, added uncertainties include high cash positions and profit margins in the corporate sector that give the flexibility to absorb some cost pressures at least for a time until shareholders get tired of absorbing higher costs (charts 21, 22). Retail inventory-to-sales levels are off the pandemic lows but still toward the low end of history (chart 23), implying there isn’t much of a buffer of older product at earlier prices to sell down.
Going forward, if monetary policy is unchanged at a very low inflation-adjusted policy rate and fiscal pump priming continues in the context of a commodity surge while a trade agreement is within reach, then there remains a case for a forward-looking central bank to embrace insurance hikes in the face of upside risk to inflation while sitting at the lower bound of neutral.
As for AI, it’s too early to matter much in Canada. Electricity prices and prices for electrical components have been soaring, but they have very low weights in Canadian CPI.
CENTRAL BANKS—WARSH’S FOUR QUESTIONS
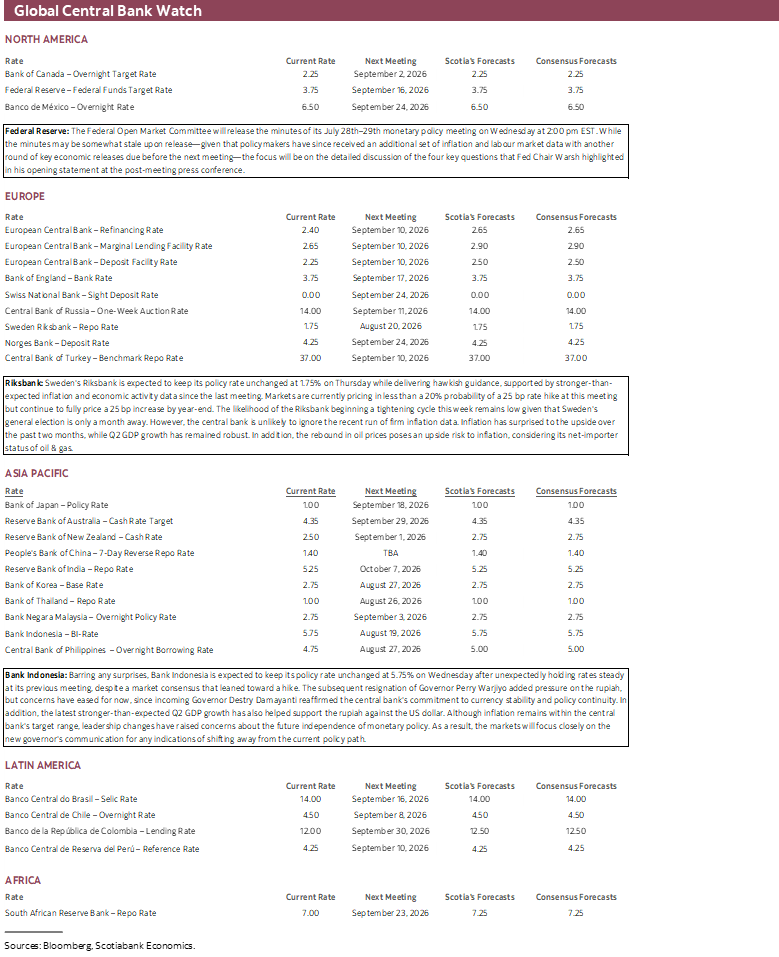
Two regional central banks weigh in with decisions over the coming week but could be overshadowed in global markets by the minutes to the July FOMC meeting.
FOMC Minutes—Stale and Fresh
The only thing that may be of interest in Wednesday’s 2pmET publication of minutes to the July 28th–29th FOMC meeting may be the deeper discussion on four main questions that Chair Warsh laid out in his press conference. Those questions included:
1. What are the implications of the past five years of high inflation on the current policy conjuncture?
2. The economic shocks of recent years were considered including the pandemic, military conflict, energy shocks, AI surge and tariffs. Do they differ in their effects?
3. We took up the issue of changes in prices and whether they are generalized or narrow.
4. We focused upon monetary policy strategies to achieve price stability.
While the range of opinions referenced in the frequency of citations language employed by the minutes may be useful, what they think about potential near-term policy decisions may be less so.
The reason for that is that data and developments since that meeting have made the discussion a bit stale. Nonfarm payrolls have been weak for the past three months including a revised 63k gain in May, then 20k in June, and then a -23k drop in July. Core CPI inflation has been on a three-month softening trend. Pricing for rate hikes by the Federal Reserve has followed our advice to receive a temporary overshoot of short-term market interest rates. July’s meeting had 8bps priced that vapourized after the hold. September’s meeting was priced for about 27bps of a hike and is now at just 8bps. October was at 35bps in late July and now sits at half of a quarter-point hike. Year-end pricing has been cut from 44bps to 23bps now.
Bank Indonesia—Rebuilding Credibility
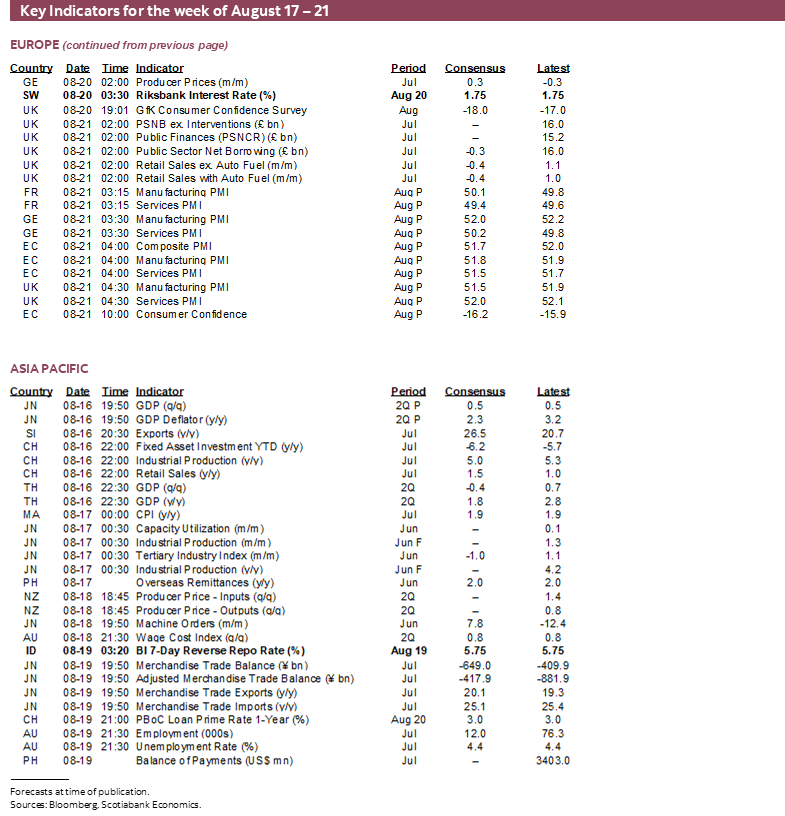
Consensus unanimously expects Indonesia’s central bank to hold at an unchanged policy rate of 5.75% on Wednesday after surprising markets with a hold against hike expectations in July. Since the prior meeting, the rupiah has been relatively stable and despite the resignation of Governor Perry Warjiyo. There continues to be a pall cast upon the central bank under the new leadership of Governor Destry Damayanti who must build market credibility.
Riksbank—Let’s Get the Vote Over with First
Sweden’s central bank is widely expected to stay on hold at 1.75% on Thursday. Markets are priced for a 25bps rate hike by year-end with gradually escalating probabilities over the next four meetings. Swedes go to the polls on September 13th and it’s the rare central banker that wishes to make an election about himself or herself! They previously said at the last decision on June 17th that “the probability of the rate being raised later this year has increased compared to the assessment in March.” The bank is likely to wait out the election and seize the opportunity presented by publication of the next round of forecasts on September 24th to refresh its guidance.
GLOBAL MACRO—SOMETHING FOR EVERYONE
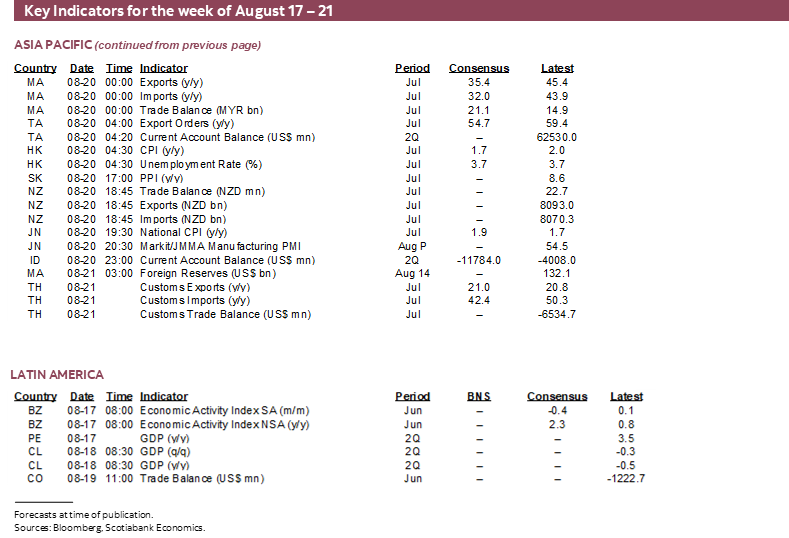
A wave of global macro indicators will be unleashed across many markets. The US will focus upon sustained housing weakness and soft manufacturing. Canada will focus upon rebounding housing and volatile retail sales. Global PMIs, UK jobs and inflation, Aussie jobs and inflation and several GDP reports from LatAm and Asian economies are all on the docket. I’ve partnered with my colleague Jay Parmar on what follows.
Canada—Surging Housing, Volatile Retail
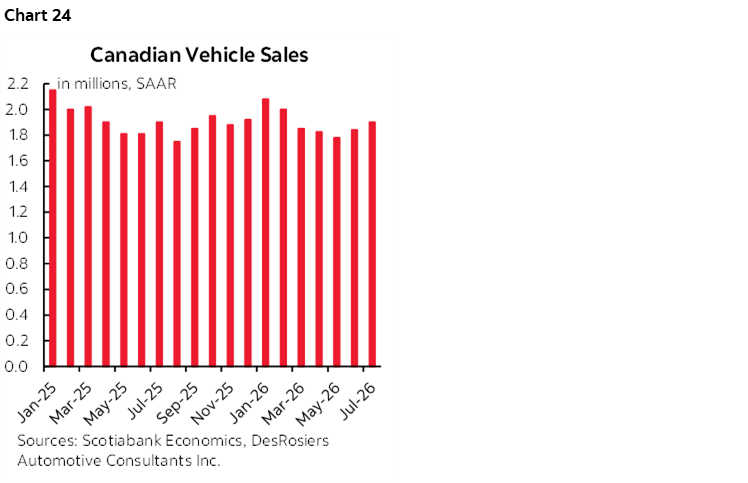
Canada refreshes a handful of readings in addition to CPI this week. Key is Friday’s retail sales report for June with more of the attention upon preliminary guidance for July. Statcan guided on July 23rd that the nominal value of sales during June was tracking a 0.4% m/m SA rise. That would mean very little if any growth in sales volumes. If so—and barring revisions that are common—then Q2 sales volumes are tracking a dip of under -1% q/q SAAR. This follows a surge of 5.4% q/q SAAR in Q1 that probably brought forward some momentum. One contributor to the volatility has been auto sales that peaked in January, slipped for the next four months and have risen for the past two months (chart 24). That could be helping to set up a more favourable Q3.
Canada also refreshes existing home sales for July (Tuesday) that have posted three consecutive monthly gains. Housing starts may rebound in July’s reading (Tuesday); new home sales in Ontario reportedly surged by 130% y/y according to BILD as the government eliminated the 13% HST on sales. This is likely to drive a major surge in housing starts.
US—Get Used to Weak Housing Markets
This will be a light data week in the US. Enjoy it while it lasts.
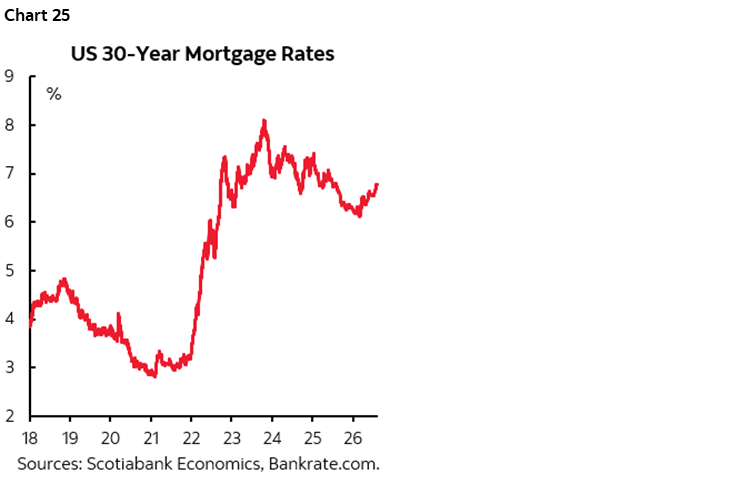
Housing will figure prominently. Homebuilder confidence in August (Monday) will tell us more about model home foot traffic that has been hugging around the lows of the post-GFC period. Housing starts during July (Tuesday) are likely to drop after a 19% m/m prior surge despite relatively tame building permits, suggesting volatile weather patterns are among the drivers. Pending home sales have been floating around the lowest readings since the series started at the turn of the century. Why? Chart 25 offers an answer. The other part of the answer is that whereas the Tax Cuts and Jobs Act primed the pump on growth in Trump 1.0, it was delivered in an environment of slack in the economy. The OBBA that was passed last year was not; the US economy remains in excess aggregate demand. Stimulus today lit up inflation fears and bond markets acted to sterilize it, thereby driving the 30-year fixed mortgage rate higher. The administration’s policies have impaired housing.
Also keep an eye on industrial gauges. The NY Fed’s Empire manufacturing readings for August (Monday) kicks off the regional surveys on the path to the next ISM-manufacturing print. The Philly Fed’s measures then arrives on Thursday. Industrial production may post a mild gain but manufacturing output has been flat for the past two months.
Global PMIs—Front-Loaded Strength?
To help gauge global growth momentum in Q3, markets will receive another round of August flash PMI releases this week. The data begin with Australia and Japan on Wednesday, followed by India, Europe, the UK, and the US on Thursday.
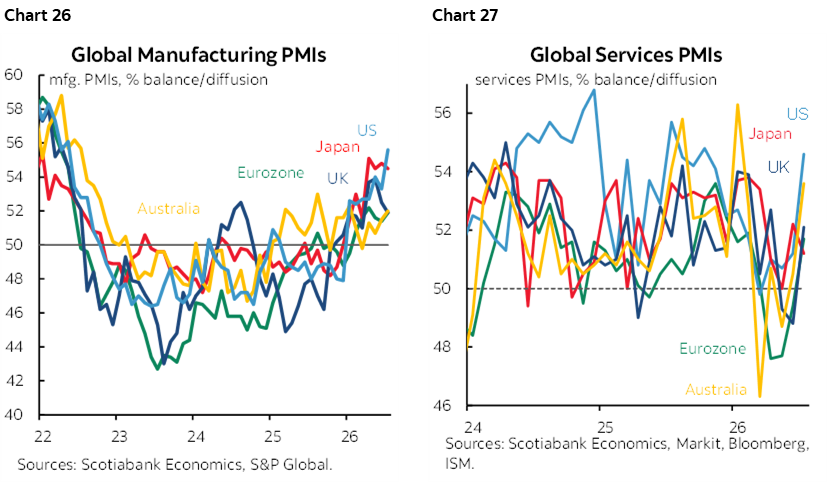
Global supply chain disruptions, strong demand for AI-related products, and a precautionary inventory build-up have driven significant front-loading of orders, supporting robust manufacturing activity across major economies since the start of the year (chart 26). More recently, however, there have been tentative signs that manufacturing momentum is moderating, as inventory accumulation slows amid adequate stock levels and demand softens in response to higher prices and elevated uncertainty. Meanwhile, services activity, which weakened sharply following the outbreak of the Middle East conflict, showed signs of stabilization in June before strengthening more broadly in July (chart 27), buoyed by summer events and tourism. Stronger demand for services has also kept inflationary pressures elevated.
Taken together, global composite PMIs are expected to continue pointing to solid growth momentum heading into Q3 despite geopolitical uncertainty, while inflationary pressures remain elevated.
UK—Not Much is Riding on Jobs and Inflation
After the BoE's more hawkish-than-expected 6–3 vote split to hold rates at its last meeting, attention will shift to incoming data ahead of September's policy decision.
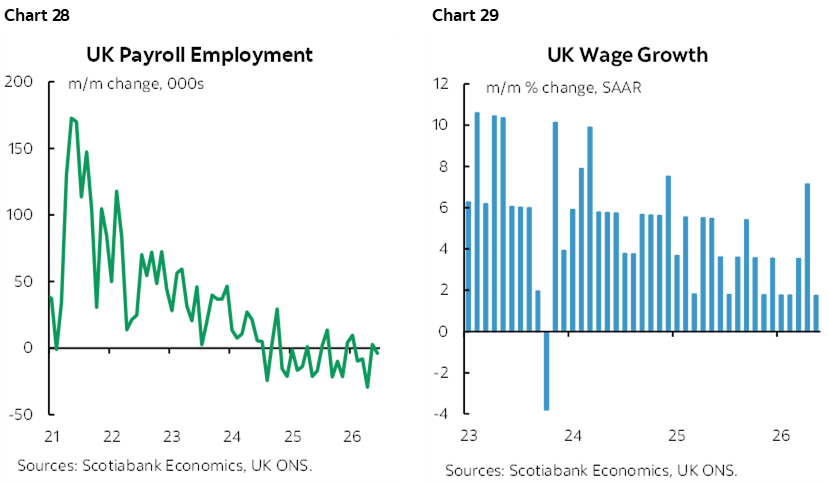
Following modest 0.4% q/q GDP growth in Q2, this week's focus will be on the first of two-labour market and inflation releases before the September meeting. Tuesday's labour market report is expected to reinforce the picture of gradual easing of job growth, with payroll employment contracting in four of the past six months (chart 28), vacancies trending lower and wage growth moderating (chart 29). In contrast, the Labour Force Survey continues to signal a more resilient labour market, with unemployment falling from 5.2% to 4.9% and expected to ease further to 4.7%. Given persistent concerns around response rates and the volatility of LFS estimates, policymakers are likely to focus on the broader trend rather than any single data point.
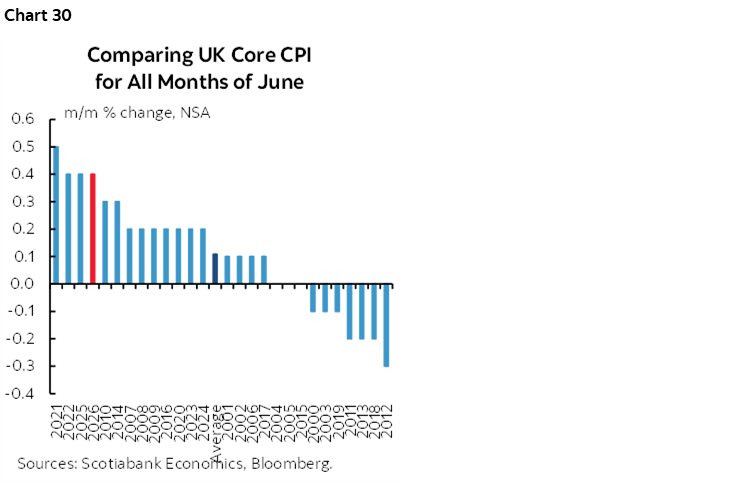
On the following day (Wednesday), attention will turn to CPI for further evidence of underlying disinflation. Recall that the BoE has highlighted "clear signs" of easing price pressures and little evidence of second-round effects from higher energy prices. While both core and services inflation are expected to moderate further on a year-over-year basis, greater attention should be paid to the month-over-month core readings, where favourable base effects are less influential. Indeed, despite the softer headline June inflation print, monthly core inflation remained relatively firm compared with seasonal patterns in previous years (chart 30). A second consecutive firm core reading could revive hawkish expectations and sharpen focus on the final inflation report due just ahead of the September policy meeting.
Australia—Aussie Jobs & Wages
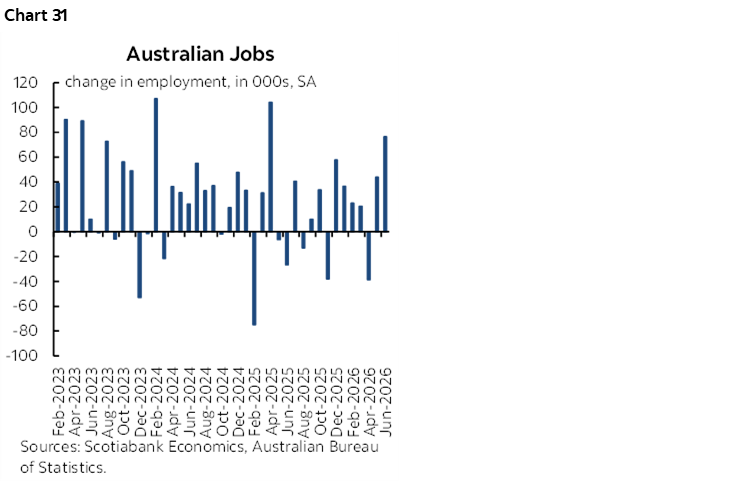
Australia will also refresh one of the two jobs market readings before the next monetary policy meeting on September 29th, alongside Q2 wage growth data on Tuesday. Following back-to-back upside surprises in employment growth (chart 31), labour market momentum remains resilient, with vacancies and job advertisements pointing to further job gains in July while keeping the unemployment rate at 4.4%. Wage growth is also expected to remain steady at over 3% q/q SAAR in Q2, although upside risks persist, supported by large increases across several enterprise agreements and the flow-through of the 4.75% annual wage review increase that came into effect on July 1st.
However, despite resilient employment growth, the RBA has emphasized that labour market conditions have eased slightly more than anticipated, with the unemployment rate rising to 4.4%, above its May forecast of 4.2%, largely due to stronger labour force growth. As such, a single data release is unlikely to alter the broader narrative. Instead, the focus will be on whether incoming data evolve in line with the RBA's expectation of slower employment growth and a gradual rise in unemployment, with any signs of renewed labour market tightening likely to reinforce a more hawkish policy stance.
Global GDP Readings—LatAm & Asia
On the growth front, Q2 GDP figures from Japan and Thailand are due on Sunday, followed by Chile and Colombia on Tuesday, while Brazil will release its June economic activity index on Monday.
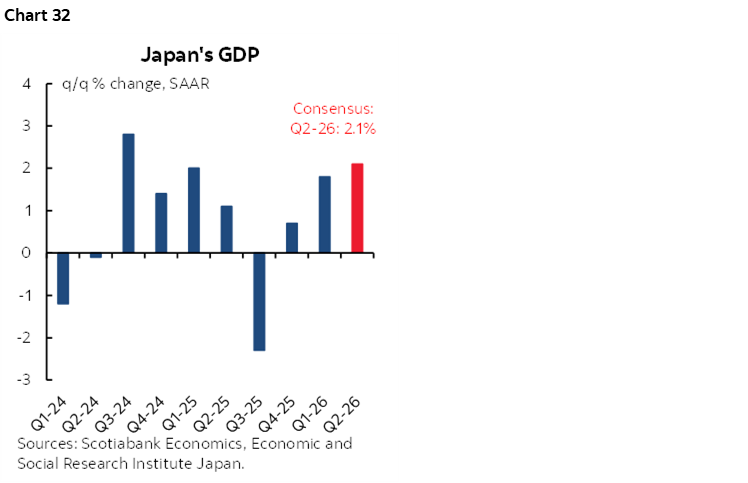
Japan's economy is expected to deliver another solid quarter, with consensus forecasting annualized GDP growth of 2.1% in Q2 (chart 32). As in Q1, growth is likely to be supported by net exports and private consumption, while business investment is expected to rebound after a weak start to the year.
In Latam, monthly economic activity indicators suggest Chile narrowly avoided a technical recession, with Q2 GDP expected to grow just 0.1% y/y after contracting 0.5% y/y in Q1. Beyond the headline, the expenditure breakdown will be closely watched for signs of any weakness in household consumption following softer labour market data. Colombia, meanwhile, is expected to post a pick-up in growth, with GDP expanding by above 3% y/y in Q2.
DISCLAIMER
This report has been prepared by Scotiabank Economics as a resource for the clients of Scotiabank. Opinions, estimates and projections contained herein are our own as of the date hereof and are subject to change without notice. The information and opinions contained herein have been compiled or arrived at from sources believed reliable but no representation or warranty, express or implied, is made as to their accuracy or completeness. Neither Scotiabank nor any of its officers, directors, partners, employees or affiliates accepts any liability whatsoever for any direct or consequential loss arising from any use of this report or its contents.
These reports are provided to you for informational purposes only. This report is not, and is not constructed as, an offer to sell or solicitation of any offer to buy any financial instrument, nor shall this report be construed as an opinion as to whether you should enter into any swap or trading strategy involving a swap or any other transaction. The information contained in this report is not intended to be, and does not constitute, a recommendation of a swap or trading strategy involving a swap within the meaning of U.S. Commodity Futures Trading Commission Regulation 23.434 and Appendix A thereto. This material is not intended to be individually tailored to your needs or characteristics and should not be viewed as a “call to action” or suggestion that you enter into a swap or trading strategy involving a swap or any other transaction. Scotiabank may engage in transactions in a manner inconsistent with the views discussed this report and may have positions, or be in the process of acquiring or disposing of positions, referred to in this report.
Scotiabank, its affiliates and any of their respective officers, directors and employees may from time to time take positions in currencies, act as managers, co-managers or underwriters of a public offering or act as principals or agents, deal in, own or act as market makers or advisors, brokers or commercial and/or investment bankers in relation to securities or related derivatives. As a result of these actions, Scotiabank may receive remuneration. All Scotiabank products and services are subject to the terms of applicable agreements and local regulations. Officers, directors and employees of Scotiabank and its affiliates may serve as directors of corporations.
Any securities discussed in this report may not be suitable for all investors. Scotiabank recommends that investors independently evaluate any issuer and security discussed in this report, and consult with any advisors they deem necessary prior to making any investment.
This report and all information, opinions and conclusions contained in it are protected by copyright. This information may not be reproduced without the prior express written consent of Scotiabank.
™ Trademark of The Bank of Nova Scotia. Used under license, where applicable.
Scotiabank, together with “Global Banking and Markets”, is a marketing name for the global corporate and investment banking and capital markets businesses of The Bank of Nova Scotia and certain of its affiliates in the countries where they operate, including; Scotiabank Europe plc; Scotiabank (Ireland) Designated Activity Company; Scotiabank Inverlat S.A., Institución de Banca Múltiple, Grupo Financiero Scotiabank Inverlat, Scotia Inverlat Casa de Bolsa, S.A. de C.V., Grupo Financiero Scotiabank Inverlat, Scotia Inverlat Derivados S.A. de C.V. – all members of the Scotiabank group and authorized users of the Scotiabank mark. The Bank of Nova Scotia is incorporated in Canada with limited liability and is authorised and regulated by the Office of the Superintendent of Financial Institutions Canada. The Bank of Nova Scotia is authorized by the UK Prudential Regulation Authority and is subject to regulation by the UK Financial Conduct Authority and limited regulation by the UK Prudential Regulation Authority. Details about the extent of The Bank of Nova Scotia's regulation by the UK Prudential Regulation Authority are available from us on request. Scotiabank Europe plc is authorized by the UK Prudential Regulation Authority and regulated by the UK Financial Conduct Authority and the UK Prudential Regulation Authority.
Scotiabank Inverlat, S.A., Scotia Inverlat Casa de Bolsa, S.A. de C.V, Grupo Financiero Scotiabank Inverlat, and Scotia Inverlat Derivados, S.A. de C.V., are each authorized and regulated by the Mexican financial authorities.
Not all products and services are offered in all jurisdictions. Services described are available in jurisdictions where permitted by law.