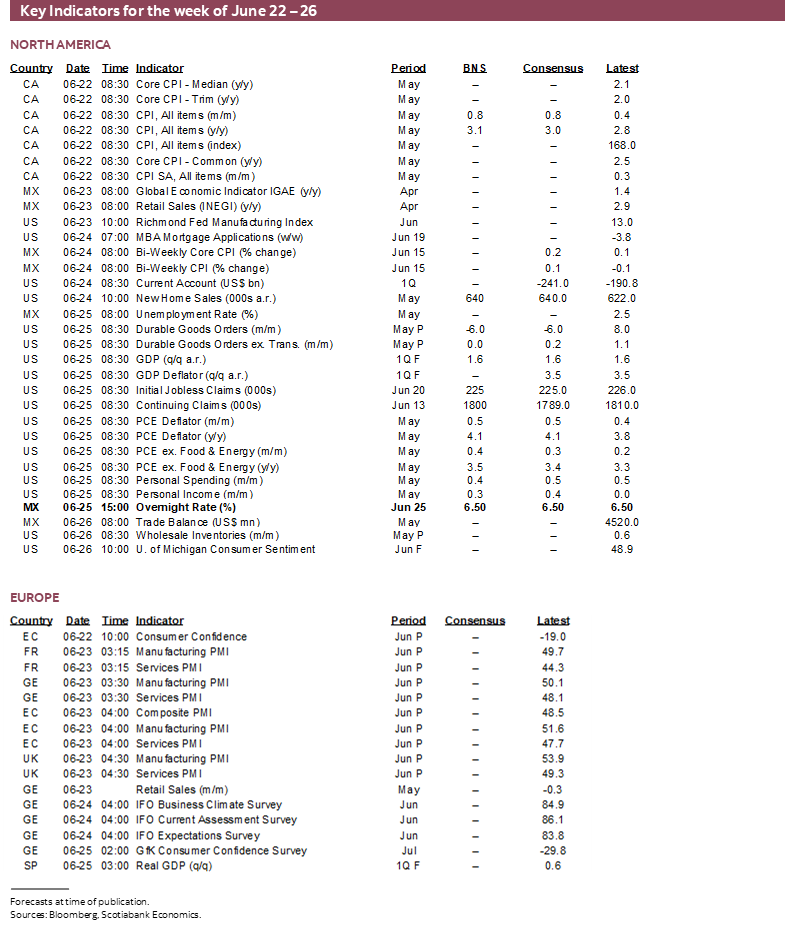
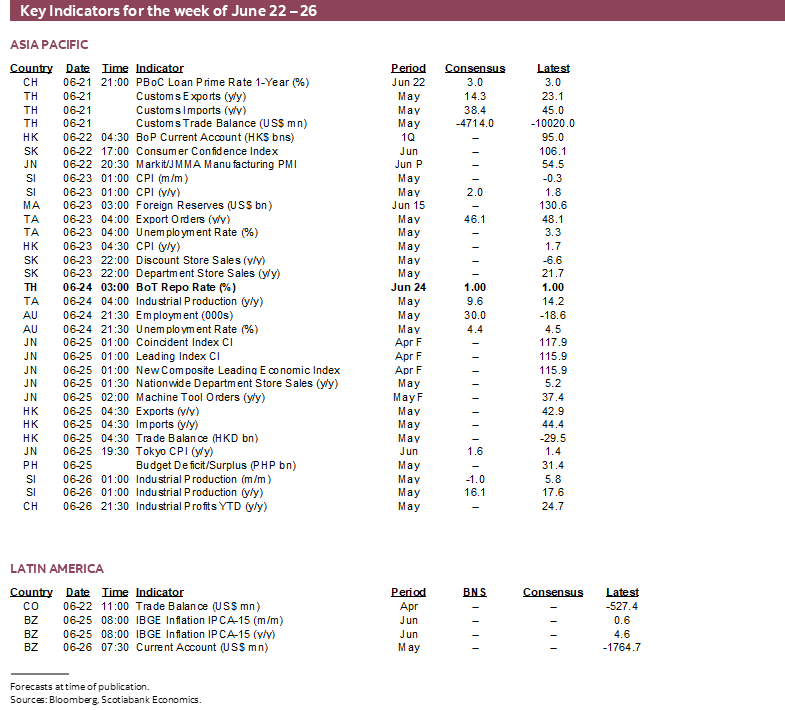
Next Week's Risk Dashboard
- The Treaty of Versailles sequel
- Why inflation risk remains very much alive
- Four major economies to refresh inflation figures
- Canadian CPI — Remember before the war?
- US PCE — Likely warm, but does it still matter?
- Australian CPI — why the RBA should remain guarded
- Japanese inflation — a temporary lull?
- Banxico — the beginning of the end
- Global PMIs likely to flag ongoing price pressures
- Australian jobs — aberration or a new trend?
- BoT expected to hold
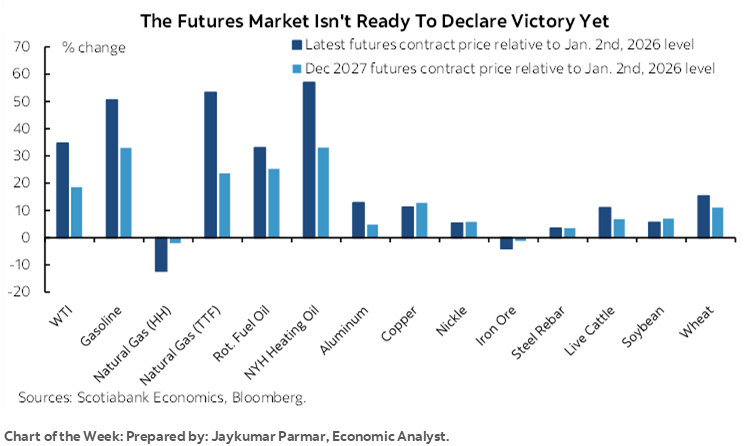
Chart of the Week
Perhaps the French had a twisted, cynical sense of humour when setting up Trump to sign the MOU with Iran at the Palace of Versailles this past week. Unlike June 1919, this MOU is a gift to an undefeated regime, but the future outcome could be similar.
Many came to view the Treaty of Versailles as overly punitive and extractive in setting up WWII, but among the first to say so was Keynes who sharply criticized it, labelling it a ‘Carthaginian peace’ after the brutally vengeful peace imposed by the Roman Republic on the defeated Carthaginians. Mr. Keynes was proven correct. Yet giving away as much as America just did to an evil regime with demonstrably malevolent intent domestically and toward the West and that remains largely intact is perhaps the second disastrous deal signed in Versailles in about the past century.
Iran has proven time and again that its pledge to conduct a nuclear research program in the open under transparent supervision and absent devastating goals is not to be trusted. The deal requires backing off Iran’s like-minded proxies. There are no details behind a proposed US$300 billion fund other than a pledge it will not directly include US taxpayer money to rebuild Iran. All frozen assets are to be unfrozen and returned to Iran. All surge US forces must retreat from the region. The blockade must end. All oil sanctions are to be waived which gets complicated not only for the US sanctions that Congress must weigh in on, but also at the UN which requires everyone to cave into Iran along with their respective financial systems. There are no apparent controls over how Iran may use oil revenues, unfrozen assets and the noted US$300B. Iran has only pledged not to charge fees with a hands-off approach to the Strait of Hormuz for 60 days after which it guides that it will work with Oman to impose a fee structure and control traffic. The US is not to interfere in Iran’s domestic issues, such as the next time the regime brutally oppresses its own people.
And for what? The regime remains in place. There remain ballistic missiles (unmentioned in the MOU) and drones aplenty. They hate the West and especially America and Israel even more. They will rebuild their armed forces with help from low places and the spoils of victory. There is no agreement on enriched uranium stockpiles other than a vague pledge to negotiate for 60 days or longer. Relations between countries in the Middle East are in tatters. The region is left more unstable than it was before the war. America’s reputation suffered a blow in what is a clear defeat and with truce offering favourable terms to Iran. What, pray tell, was the point of it all? Perhaps Trump’s signature on the MOU may be as unreliable as Iran’s pledges and that Trump’s pledge to back Israel if it attacked Iran gives it the green light.
But the stock market is up. Like the Dow was in the aftermath of the signing of the Treaty of Versailles. America is conducting its foreign diplomacy through the stock market as ultimate arbiter of future success.
Yet that’s only indirectly what the title to this week’s publication is alluding to. Thirty-six years of conflict around the Persian Gulf is not over; nor is inflation risk.
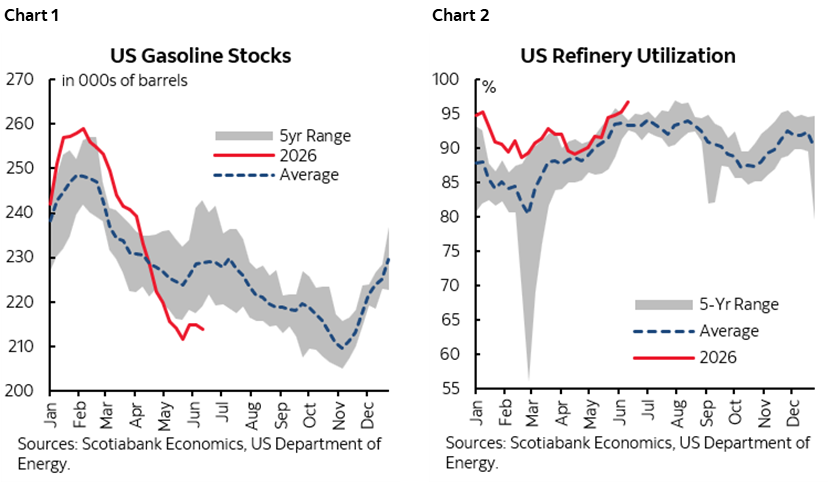
Four major economies will update inflation readings over the coming week. Along with providing previews, the purpose of what follows is to caution against thinking that off-peak energy and other commodity prices mean that inflation risk has gone away in any of Canada, the US, Japan and Australia. By extension, there are ongoing implications for central banks that should resist celebrating the decline in commodity prices that are nevertheless still high amid capacity constraints into a threatened El Niño summer (charts 1–2).
The two broad reasons for this are that a) there were pre-war reasons to be concerned about the inflation outlook and they have not gone away, and b) there are legitimate reasons to be sceptical toward the MOU between the US and Iran and how durable any easing of the conflict may prove to be. Most of this weekly will focus upon the broader inflation arguments.
Otherwise, this should be a tamer week with the rest of the focus upon a pair of central bank decisions (Banxico, BoT), Australian jobs, and a batch of global purchasing managers’ indices that will inform supply chain pressures on order books, prices and other plans.
CANADIAN CPI—REMEMBER BEFORE THE WAR?
Canada updates CPI inflation for May on Monday. Total CPI is estimated to rise by about ¾% m/m in seasonally unadjusted terms as per the convention and which could lift the y/y rate to over 3%. Yet that’s not what matters.
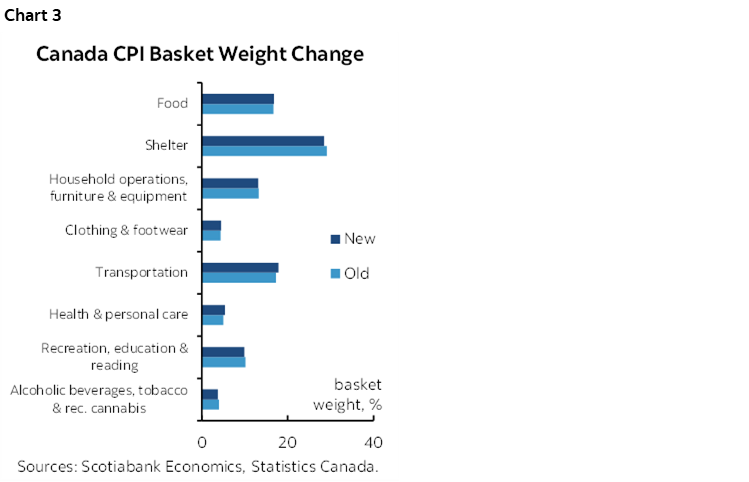
Before getting to what does, this is the time of year that gets a little more complicated with annual updates of the spending weights. Chart 3 shows how some of them evolved in the spending patterns derived from 2025 figures instead of 2024 (all the gory detail is here). Canadians spent more on transportation and less on shelter as two observations. When Statcan revises basket weights they only do it from the current month forward, sans revisions. Nevertheless, it’s unlikely that total CPI will be materially affected by these changes, but we can’t promise that for the underlying core measures like trimmed mean and weighted median CPI that use narrower portions of the basket and may be more sensitive.
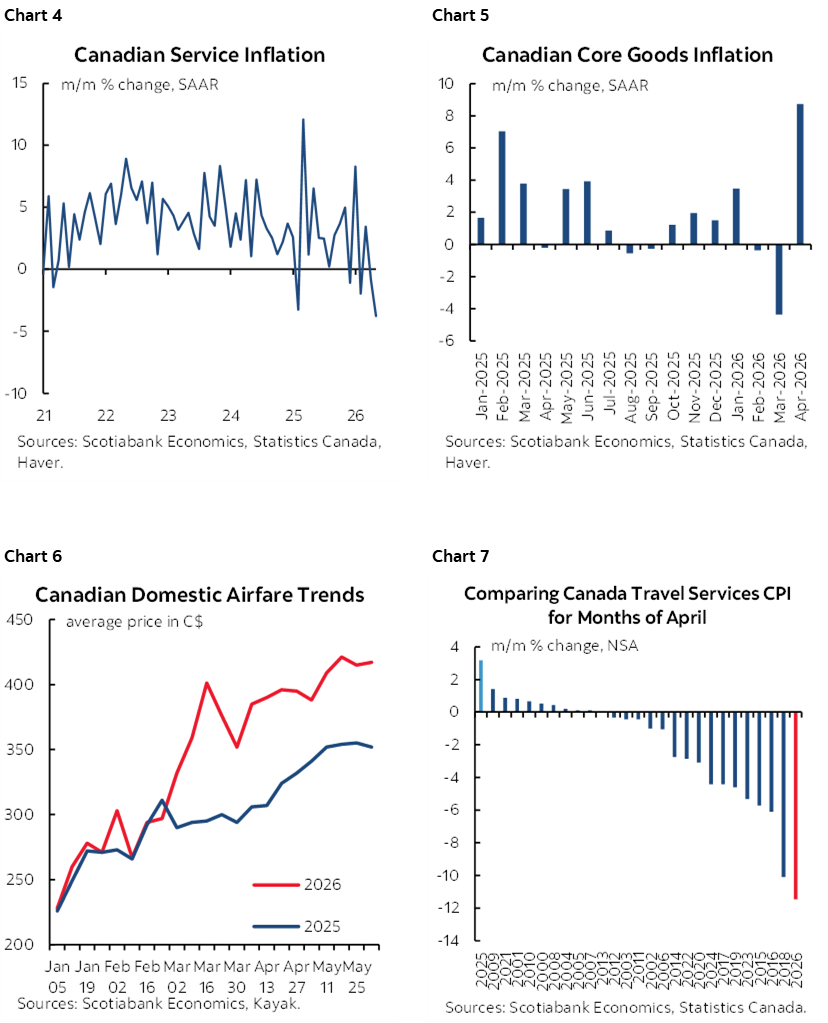
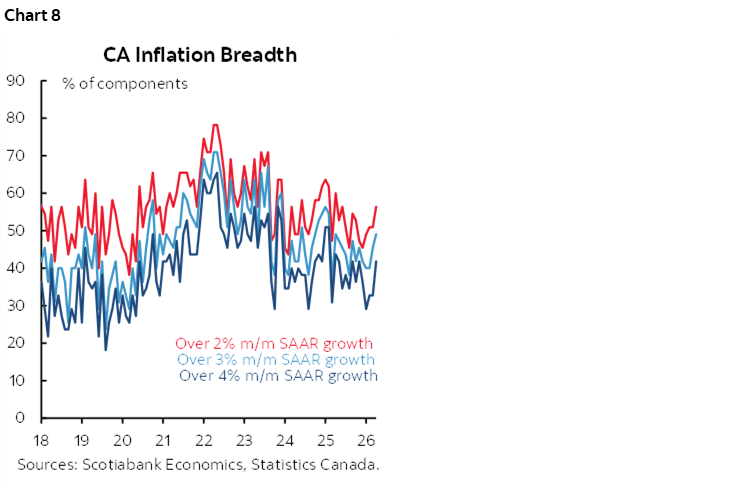
Total CPI should get a lift from seasonal influences, higher gas prices, and I’m estimating a bigger weighted contribution from a rebound in service prices that fell sharply the prior month (chart 4) than from an expected weighted deceleration of core goods prices ex-food and energy from the prior surge (chart 5). That’s because services carry more than double the basket weight of core goods. Categories like domestic airfare look to have rebounded as one example (chart 6). Travel services in CPI was a massive outlier the prior month compared to historical norms for months of April and so a rebound is likely (chart 7). Also keep an eye on breadth of price increases that has been rising (chart 8).
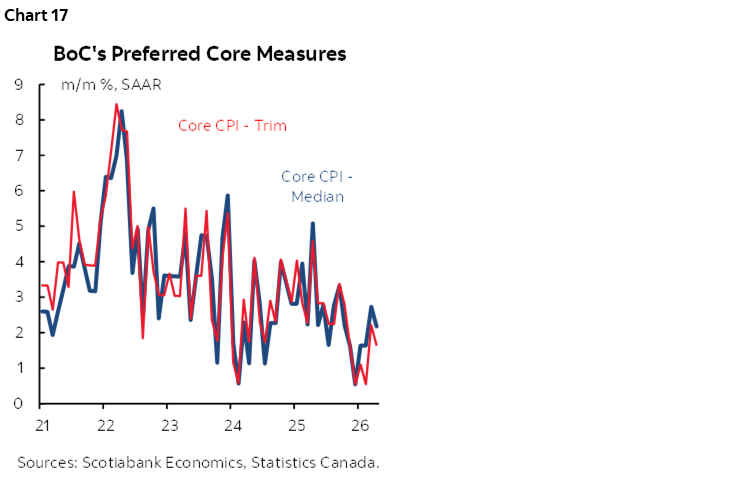
At issue is whether nascent evidence that Canada is emerging from a soft patch on underlying inflation builds upon itself. The measures that matter at the margin are the m/m trimmed mean and weighted median gauges. They were very soft from December of last year to February of this year but have since bounced back somewhat. Averaging their m/m annualized readings over the past two months equals 2.2% m/m SAAR. That’s a little above the BoC’s 2% medium-term target for total CPI inflation but not alarmingly so by any means. Nevertheless, the average of the two measures over the prior three months was just 1%, so it’s undeniable that we’ve been getting somewhat firmer readings of late. This pair of readings refutes data-dependent cut risk.
In a grander sense, does the commodity market reaction to the potentially subsiding conflict in the Middle East mean that inflation risk has gone away? Don’t count on it. As one starting observation, commodity prices have come down but continue to be well above where they were before the war which is likely to continue to pressure companies to pass on the effects.
As a reminder, we had hikes by the BoC by the end of 2026 in our forecast since last November—before the war—and driven by a variety of expectations including underlying inflationary pressures even before commodities began surging. Here is a partial list of reasons specifically related to inflation.
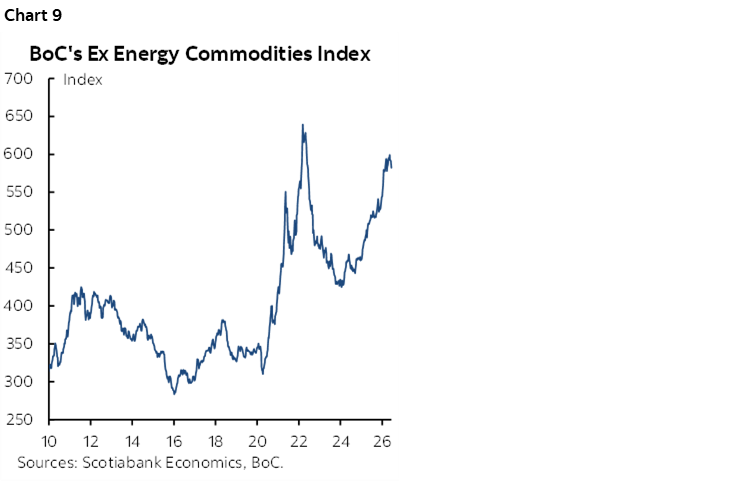
- There is solid reason for being sceptical toward a durable US-Iran deal. Internal US political blowback across key figures within the Republican Party is one reason among many. Also recall that it’s not just about energy prices (chart 9).
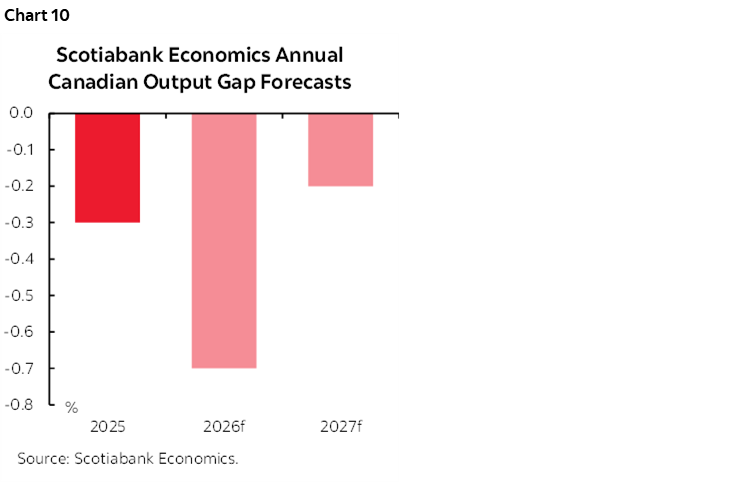
- We forecast the modest amount of economic slack to narrow as growth rebounds (chart 10);
- As this happens, multiple other inflation drivers pose substantial inflation risk beyond output gaps that a) are difficult to estimate because the supply side is fraught with measurement challenges and b) offer an incomplete picture of inflation risk. Models that relied heavily on assumptions surrounding the size and outlook for output gaps erred heavily coming out of the pandemic. The key here being the structural reshaping of the economy with the role of diversifying the supply chains from being dependent on the US.
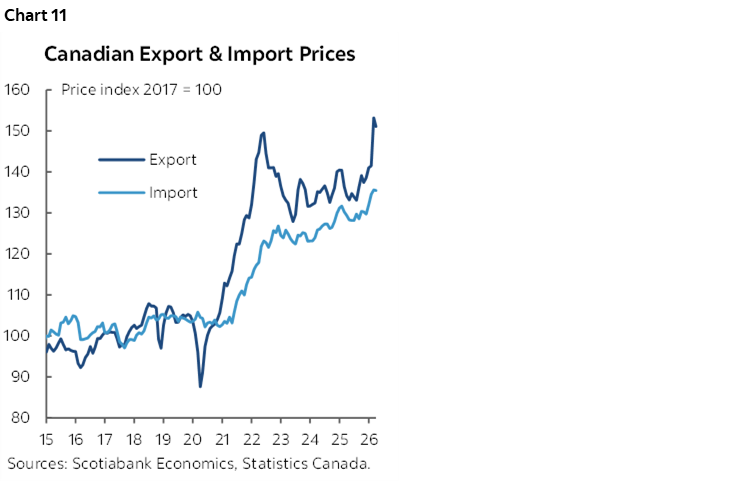
- Import prices have long been soaring which poses some trade pass through (chart 11);
- CAD depreciation (1.414 at time of publishing) risks fanning further import price pressures.
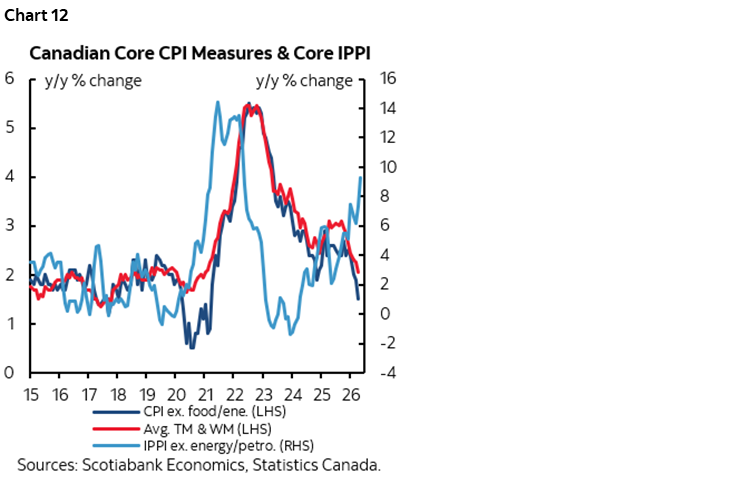
- Ditto for soaring core industrial prices (chart 12);
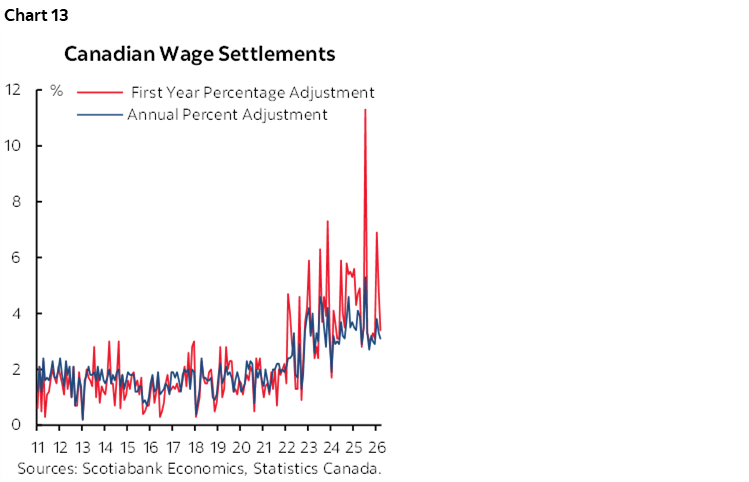
- Wages have been climbing and wage settlements point to years of ongoing wage gains for the one-third of the workforce that is unionized (chart 13);
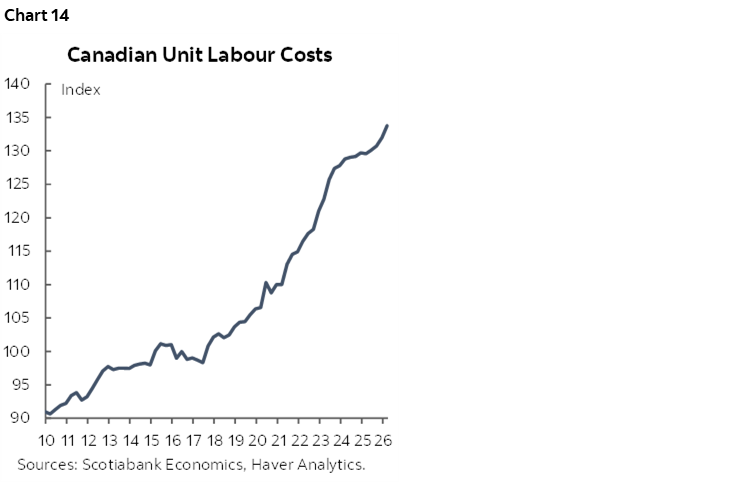
- Absent trend productivity gains to pay for wage growth the outcome is soaring unit labour costs that are basically productivity-adjusted employment costs (chart 14);
- AI is inflationary in the short-term and you may have to wait potentially years to find out if it is ultimately disinflationary. In the short run it has been feeding equity wealth effects that get partially spent, and an investment surge that may be adding more to demand for capital goods than benefits for the supply side to this point. AI has also driven costs for semiconductors, DRAMs, electronic components and in some cases commercial real estate much higher. Canada is indirectly exposed to all of this.
- Companies are managing inventory levels very differently today and I’m unsure of the balance between excess versus precautionary levels due to ongoing supply chain challenges. Regardless, the cost of storing and financing them will get passed onto a variety of stakeholders, some of whom are likely to be consumers.
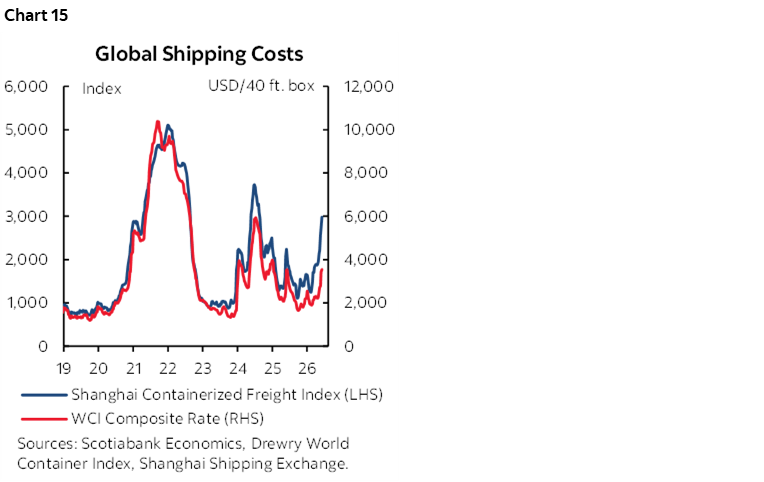
- Shipping costs are on the upswing again with various drivers from trade diversion to geopolitical effects (chart 15). A repeat of pass through pressures is likely.
- Trade diversion due to US protectionism means companies need to seek out new markets, create new products and secure new supplier arrangements. All of that involves management time and costs, some of which get passed on.
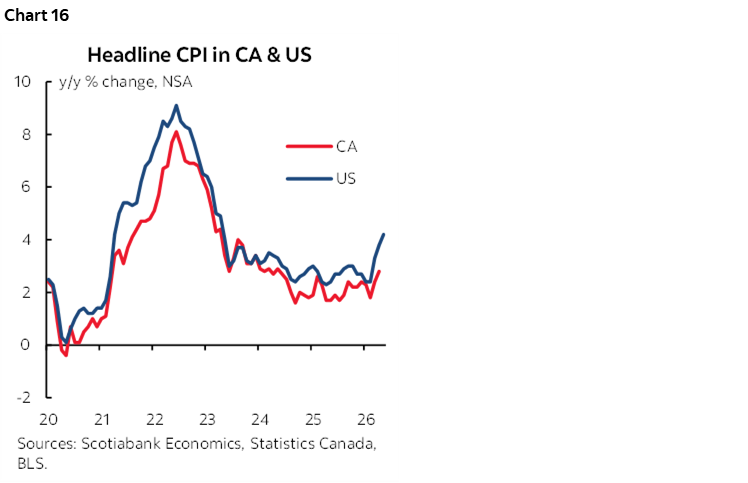
- and finally, for now, there is the point that Canadian and US inflation have marginal differences that tend to be short lived given the degree of integration in the two economies (chart 16). America’s inflation problem is tapping at Canada’s door.
All told, we’ll be watching for more evidence of a trend emergence from the prior soft patch in trimmed mean and weighted median CPI (chart 17).
US PCE—FALLING OUT OF FAVOUR?
We used to think it was the Federal Reserve’s favourite inflation gauge but now we’re less sure given the arrival of a new Chair who launched five taskforces this past week including one to look at different measures of inflation (recap here). The price deflator for total consumer spending—the PCE price gauge—will be updated on Thursday with the May reading.
I’ve estimated a rise of 0.5% m/m for headline PCE and 0.4% for core PCE. That would lift the year-over-year rates to 4.1% for total inflation and 3.5% excluding food and energy prices.
The starting point is that CPI was up 0.5% and core CPI increased by 0.2%. Then we take account of different weights on various prices—especially PCE’s much lower shelter weight—and an estimated 0.2 ppts contribution from the producer price components that flow through to PCE.
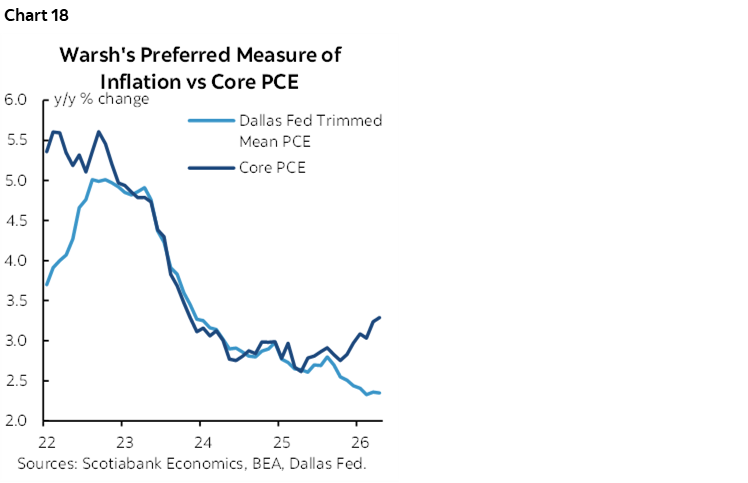
Later that day, the Dallas Federal Reserve will update its variation of the trimmed mean PCE measure. To date, it has trended below core PCE as a measure of underlying inflation (chart 18). Whether that persists is unclear, since core PCE has led trimmed mean PCE in the past. Nevertheless, to date, Chair Warsh could continue to suggest that today’s circumstances are more of a relative price shock in a narrow portion of the basket than generalized inflation.
AUSSIE INFLATION—IT’S NOT ALL ABOUT THE WAR’S EFFECTS
Australian CPI inflation for the month of May gets updated the day before we find out what happened to its job market last month. RBA Governor Bullock’s recent caution on the outlook for inflation is prudent given pre-war and wartime influences on price pressures.
There were notable underlying inflationary pressures before the war and concomitant commodity surge broke out. Trimmed mean CPI was persistently running at about 3¼% y/y for many months prior to the conflict. A reason for this was ongoing excess demand conditions in the Australian economy as observed through the output gap and capacity utilization (see chart 2.18 here). The labour market remains tight as observed in the Australian jobs preview later in this weekly. Australia also faces many of the cost-driven pressures on inflation observed earlier in this note.
The RBA’s May Statement on Monetary Policy projected that inflation would end the first half of 2026 higher at 4.8% y/y with trimmed mean CPI accelerating to 3.8%, up from 3.6% and 3.4% respectively six months prior indicating a) further recent upward pressure, but b) underlying momentum that pre-dated the conflict.
JAPANESE INFLATION—A TEMPORARY LULL?
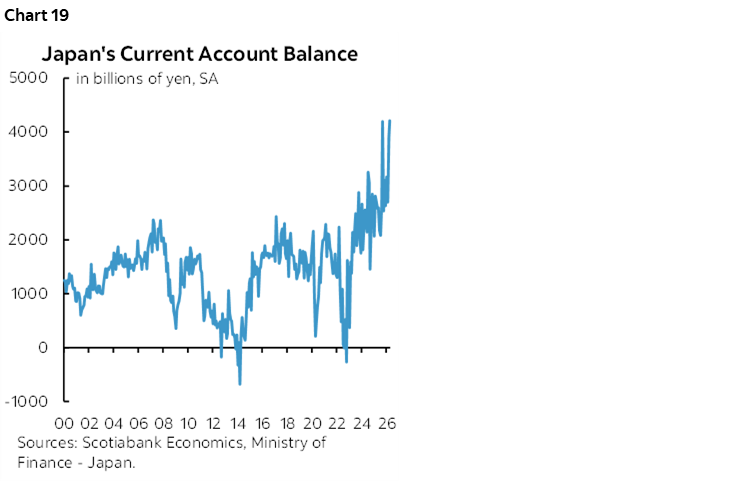
Now we downshift to a market where inflation is celebrated because it is a departure from years of deflationary pressures and then stagnant prices. When I was recently in Japan as part of a visit to our Asia-Pacific clients and staff I was further impressed by the enthusiasm toward how things are changing in Japan. Lending is incentivized by a reward to term extension in rates that was absent for many years. Instead of a one-way capital exporting machine the country now has greater use for its savings. Japan is reaping more from selling abroad than it is paying for imports plus the effects of net investment income that, when combined, are driving a record current account surplus (chart 19). The Nikkei’s over 75% cumulative gain since the US election that has outpaced the S&P gives PM Takaichi reason to smile and nod when in the company of the US President.
But can reflation continue? If so, for how much longer? Tokyo CPI (Thursday) for June is the freshest measure of Japanese inflation that arrives about a month before national CPI. It has been waning from a peak of 4.4% y/y in early 2023 to just 1.4% in May and could be similarly around 1½% y/y in June’s reading.
This deceleration could well be temporary for several reasons:
- the Japanese government temporarily extended utility subsidies through to September 2026 to cap electricity and gas prices, thus postponing potential pass through of higher market prices.
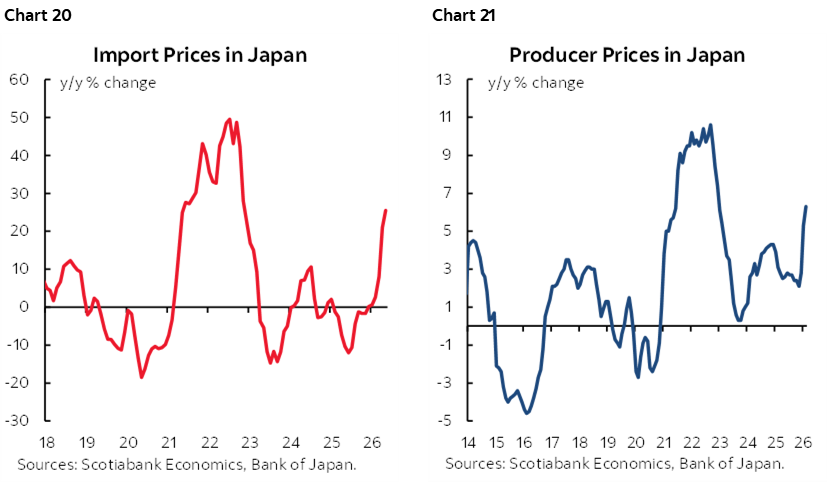
- Import and producer prices are rising sharply which is pressing Japan’s already strained fiscal position (charts 20, 21)
- the BoJ itself noted these effects with a caution: “On the price front, the year-on-year rate of increase in the consumer price index (CPI, all items less fresh food) has recently been at a level below 2 percent due to factors such as the effects of the government's measures to reduce the household burden of higher energy prices. However, the price pass-through stemming from the rise in crude oil prices has been progressing at a relatively fast pace in business-to-business transactions, which could spread to an increase in consumer prices across a wide range of items.”
- the lagging effects of yen depreciation are important given high import propensities. The yen has gone from about 103 to the dollar in late 2020 to 160 today and such effects can take an extended period to work through supply chains.
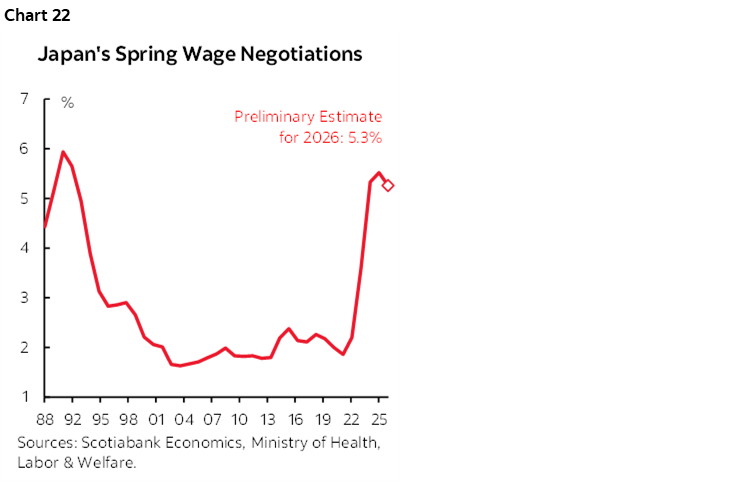
- wage gains continue to gain traction. Real (inflation-adjusted) wages have been rising to 1.9% y/y as trickle-down and spillover effects of Shunto spring wage gains flow through (chart 22).
- Japan is a heavy energy importer such that even with lower energy prices compared to the earlier peak there are pass-through pressures still coming.
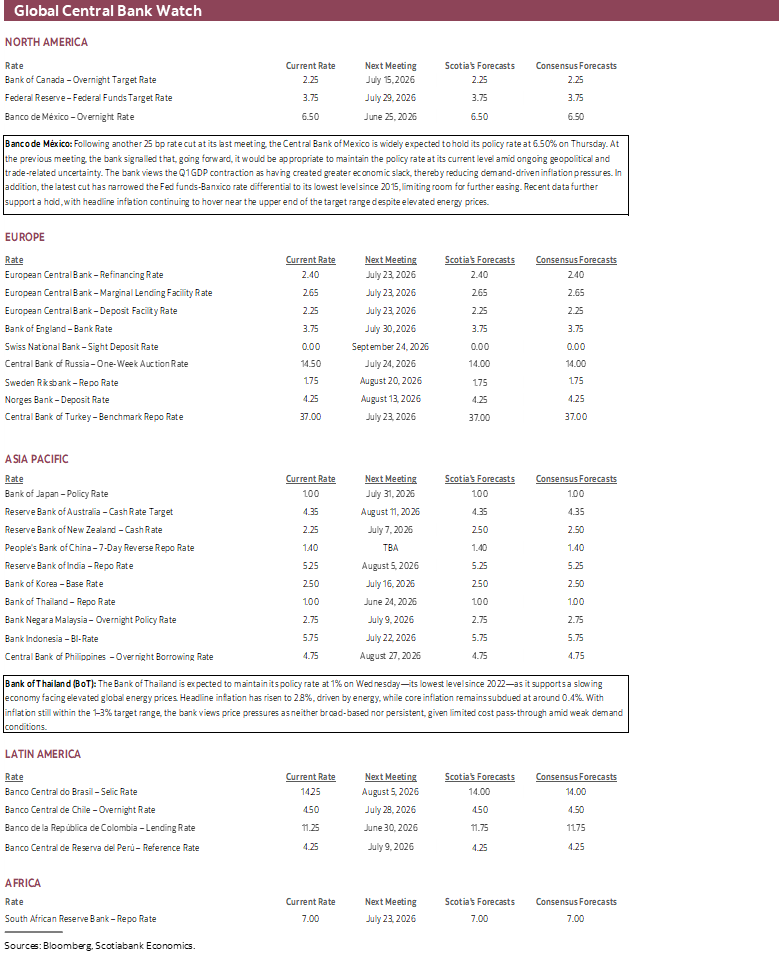
CENTRAL BANKS—THE CALM AFTER THE STORM
After this past week’s deluge, the coming week should be relatively calm in terms of global central bank communications and decisions. There may be the often customary post-FOMC statements from individual Committee members, but only two central banks are slated to deliver decisions.
Banxico—The Beginning of the End
Mexico’s central bank is widely expected to leave its overnight rate unchanged at 6.5% on Thursday. Consensus is unanimous and markets are priced for a hold.
Banxico’s May statement delivered a final cut by explicitly stating that it would “conclude the cycle that began in March 2024.” The vote to cut was split in a 3–2 outcome, signalling growing unease on the Governing Board.
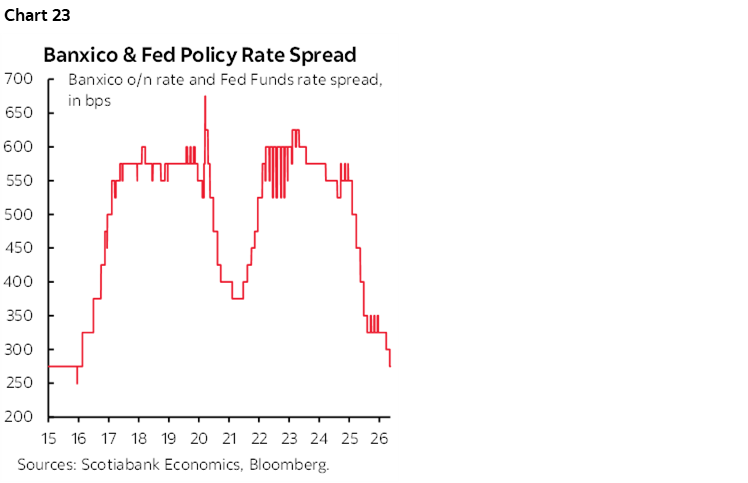
The policy rate differential to the Fed is at the widest since the pandemic which limits Banxico’s flexibility (chart 23). Peso volatility has entered a calmer period since late April. Inflation has been slightly ebbing to 3.9% y/y in May and core CPI inflation has slipped to 4.2% y/y but remains high relative to the central bank’s 3% +/- 1% inflation target range.
Banxico is now in a waiting game—waiting on domestic data, developments in energy markets and the consequences for inflation, trade negotiations and the direction in which Chair Warsh takes the Federal Reserve.
Bank of Thailand—Still Waiting
Thailand’s central bank is widely expected to hold its benchmark repurchase rate at 1% on Wednesday. Recent inflation landed below expectations at 2.8% y/y and has not been threatening the inflation target range of 1–3% with core CPI running under 1% y/y.
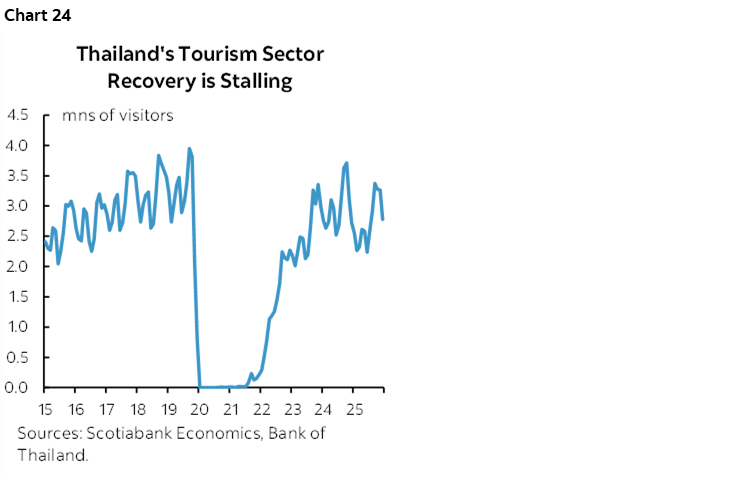
Thailand’s vital tourism industry has seen activity levels plateau over the past three years or so (chart 24). With that has been moderated GDP growth as the economy shrank in 2025Q3, rebounded in Q4 and then moderated again in Q1.
What also limits monetary policy flexibility is the currency. The baht—like other southeast Asian currencies—has depreciated this year on par with the Philippine peso but slightly less than other Asian crosses like the won, rupee and rupiah.
All things considered, the BoT is likely to be content with playing a continued waiting game.
GLOBAL MACRO—PMIS AND AUSTRALIA’S JOB MARKET
A batch of global purchasing managers’ indices will be the main feature on the rest of the weekly docket but with a side order of Australian jobs.
PMIs Likely to Show Ongoing Price Pressures
Australia and Japan kick off the round of June PMIs starting on Monday evening and tshen India, the Eurozone, UK and US follow into Tuesday morning. The UK, Australia, Germany and France were each signalling marginal contractions in the May readings while Japan and the US were indicating slow growth, and India remained the fastest of the bunch. Those prior readings signalled rapid price increases especially in Japan that registered the quickest price increases on record but also across Europe where the fastest price increases in 3–4 years were being recorded.
Of note is that manufacturing PMIs have generally held up better than service sector readings which is probably due to short-term order front-running and pre-emptive inventory stockpiling before expected pass through of higher prices (charts 25–26).
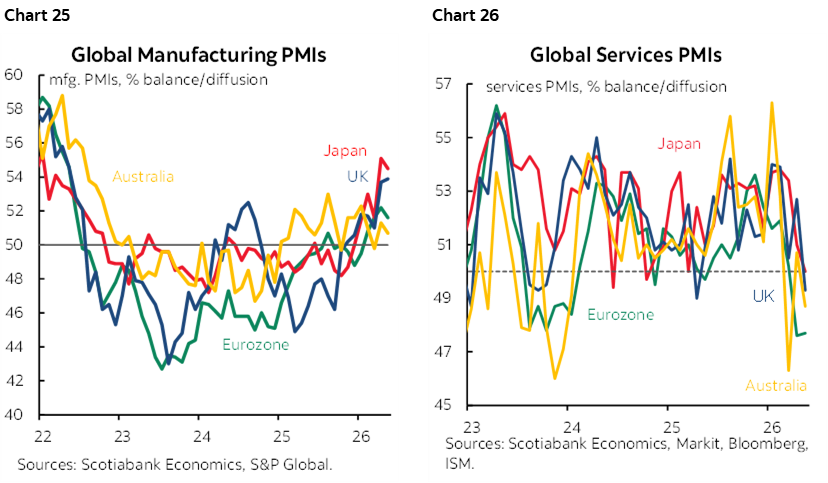
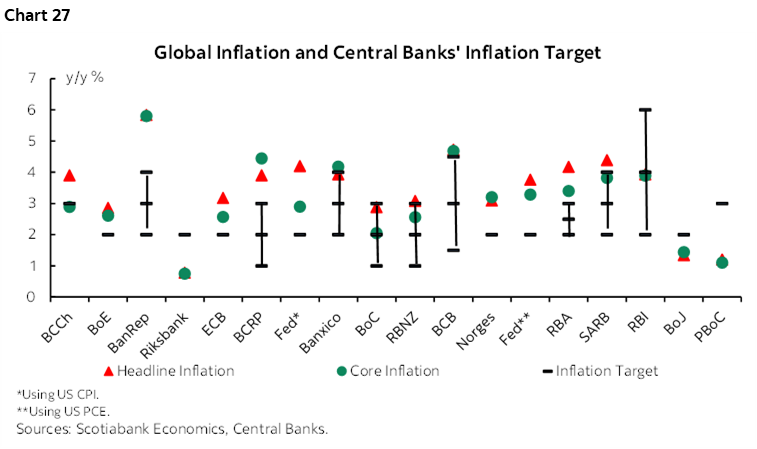
Chart 27 shows inflation readings by country relative to central bank targets.
Australia’s Job Market On Watch
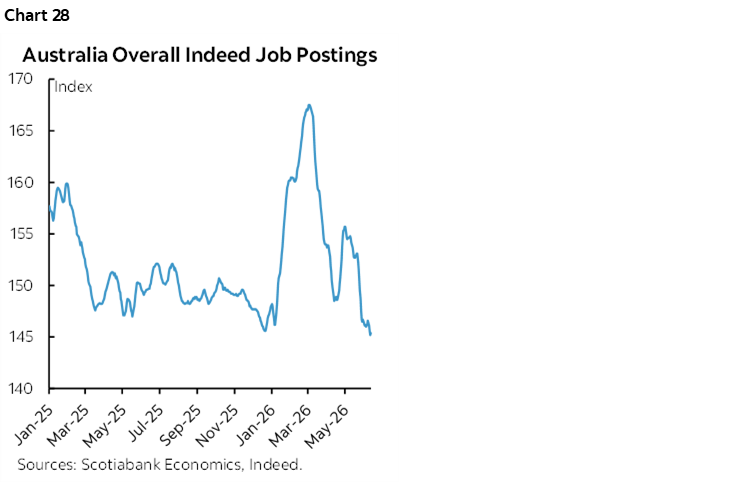
Australia’s job market stumbled in May which will keep RBA watchers on watch for further signs of softening. That’s especially true in the context of falling job postings (chart 28). If the job market is weakening, then it would add further caution into the RBA outlook following three 25bps rate hikes this year and this past week’s pause.
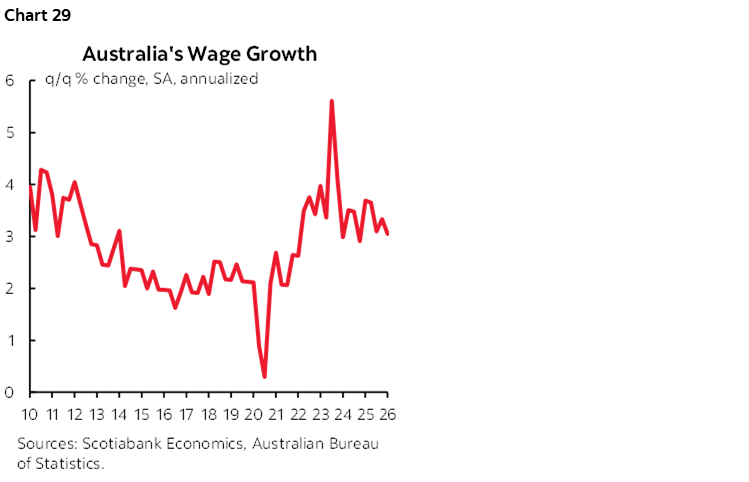
The 19k lost jobs that month were the first decline in five months and employment is still up by about 73k so far this year. The labour force participation rate—defined as those in the workforce who are either employed or looking for work as a share of the population—remains elevated at 66.7% but off the peak in early 2025. The unemployment rate has been creeping higher from a cycle low of 3.4% in October 2022 coming out of the pandemic to 4.5% now but that’s still probably at or slightly below the full employment equilibrium level of unemployment (NAIRU), thereby signalling a tight labour market which is probably why wage growth remains firm (chart 29).

DISCLAIMER
This report has been prepared by Scotiabank Economics as a resource for the clients of Scotiabank. Opinions, estimates and projections contained herein are our own as of the date hereof and are subject to change without notice. The information and opinions contained herein have been compiled or arrived at from sources believed reliable but no representation or warranty, express or implied, is made as to their accuracy or completeness. Neither Scotiabank nor any of its officers, directors, partners, employees or affiliates accepts any liability whatsoever for any direct or consequential loss arising from any use of this report or its contents.
These reports are provided to you for informational purposes only. This report is not, and is not constructed as, an offer to sell or solicitation of any offer to buy any financial instrument, nor shall this report be construed as an opinion as to whether you should enter into any swap or trading strategy involving a swap or any other transaction. The information contained in this report is not intended to be, and does not constitute, a recommendation of a swap or trading strategy involving a swap within the meaning of U.S. Commodity Futures Trading Commission Regulation 23.434 and Appendix A thereto. This material is not intended to be individually tailored to your needs or characteristics and should not be viewed as a “call to action” or suggestion that you enter into a swap or trading strategy involving a swap or any other transaction. Scotiabank may engage in transactions in a manner inconsistent with the views discussed this report and may have positions, or be in the process of acquiring or disposing of positions, referred to in this report.
Scotiabank, its affiliates and any of their respective officers, directors and employees may from time to time take positions in currencies, act as managers, co-managers or underwriters of a public offering or act as principals or agents, deal in, own or act as market makers or advisors, brokers or commercial and/or investment bankers in relation to securities or related derivatives. As a result of these actions, Scotiabank may receive remuneration. All Scotiabank products and services are subject to the terms of applicable agreements and local regulations. Officers, directors and employees of Scotiabank and its affiliates may serve as directors of corporations.
Any securities discussed in this report may not be suitable for all investors. Scotiabank recommends that investors independently evaluate any issuer and security discussed in this report, and consult with any advisors they deem necessary prior to making any investment.
This report and all information, opinions and conclusions contained in it are protected by copyright. This information may not be reproduced without the prior express written consent of Scotiabank.
™ Trademark of The Bank of Nova Scotia. Used under license, where applicable.
Scotiabank, together with “Global Banking and Markets”, is a marketing name for the global corporate and investment banking and capital markets businesses of The Bank of Nova Scotia and certain of its affiliates in the countries where they operate, including; Scotiabank Europe plc; Scotiabank (Ireland) Designated Activity Company; Scotiabank Inverlat S.A., Institución de Banca Múltiple, Grupo Financiero Scotiabank Inverlat, Scotia Inverlat Casa de Bolsa, S.A. de C.V., Grupo Financiero Scotiabank Inverlat, Scotia Inverlat Derivados S.A. de C.V. – all members of the Scotiabank group and authorized users of the Scotiabank mark. The Bank of Nova Scotia is incorporated in Canada with limited liability and is authorised and regulated by the Office of the Superintendent of Financial Institutions Canada. The Bank of Nova Scotia is authorized by the UK Prudential Regulation Authority and is subject to regulation by the UK Financial Conduct Authority and limited regulation by the UK Prudential Regulation Authority. Details about the extent of The Bank of Nova Scotia's regulation by the UK Prudential Regulation Authority are available from us on request. Scotiabank Europe plc is authorized by the UK Prudential Regulation Authority and regulated by the UK Financial Conduct Authority and the UK Prudential Regulation Authority.
Scotiabank Inverlat, S.A., Scotia Inverlat Casa de Bolsa, S.A. de C.V, Grupo Financiero Scotiabank Inverlat, and Scotia Inverlat Derivados, S.A. de C.V., are each authorized and regulated by the Mexican financial authorities.
Not all products and services are offered in all jurisdictions. Services described are available in jurisdictions where permitted by law.