Next Week's Risk Dashboard
• US stimulus bill
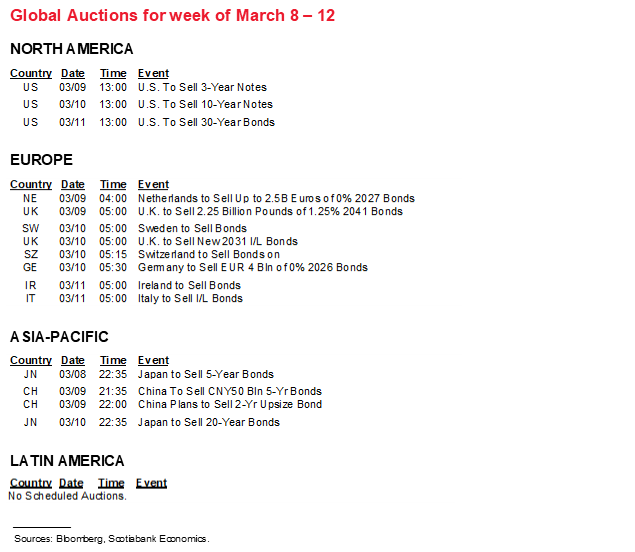
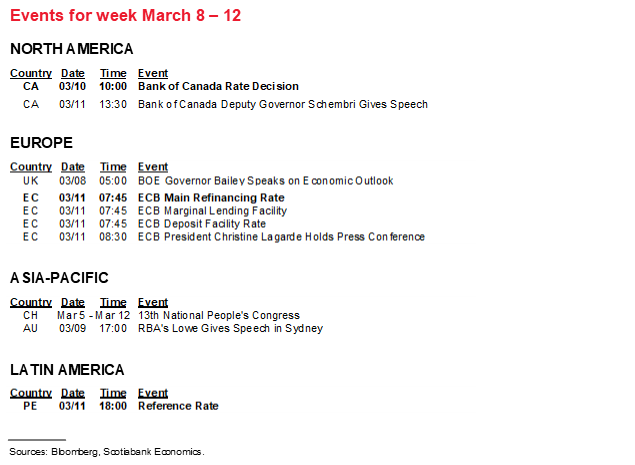
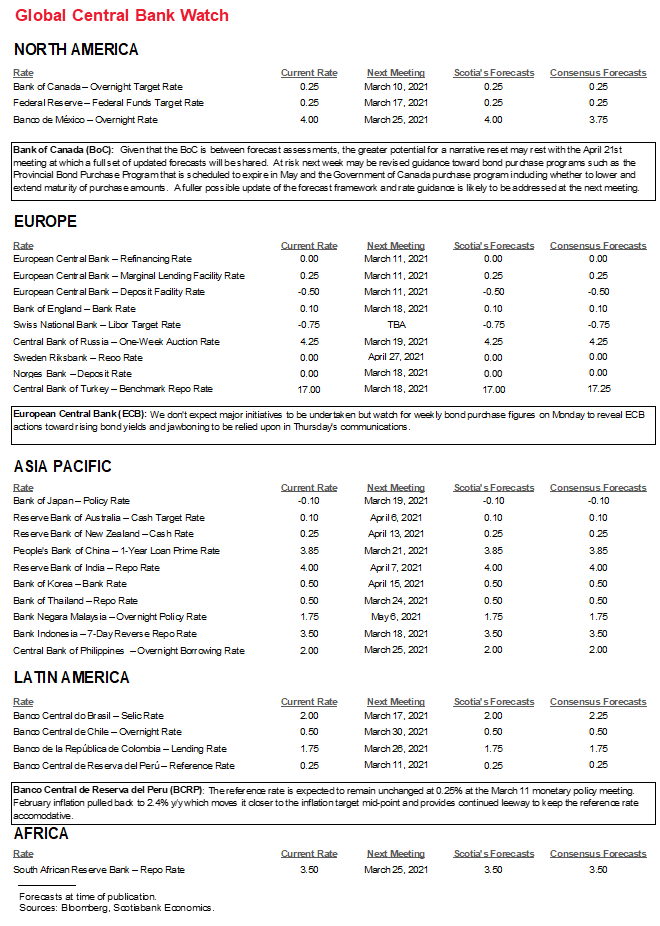
• CBs: ECB, BoC, Peru
• Jobs: Canada
• Inflation: US, China, Mexico, Norway, India…
• …Chile, Colombia, Brazil, Argentina
Chart of the Week
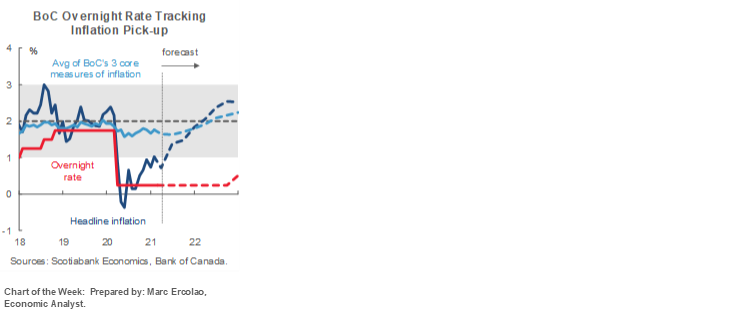
1. BANK OF CANADA—PLAYING CATCH-UP
The coming week’s Bank of Canada communications could simply be a warm-up act for the following month’s meeting at which a wholesale revision of its increasingly stale narrative may be in order. Wednesday will bring out the policy statement at 10amET. The task of explaining it the next day falls into the capable hands of Deputy Governor Schembri at 1:30pmET who will deliver a speech followed by a press conference. Schembri’s speech topic is not yet known, but it’s usually an overall progress report on the economy and how the central bank views developments. We will not hear from Governor Macklem until the April 21st decision, barring the addition of an unscheduled speaking engagement or media interview.
No major policy shifts are expected, but markets will be on watch for possible action or clues toward tactically adjusting bond purchase program parameters. The April 21st Bank of Canada communications will offer more of a chance at a fuller narrative reset as it will be accompanied by a full forecast update. Markets haven’t had a forecast update from the BoC since the January meeting and a lot has happened since then, so a thorough re-take is in order. Here is a partial list of developments since the old January forecasts:
- For one thing, growth has been utterly smashing BoC expectations. Q4 GDP growth of 9.6% doubled the BoC’s forecast. Further, it while the BoC had been forecasting a -2.5% contraction in Q1 GDP, growth is instead tracking between +3% (straight data to date) and +5% (Scotia’s ‘nowcast’) depending on the methodology employed. See here for more on how growth has been performing.
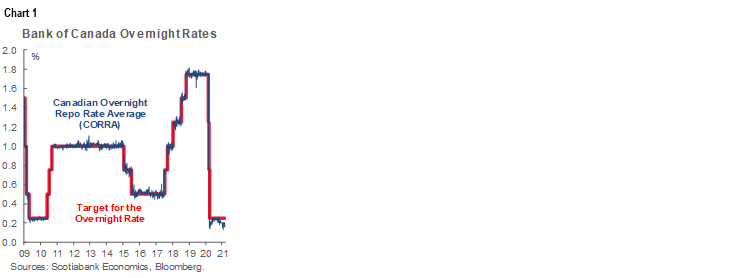
- The BoC’s control over short-term market rates has once again come under renewed pressure of late (chart 1). The Canadian Overnight Repo Rate Average (CORRA) has slipped further beneath the BoC’s 0.25% overnight rate target. A major driver of this is excess liquidity being pumped into the market by the Bank of Canada’s purchase programs relative to the decline in issuance.
- For another, vaccine progress may be finally kicking into higher gear (chart 2).

- Further, the US is on the verge of passing a US$1.9 trillion stimulus bill after implementing the US$900 billion December bill. Given the close integration of the Canadian and US economies, some of this US fiscal stimulus will leak into Canada through the trade accounts. January’s powerful export gains are already a step in this direction (chart 3). This could represent a very positive development in terms of the rotation of the sources of growth back toward export and investment contributions.

- Housing markets have moved deeper into record territory and underlying drivers show no signs of letting up into the typically key Spring housing market.
The BoC may defer bigger decisions on a potential narrative reset until it has greater clarity toward domestic fiscal policy. As yet, a Federal budget date is pending and we’re going into provincial budget season. Core issues such as plans to increase spending by C$70–100 billion over three years, when and where this spending will be distributed, and how it will be funded are material to the domestic economic landscape and could be incorporated in time for the April forecast update.
Still, in a bigger picture sense, I find that the BoC’s narrative is seriously lagging major developments while it overpromised on its stimulus commitments including a multi-year policy rate hold.
The massive stimulus that the BoC put in place almost a year ago was helpful and set in the context of a devastating shock sans vaccines and accompanied by the prevailing narrative that fiscal policy had routinely underwhelmed in scope and sustainability. When this monetary stimulus was implemented it seriously underestimated what the vast majority who kept their jobs would do with very low interest rates, as witnessed by very strong housing markets.
Strike out and amend those assumptions and now the massive monetary stimulus is looking a tad out of place in a forward-looking sense. Unwavering policy guidance toward uber-long holds and buying bonds to the moon hasn’t really shown itself to be aware of developments since November when vaccine trial results first began to arrive. My view is that the next steps toward curtailing monetary policy stimulus should arrive as soon as next week if not in the April MPR that revisits all forecasts. Ending the Provincial Bond Purchase Program on the May timeline is a strong possibility and provinces gave a free pass to do so with front-loaded issuance. Curtailing GoC bond purchases by at least C$1 billion per week—if not more—is another. If the purchase program ends before the output gap shuts, as Governor Macklem has been guiding, then that points toward its conclusion over the coming year. That, in turn, paves the way for getting away from an emergency policy rate setting as the emergency is rapidly passing.
The question at hand is whether the BoC is prepared to do some of this as soon as next week or prefers to line up its ducks for a complete update in April. Regardless, the broad narrative toward curve steepeners, shutting down the QE purchase program before year-end, and earlier Bank of Canada rate hikes starting next year remains consistent with views being expressed since November and fully articulated here.
2. ECB—RESERVING JUDGEMENT
The European Central Bank takes another swing at policy guidance with announcements on Thursday at 7:45amET followed by President Lagarde’s press conference at 8:30amET. No major changes in policy parameters are expected. Lockdown extensions and frustrating vaccine progress may push out economic momentum in revised forecasts. Still, it would be somewhat surprising if we didn’t at least hear more aggressive talk against rising bond yields accompanied by tactical bond buying adjustments. How such talk may go down faces the risk of President Lagarde’s checkered history when it comes to offering communications on market sensitive matters.
Monday’s publication of weekly bond purchases for this past week may be the first such clue. After the ECB slowed net bond purchases during the prior week when EGB yields came under upward pressure, Monday’s update may show a rise that would be in keeping with this past week’s price action that appeared to cap momentum in EGB yields while US Treasury yields climbed higher.
That major action beyond talk and perhaps tactically adjusting weekly purchase flows is unlikely is probably supported by two considerations. One is that European government bonds have relatively outperformed the selloff in US Treasuries (chart 4). That suggests that markets—perhaps aided by uncertainty over potential ECB actions—understand the need to differentiate prospects in the two regions which may assuage some concern about developments in global bond markets at the ECB. After all, the Eurozone faces less fiscal stimulus in the nearer term than the US, is making less progress on vaccines, and has a lengthy history of weaker inflation readings combined with structural growth challenges and frequent political dysfunction. EGBs should arguably outperform US Treasuries on a relative basis.

Second, the divided perspectives regarding the underlying cause of rising bond yields that have been offered by various ECB officials is itself an indication of reticence toward embracing any big yield-dampening initiatives. For example, consider ECB VP Luis de Guindos’ remarks:
“What we have to analyze is what’s the reason behind the increase in yields. If it’s a response that has nothing to do with the improvement of the outlook it’s much more worrisome and we have to react. We can’t discount the possibility that we will have a surprise in terms of growth in the second half of the year.”
Doves like ECB Executive Board Member Isabel Schnabel have recently sounded more convinced that the ECB should lean against bond markets:
“A rise in real long-term rates at the early stages of the recovery, even if reflecting improved growth prospects, may withdraw vital policy support too early and too abruptly given the still fragile state of the economy. Policy will then have to step up its level of support.”
Her remarks were cautiously supported by ECB dove and Bank of France Governor Villeroy, but less emphatically so when he said:
“In so much as this tightening is unwarranted, we can and must react against it, starting with an active flexibility of our PEPP purchases.”
Perhaps not surprisingly, Greece’s central bank governor advocates determined action now.
ECB hawks have countered such assertions. Governing Council member Klaas Knot recently remarked:
“The rise in rates reflects better growth prospects and better, higher inflation expectations. That in and of itself is a positive story.”
Bundesbank President Weidmann struck a similar chord:
“I would tend to argue that the size of the movements is not such that this is a particularly worrisome development. But we have to look at it and we are ready to adjust the volume of PEPP purchases. The PEPP has that flexibility embodied in it so we can react to unwarranted tightening of financing conditions.”
Whatever they do, I doubt the permanence of any near-term policy bias at least from a market standpoint. The ECB’s policy guidance around its Pandemic Emergency Purchase Program has been all over the map. It has a 44% utilization rate that has been accompanied by guidance that they might not use it all anyway before the €1.85 trillion program expires a year from now. Markets could look at tactical decisions to amplify nearer term bond purchase flows and shake off any initial market reaction if markets remain true to expectations for a better outlook while doubting ECB commitment toward making full use of the PEPP envelope.
3. US STIMULUS BILL—OF COURSE IT’S DOWN TO THE WIRE!
This is just the way Washington works. You’ve maybe heard that line many times in the past when it comes to understanding the repeated tendency to push agreements to the last possible second and sometimes a little beyond accompanied by copious amounts of mischievous theatrics. With some CARES Act jobless benefits set to expire by the end of next weekend, getting a massive stimulus bill through Congress and onto President Biden’s desk for his signature will remain a substantial undertaking over the upcoming week. Much of this is probably priced into markets including multiple definitions of Treasury curve steepeners, but there may yet be a final announcement effect.
While compromises are still being worked out, final costing estimates of the overall package of stimulus efforts from the Congressional Budget Office remain in limbo. It’s unclear whether the package will remain at US$1.9 trillion given the net effects of changes afoot, or modestly lower. Those changes are designed to ensure passage of the package over the coming week or so and the momentum appears to be positive but requires monitoring. As it moves toward a vote, some of the changes in the version being considered by the Senate would reduce the overall size of the stimulus package that has been passed by the House of Representatives, but some of the changes could offer offsetting increases.
If the package is approved—which is likely—then the US will have added two stimulus bills equalling almost US$3 trillion just three months apart from one another and totalling approximately 13% of nominal GDP. And they are not done—President Biden is already guiding expectations toward another stimulus package this year that is likely to be more focused upon infrastructure that, while needed if done right, would likely measure in the trillions in order to be impactful. We haven’t even gotten close to parameters for that next leg, but the point is that massive US fiscal stimulus is in the process of being disbursed and probably with more to come.
The impact upon the US consumer is going to be highly material over the first half of this year. Both the House and Senate versions of the bills as they stand now would provide US$1400 stimulus cheques, but the Senate version tightens eligibility by phasing out cheques to individual/married earners making over US$80,000/US$160,000 per year versus $100k/$200k in the House version. The CARES Act supplemental benefit that started at US$600/week per unemployed person that was scaled back to an extra US$300/week in the December 2020 bill until March 14th will now be extended until October and thus delay a cliff effect hopefully at least until the job market recovery is well underway.
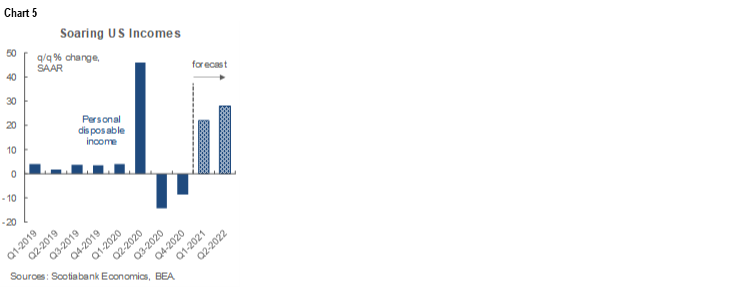
Chart 5 shows the projected effects on disposable income growth of extended supplemental unemployment benefits of $300/week until October alongside stimulus cheques that are likely to be disbursed next month. Annualized growth in personal disposable income over 20% is highly feasible in both the first and second quarters of this year. Once stimulus cheques drop out as an influence, disposable income growth will turn negative in Q3 over Q2—unless job creation is powerful enough to take over and is driven by vaccines and a return to something more ‘normal’ by way of behaviour. If that doesn’t happen, then the Biden Administration could conceivably prime the pump again given it can use budget reconciliation methods sans Republican support twice this year.
4. CANADIAN JOBS—EASIER RESTRICTIONS, OR MORE CHEATERS?
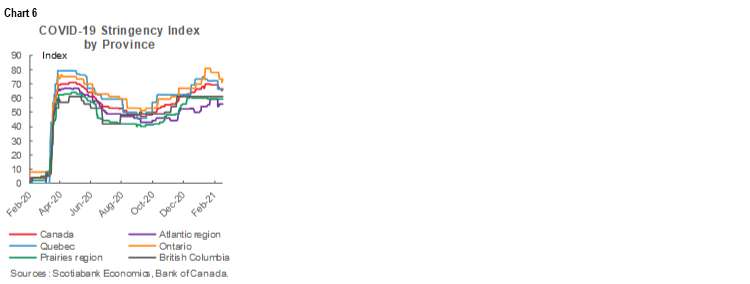
February’s jobs report arrives on Friday which as an economist I can tell you is an all too often lousy way to end a week. If the large drop in jobs during January (-213k) was primarily driven by tightened restrictions in Ontario and Quebec, then will their apparent relaxation into February provide a bit of a more favourable bounce? I think a +75k call is a reasonably conservative balance of risks on this one. Nevertheless, given the paucity of advance indicators to go by, a jobs estimate is always offered with caveats galore.
What slammed January’s report was the tightening of pandemic restrictions especially in Ontario and Quebec. Chart 6 indicates that there was a mild relaxation of restrictions into the February reference week for the Labour Force Survey that includes the 15th of each month. The Bank of Canada’s high-frequency tracking of restrictions by province makes a useful contribution beyond the Oxford measure’s nationwide but internationally comparable measures. The BoC’s gauges clearly show that restrictions remained tighter than the low point into last September and October but pulled off the prior month’s peaks.
Interestingly, measures of mobility across some of the nation’s biggest cities appeared to have picked up to a possibly greater extent than restrictions eased (charts 7–9). That doesn’t necessarily mean that more mobile individuals were more engaged in the labour market of late and it might be taken as a sign of ‘cheating’ the intent of the restrictions, but it could indicate improvement in economic activity outside of the sectors most affected by restrictions.

As a consequence, we seem to have stabilized in terms of growth in employment support programs at least as indicated by high-frequency search queries (chart 10).

Still, being down 265,000 jobs in two months dents what had been material progress. It’s still the case that Canada has recouped 2.13 million out of the nearly three million jobs lost in the early stages of the pandemic, but the roughly 850,000 folks who used to have jobs up to last February showcase the pain that persists on the road to what is expected to be a better job market as the year progresses. Small business hiring plans, for example, have become ever so slightly more constructive recently (chart 11). That was reinforced by the employment subcomponent of the Ivey PMI as more purchasing managers indicated they hired albeit the response are unweighted and don’t speak to magnitudes (chart 12).

5. INFLATION—US VERSUS CHINA OFFERS AN EXPERIMENT IN DIFFERING POLICY RESPONSES
Several major and regional economies update inflation readings that will offer a disparate array of risks facing the outlook for monetary policies.
US CPI inflation will be updated with February figures on Wednesday. Headline inflation is expected to take-off while core inflation ex-food and energy is likely to be relatively unchanged. Overall year-ago base effects will not be the driver of an expected pick-up in headline inflation from 1.4% y/y in January to a forecast 1.8%; in fact, base effects alone would drive inflation down to 1.1% y/y. Instead, there are three other drivers. One is that February is among the seasonal up-months for inflation partly as new Spring merchandise lines get rolled out. Secondly, we know that all-grades gasoline prices were up by almost 7% m/m in February which contributed to the year-over-year change in gasoline prices swinging from a drop of about 7 ½% y/y in January to a rise of about 3 ½% in February. As for core inflation, base effects alone would drive inflation lower again from 1.4% y/y in January to 0.9% y/y, but something around normal seasonality and potential supply chain pressures may drive core up by an unchanged 1.4% y/y.
China’s inflation rate gets updated on Tuesday night (eastern time). We are likely to continue to see headline and core inflation track in negative year-over-year territory in the February reading (chart 13). Why China is experiencing weak prices isn’t really much of a mystery. Here are possible explanations:

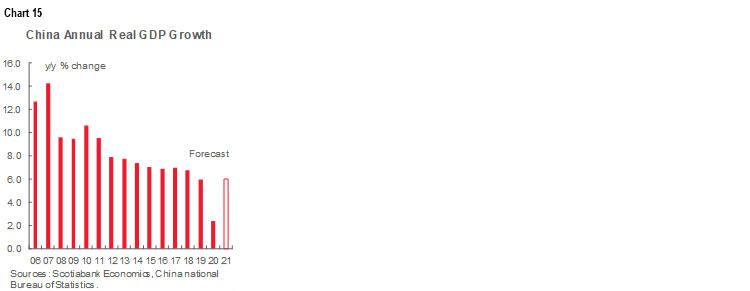
- Soft inflation is likely significantly due to the fact that GDP growth cratered last year to just 2.3% y/y because of the pandemic (chart 14). China needs growth rates of a few times that just to absorb new potential capacity and, as a result of soft growth, it wound up building slack capacity in the overall economy last year. The ‘above 6%’ growth target set for 2021 at the National People’s Congress that is underway is not especially ambitious either.

- Second, China has maintained among the tightest monetary policies anywhere as evidenced by a relatively high real policy rate (chart 15). Warnings about bubbles and excess exuberance have guided the reticence of monetary policy makers with respect to further easing.
- Third, perhaps because of past experiences, China has not offered the same massive fiscal response to the pandemic that in the past often resulted in a nasty baijiu hangover. Perhaps China has a lesson for the world in that over-stimulating economic conditions versus riding out at least a portion of the rough times can leave an awful mess behind. Not having to answer to voters probably helps a touch.
- Fourth, China’s earlier African Swine Flu motivated a culling of the pig stocks that drove pork prices sky-high. This contributed to an earlier burst of inflation on first round effects due to the fact that pork is a staple in the Chinese diet. Pork prices levelled off and it’s feasible that second round effects were mildly disinflationary as having to spend more on a staple meant less by way of wages left over for buying other things.
India’s inflation reading for February arrives at the end of the week. After plummeting from a peak of 7.6% y/y in October to 4.1% y/y in January, inflation is forecast to bounce back up toward almost 5% y/y but significantly due to year-ago base effects. Core inflation is likely to remain more stable at over 5% y/y. The Reserve Bank of India targets inflation at 4% +/- 2% and so inflation is well within the central bank’s target range.
Norway’s CPI inflation for February (Wednesday) could further drive expectations that Norges Bank will be among the first central banks heading for the exits. Headline inflation is forecast to rise toward 3% y/y. The central bank relies more upon CPI ex-tax changes and energy and it has been slipping from a peak of 3.7% y/y last summer to 2.7% more recently. Norges Bank targets inflation close to 2%. As oil prices rise sharply, Norges Bank’s next decisions on March 18th will be closely monitored for updated guidance to its “for some time” hold period that markets feel could transition toward hiking rates as soon as later this year.
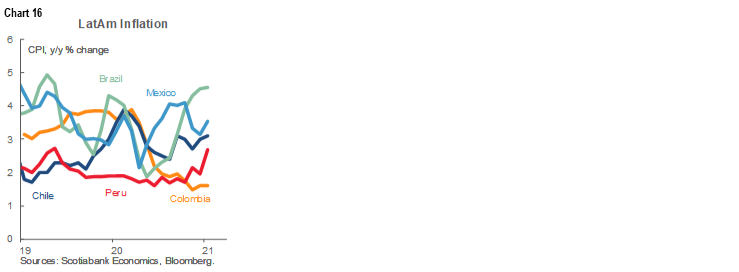
Five LatAm economies will also update inflation readings for February including Colombia into this weekend, Chile (Monday), Mexico (Tuesday), Brazil (Thursday) and Argentina (Thursday). All but Colombia have been witnessing either a bottoming in inflation readings or upward pressure (chart 16).
DISCLAIMER
This report has been prepared by Scotiabank Economics as a resource for the clients of Scotiabank. Opinions, estimates and projections contained herein are our own as of the date hereof and are subject to change without notice. The information and opinions contained herein have been compiled or arrived at from sources believed reliable but no representation or warranty, express or implied, is made as to their accuracy or completeness. Neither Scotiabank nor any of its officers, directors, partners, employees or affiliates accepts any liability whatsoever for any direct or consequential loss arising from any use of this report or its contents.
These reports are provided to you for informational purposes only. This report is not, and is not constructed as, an offer to sell or solicitation of any offer to buy any financial instrument, nor shall this report be construed as an opinion as to whether you should enter into any swap or trading strategy involving a swap or any other transaction. The information contained in this report is not intended to be, and does not constitute, a recommendation of a swap or trading strategy involving a swap within the meaning of U.S. Commodity Futures Trading Commission Regulation 23.434 and Appendix A thereto. This material is not intended to be individually tailored to your needs or characteristics and should not be viewed as a “call to action” or suggestion that you enter into a swap or trading strategy involving a swap or any other transaction. Scotiabank may engage in transactions in a manner inconsistent with the views discussed this report and may have positions, or be in the process of acquiring or disposing of positions, referred to in this report.
Scotiabank, its affiliates and any of their respective officers, directors and employees may from time to time take positions in currencies, act as managers, co-managers or underwriters of a public offering or act as principals or agents, deal in, own or act as market makers or advisors, brokers or commercial and/or investment bankers in relation to securities or related derivatives. As a result of these actions, Scotiabank may receive remuneration. All Scotiabank products and services are subject to the terms of applicable agreements and local regulations. Officers, directors and employees of Scotiabank and its affiliates may serve as directors of corporations.
Any securities discussed in this report may not be suitable for all investors. Scotiabank recommends that investors independently evaluate any issuer and security discussed in this report, and consult with any advisors they deem necessary prior to making any investment.
This report and all information, opinions and conclusions contained in it are protected by copyright. This information may not be reproduced without the prior express written consent of Scotiabank.
™ Trademark of The Bank of Nova Scotia. Used under license, where applicable.
Scotiabank, together with “Global Banking and Markets”, is a marketing name for the global corporate and investment banking and capital markets businesses of The Bank of Nova Scotia and certain of its affiliates in the countries where they operate, including; Scotiabank Europe plc; Scotiabank (Ireland) Designated Activity Company; Scotiabank Inverlat S.A., Institución de Banca Múltiple, Grupo Financiero Scotiabank Inverlat, Scotia Inverlat Casa de Bolsa, S.A. de C.V., Grupo Financiero Scotiabank Inverlat, Scotia Inverlat Derivados S.A. de C.V. – all members of the Scotiabank group and authorized users of the Scotiabank mark. The Bank of Nova Scotia is incorporated in Canada with limited liability and is authorised and regulated by the Office of the Superintendent of Financial Institutions Canada. The Bank of Nova Scotia is authorized by the UK Prudential Regulation Authority and is subject to regulation by the UK Financial Conduct Authority and limited regulation by the UK Prudential Regulation Authority. Details about the extent of The Bank of Nova Scotia's regulation by the UK Prudential Regulation Authority are available from us on request. Scotiabank Europe plc is authorized by the UK Prudential Regulation Authority and regulated by the UK Financial Conduct Authority and the UK Prudential Regulation Authority.
Scotiabank Inverlat, S.A., Scotia Inverlat Casa de Bolsa, S.A. de C.V, Grupo Financiero Scotiabank Inverlat, and Scotia Inverlat Derivados, S.A. de C.V., are each authorized and regulated by the Mexican financial authorities.
Not all products and services are offered in all jurisdictions. Services described are available in jurisdictions where permitted by law.