Next Week's Risk Dashboard
• Biden’s next fiscal plan
• US nonfarm payrolls
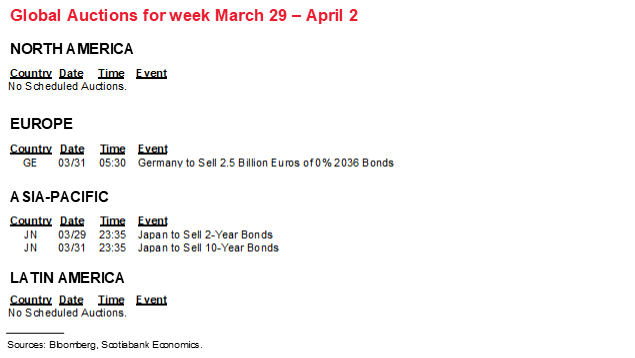
• GDP: Canada, Russia
• PMIs: US ISM, China, Canada
• CPI: EZ, Peru, SK, Indonesia, SZ
• CBs: Chile
Chart of the Week

THE REST OF BIDEN’S MASTER PLAN
US President Biden has promised to unveil plans for his next major fiscal package on Wednesday in Pittsburgh. This would come on the heels of two packages in December and March that totalled US$2.8 trillion or about 12% of nominal GDP. The next bill is likely to tip the scales in terms of broad ambitions but it faces a tough hill to climb.
It is expected to be measured in the trillions and will likely be larger than the just-passed US$1.9 trillion American Rescue Plan Act. Biden has indicated that the focus will be upon “the physical and technological infrastructure of this country” including clean energy investments, tax reforms and spending on childcare and universal pre-kindergarten programs.
The Biden Administration will no doubt start off by seeking bipartisan support but can use the budget reconciliation process a second and final time this year in order to pass legislation with just the 50+1 standard instead of a 60-vote threshold in the Senate. Reconciliation relies upon satisfying the Byrd rule named after former senator Robert Byrd and that requires proposals are germane to the budget (i.e., excluding things like minimum wage adjustments) and must be budget neutral over a 10-year period (or at least until some future government changes policies again…).
Reconciliation is probably going to have to be the route that the administration goes. Because of the neutrality requirement, this bill offers a chance at achieving much of what’s left on Biden’s election platform—including higher taxes on corporations and upper income earners. Republicans are sure to oppose the revenue measures that, among other things, would claw back the Tax Cuts and Jobs Act of 2018. Good luck getting 10 votes out of the GOP in order to avoid going the reconciliation route. Recall that the accompanying table and charts 2 and 3 on the next page summarize the revenue and expenditure aspects of Biden’s platform in order to demonstrate what is at stake.

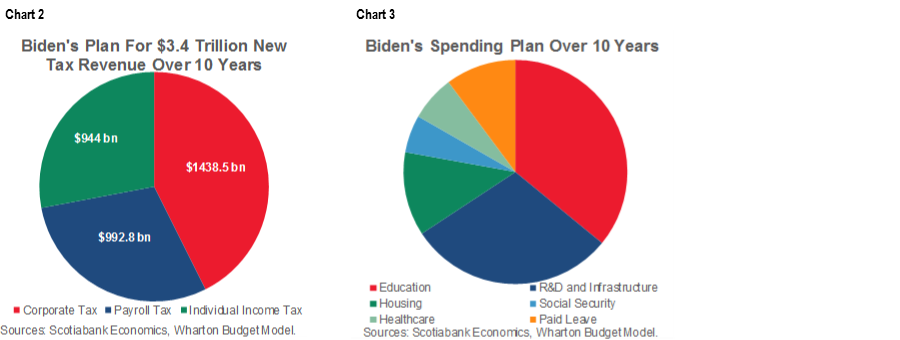
To investors, much of the attention is likely to be placed upon the tax plans which might contribute toward explaining why stocks have wavered somewhat of late. Broad infrastructure spending and childcare initiatives have merit, but how they impact general growth in the economy versus growth that investors can directly capitalize upon is more uncertain than the potential consequences of tax plans on profits and capital gains as the triple taxation threat rises in an economy that still rejects a nationwide consumption tax as an alternative. Given that the incumbent administration usually suffers a setback in Congressional mid-terms that are set for November 2022, the administration may have to tread carefully to avoid destabilizing markets into the campaigning and vote. Try planning and investing on behalf of a business within a polarized political system that keeps rocking the rules of the game!
The outlines of Biden’s plan will likely serve as the next major catalyst for potential forecast revisions to everything from growth, inflation, the Fed, Treasury yields and the dollar as we learn more about the amounts, composition, timing and how it may be funded—let alone the probability of pulling it off! For now—and merely to whet one’s appetite—chart 1 provides one crude way of benchmarking what every US$1 trillion spent on infrastructure over a ten year period of time would represent as a share of annual nominal GDP grown at a long-run average pace if proceeds are spent evenly each year. Obviously, we don’t know the amounts, composition or distribution over time and have not factored in multiplier effects absent details, so treat this as a casual reference at this point to show the effects scaled to the economy. One scenario, however, would see less than a ½% lift to GDP that does not repeat annual growth effects if the amounts spent the prior year are merely replaced in subsequent periods.

NONFARM PAYROLLS—A GOOD FRIDAY INDEED?
What could make Good Friday even better? Well, how about if after clocking a gain of about 380,000 jobs in February the US pumps out considerably more jobs in March? We could well see a rather strong reading. I’ve gone with +650k and wouldn’t be surprised to see something stronger. This is supported by the following points.
For one, March payrolls should regain the jobs that were reported as lost due to weather effects in February. Severe snowstorms were cited as a dampening effect on February payrolls by the Bureau of Labor Statistics since they hit into the reference period that is the pay period including the 12th of each month. One manifestation of this was the disruption to the power grid in Texas. The San Francisco Federal Reserve estimates that February’s payrolls were just over 100k lower than they would have been absent such harsher-than-seasonally-normal weather. This effect was among the largest negative weather effects in recent times (chart 4). Those lost jobs could reasonably be regained in March.

Secondly, COVID-19 restrictions eased further into the March reference period (chart 5). Restrictions have fallen back toward November levels. If they decline a bit further, then restrictions will have fully unwound second-wave effects back to where they stood in September and October of last year when the US was posting monthly job gains of about 700k.

Third, mobility is sharply recovering and at a quicker pace than restrictions have been easing. Chart 6 shows the Dallas Federal Reserve’s measure of mobility and engagement and how it presently stands at just about where it was before the economy shut down last March.

Fourth, weekly jobless claims fell between nonfarm reference periods. Less filing for unemployment benefits does not necessarily mean more hiring, but it’s a positive signal.
Finally, the 660,000 estimate may be subject to revision when we get further job readings next week and hence after sending out this publication. ADP payrolls land on Wednesday but in order to matter to nonfarm in a statistically significant way there needs to be a big surprise. The Conference Board’s consumer confidence reading including the measure for availability of jobs arrives on Tuesday. The employment subindex in the ISM-manufacturing report arrives on Thursday but the ISM-services employment gauge does not arrive until the following week.
CANADA’S ECONOMY—SURGE RESILIENCE
Canada’s economy is proving to be resilient to the COVID-19 virus (chart 7). We’ll get a further glimpse at the evidence with a couple of GDP growth estimates on Wednesday. The estimates will further inform growth tracking for the first quarter of 2021.

Both the January reading and the ‘flash’ estimate for February are likely to exhibit solid growth. Back on March 2nd, Statistics Canada had guided that its preliminary estimate for January GDP was up 0.5% m/m. Since then there have been several releases that either represented new information or that have been more positive than expected. As a consequence, I’ve gone a little higher at +0.8% m/m. Upside surprises to the flash readings are not uncommon, though it’s possible there is other information that will inform the final reading beyond what can be observed. Here is what we learned since the agency’s initial estimate:
The jobs report was released ten days later and posted a 0.9% m/m rise in hours worked that should benefit GDP. GDP is an identity defined as hours worked times labour productivity.
Manufacturing sales were up 3.5% m/m that month compared to the agency’s ‘flash’ estimate of 2.5% and with volumes up 1.1% m/m.
Retail sales during the peak of the lockdown fell by 1.1% m/m—all in volumes—which was much less than the agency’s flash -3.3% m/m estimate.
- Wholesale trade, however, was up 4% m/m entirely on volumes but that was softer than the advance guidance of 5.3%.
The economy probably kept humming along at a modest growth pace in February, based on more limited information than is available for the prior month. Here is what we know:
hours worked were up by another 1.4% in February;
retail sales soared by +4% m/m in the ‘flash’ estimate;
the manufacturing sales flash fell by -1% m/m mostly due to transportation equipment (autos);
the wholesale sales flash fell by 0.4% m/m;
housing starts fell by -13.5% m/m;
existing home sales were up by 6.6% m/m which should benefit ancillary services.
What does it all mean for Q1? Something a lot better than the Bank of Canada had figured when it forecast a contraction of 2 ½% for Q1 GDP in the January Monetary Policy Report. Canada could be at ten months of uninterrupted growth from May through February as not even the second wave of cases bumped it off course. Even before considering Q1 data, the quarter had 1.3% annualized growth baked in due to momentum into the end of last year as it transitioned to Q1. Our forecast for the full first quarter is for growth of about 4½%. If January faces upside, February builds upon it and then factors like easing restrictions and more pleasant than usual weather for part of March build upon the momentum, then we could well be looking at even faster growth depending upon how other GDP drivers like inventories and imports evolve.
PMIs—WILL ISM HIT A FOUR-DECADE HIGH?
Another round of purchasing managers’ indices will seek to further inform growth tracking in some of the world’s largest economies.
The US ISM-manufacturing gets released on Thursday and could well rise to its highest reading since December 1983 for a nearly four-decade high that builds upon recent momentum (chart 8). The drivers include gains in regional surveys like the Philly Fed measure that almost doubled in March to its highest reading since 1973, the Empire gauge that jumped by 5 points to its highest reading since November 2018, plus smaller gains in the Richmond and Kansas City measures. Further, since the regional surveys tend to underrepresent the transportation sector, an expected rebound in auto sales on Thursday could also be reflected in a stronger ISM print.

China will also update the state’s versions of its PMIs on Tuesday night (always eastern time) followed by the private manufacturing PMI the next night. The private services and composite PMIs will follow the next week. Don’t look for multi-decade highs out of China—by contrast to the US—as we should instead see moderate growth.
Canada lacks an internationally comparable set of PMIs, but one similar reading arrives on Thursday from the Markit folks for the manufacturing sector. Moderate growth is being registered by this gauge, but the trend has been moving largely sideways since late last summer. Canada does not have a services or composite PMI for the private sector. The Ivey PMI covers all public and private sectors of the economy and had registered a strong prior gain in February.
HONOURABLE MENTIONS
Most of the week’s attention will be placed upon the above considerations, but there will be some diamonds in the rough for us economics junkies.
March inflation readings will arrive for the Eurozone (Wednesday) on the same day as readings for France and Italy and one day following Germany and Spain. Eurozone core inflation is expected to hold steady at around 1.1% y/y but higher fuel prices compared to last March when the pandemic was striking will likely pop headline inflation higher. Switzerland, Peru, South Korea and Indonesia also report March inflation readings—all on Thursday.
Is Japan’s economy continuing to gradually mend? We’ll get a sense of this when the Q1 Tankan reports arrive early in the week that may inform expectations for Q1 GDP after two consecutive gains. The gradual improvements in the manufacturing sector into year-end are shown in chart 9.

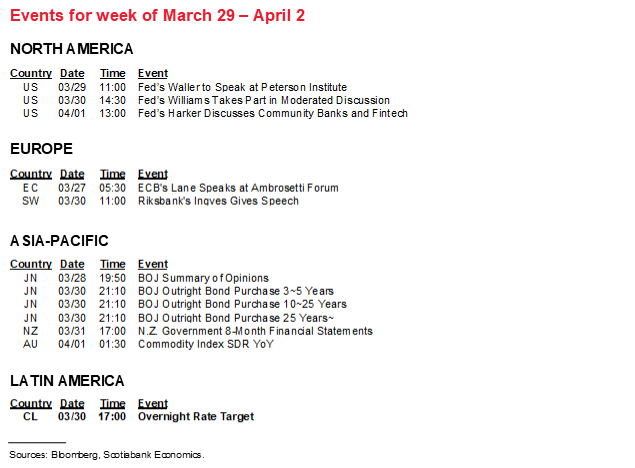
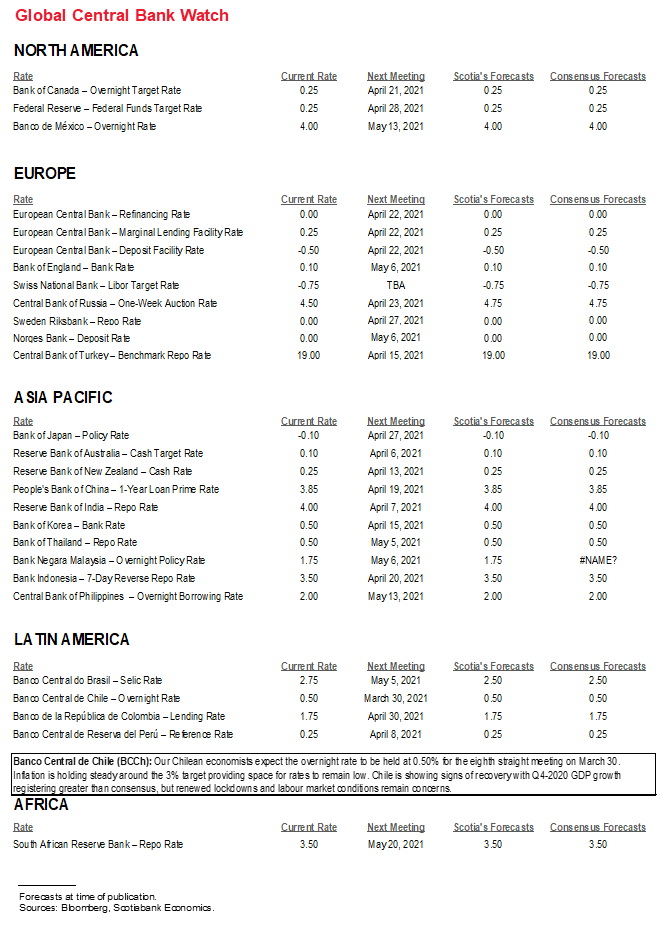
Only one central bank will offer a policy decision. Chile’s central bank is universally expected to stay on hold at an overnight rate of 0.5% on Tuesday. Inflation is roughly within the target zone but the decision to put Santiago back into lockdown due to rising COVID-19 cases will be an added near-term risk to the economy. The policy rate is expected to stay on hold over the duration of the year before potentially rising next year (chart 10).

Other US macro releases will struggle to get much attention behind nonfarm and ISM-manufacturing. Still, pending home sales in February are expected to decline again (Wednesday) partly given supply shortages. Vehicle sales are expected to rebound in Thursday’s reading for March as improved weather following February’s snowstorms may provide at least temporary relief from production challenges due in part to global semiconductor chip shortages. Construction spending in February (Thursday) is likely to follow housing starts lower and again in no small part due to harsher than usual weather.
European consumer readings will round out the schedule with Spanish (Tuesday), French (Wednesday) and German (Thursday) figures for consumer spending.
DISCLAIMER
This report has been prepared by Scotiabank Economics as a resource for the clients of Scotiabank. Opinions, estimates and projections contained herein are our own as of the date hereof and are subject to change without notice. The information and opinions contained herein have been compiled or arrived at from sources believed reliable but no representation or warranty, express or implied, is made as to their accuracy or completeness. Neither Scotiabank nor any of its officers, directors, partners, employees or affiliates accepts any liability whatsoever for any direct or consequential loss arising from any use of this report or its contents.
These reports are provided to you for informational purposes only. This report is not, and is not constructed as, an offer to sell or solicitation of any offer to buy any financial instrument, nor shall this report be construed as an opinion as to whether you should enter into any swap or trading strategy involving a swap or any other transaction. The information contained in this report is not intended to be, and does not constitute, a recommendation of a swap or trading strategy involving a swap within the meaning of U.S. Commodity Futures Trading Commission Regulation 23.434 and Appendix A thereto. This material is not intended to be individually tailored to your needs or characteristics and should not be viewed as a “call to action” or suggestion that you enter into a swap or trading strategy involving a swap or any other transaction. Scotiabank may engage in transactions in a manner inconsistent with the views discussed this report and may have positions, or be in the process of acquiring or disposing of positions, referred to in this report.
Scotiabank, its affiliates and any of their respective officers, directors and employees may from time to time take positions in currencies, act as managers, co-managers or underwriters of a public offering or act as principals or agents, deal in, own or act as market makers or advisors, brokers or commercial and/or investment bankers in relation to securities or related derivatives. As a result of these actions, Scotiabank may receive remuneration. All Scotiabank products and services are subject to the terms of applicable agreements and local regulations. Officers, directors and employees of Scotiabank and its affiliates may serve as directors of corporations.
Any securities discussed in this report may not be suitable for all investors. Scotiabank recommends that investors independently evaluate any issuer and security discussed in this report, and consult with any advisors they deem necessary prior to making any investment.
This report and all information, opinions and conclusions contained in it are protected by copyright. This information may not be reproduced without the prior express written consent of Scotiabank.
™ Trademark of The Bank of Nova Scotia. Used under license, where applicable.
Scotiabank, together with “Global Banking and Markets”, is a marketing name for the global corporate and investment banking and capital markets businesses of The Bank of Nova Scotia and certain of its affiliates in the countries where they operate, including; Scotiabank Europe plc; Scotiabank (Ireland) Designated Activity Company; Scotiabank Inverlat S.A., Institución de Banca Múltiple, Grupo Financiero Scotiabank Inverlat, Scotia Inverlat Casa de Bolsa, S.A. de C.V., Grupo Financiero Scotiabank Inverlat, Scotia Inverlat Derivados S.A. de C.V. – all members of the Scotiabank group and authorized users of the Scotiabank mark. The Bank of Nova Scotia is incorporated in Canada with limited liability and is authorised and regulated by the Office of the Superintendent of Financial Institutions Canada. The Bank of Nova Scotia is authorized by the UK Prudential Regulation Authority and is subject to regulation by the UK Financial Conduct Authority and limited regulation by the UK Prudential Regulation Authority. Details about the extent of The Bank of Nova Scotia's regulation by the UK Prudential Regulation Authority are available from us on request. Scotiabank Europe plc is authorized by the UK Prudential Regulation Authority and regulated by the UK Financial Conduct Authority and the UK Prudential Regulation Authority.
Scotiabank Inverlat, S.A., Scotia Inverlat Casa de Bolsa, S.A. de C.V, Grupo Financiero Scotiabank Inverlat, and Scotia Inverlat Derivados, S.A. de C.V., are each authorized and regulated by the Mexican financial authorities.
Not all products and services are offered in all jurisdictions. Services described are available in jurisdictions where permitted by law.