Next Week's Risk Dashboard
- The central bank herd is stirring
- Canada’s economy on the rebound?
- Key supports to Canadian growth and inflation risk…
- …that restrain the BoC from easing
- US core PCE: another warm one?
- Eurozone inflation will further inform a still-hot trend
- The Riksbank’s avoidance of ‘sadomonetarism’
- SARB to remain restrictive
- The BoC on Canada’s productivity woes
- Key Fed-speak on tap
- Is Australian core inflation still falling?
- Is Japan’s core inflation still sliding?
- Good Friday holiday
Chart of the Week
The herd is stirring. They’re stomping their hooves, sniffing around, snorting, and looking to spark something. I’m speaking of global central banks of course. They’re human after all, and humans are rather notoriously like crowd-bound lemmings. When one starts running, get out of the way. You first. Then another, and another, until they’re all on their way down to, well, something. There’s strength in numbers if they’re wrong together but loneliness if they’re wrong in isolation. Whether that’s a big safety net down below or something let’s just say worse remains to be seen.
We’ve had cuts in place for some time now across a suite of LatAm central banks and Banxico threw in the towel and joined them this week. The Swiss National Bank unexpectedly jumped into the fray with a cut just ahead of Mexico. The PBOC has been previously easing. The Grand Old Lady of Threadneedle Street sounded more dovish at the margin this past week. The ECB sort of kind of sounds like June might be a go but is leaving itself a few outs along the way like this coming week’s inflation readings and the next round of wage figures. Next up may be a tee-up from the Riksbank this week that could serve as a test case for how quickly a central bank that is alleged to have fouled up by being overly restrictive in the past is willing to respond more quickly this time around. SARB, on the other hand, should be in no rush.
Contrary to popular sentiment, the Federal Reserve didn’t lead all of that. Relative to some of these cases it’s a bit of a laggard, but understandably so. Another core PCE reading this week is likely to further demonstrate its need for exhibit further patience before potentially easing. We’ll also have a chance to hear from three top Fed officials on the extent to which they’re happy with markets that are pricing most of a quarter-point cut in two-and-a-half months at the June meeting while the dot plot signals only two more cuts over the remaining four meetings afterward.
In other cases, like the Bank of Canada, there are several idiosyncratic risks to consider that should merit greater caution than elsewhere on when to ease. A key speech on productivity this week may drive home that point from the standpoint of inflation risk.
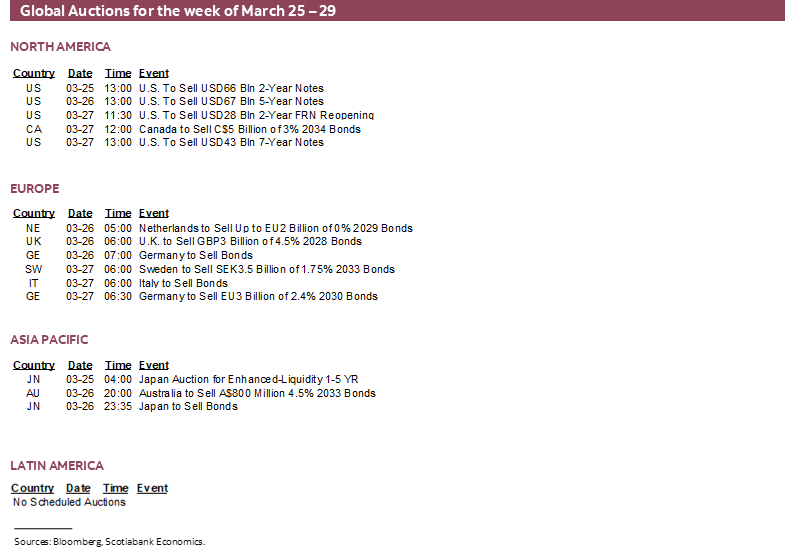
A shortened week will also be a generally lighter one across world markets. Key developments will focus upon a round of inflation updates from the US, Eurozone, Australia and Japan. Canada’s economy will be a focal point with GDP on tap. The NYSE will be closed Friday and Treasuries will close early while Canadian equity and bond markets will be closed along with many others over the long weekend into Easter Monday.
CANADA’S ECONOMY—ON THE REBOUND?
Canada will update GDP tracking on Thursday. The numbers are likely to showcase an economic rebound into Q1. The numbers on tap will include any potential revision to Statcan’s preliminary estimate for 0.4% m/m SA growth in January, as well as a tentative estimate for February. The combined outcome will give us better tracking for Q1 GDP growth overall.
My simple regression model against known activity readings estimates growth of 0.3% m/m SA in January but it doesn’t capture some of the upside risks and unique considerations that Statcan had noted. For one thing, recall that public sector strikes in Quebec during December hit output in the education sector and drove it down by 3.8% m/m SA for a weighted drag effect on GDP growth that month of -0.2%. Strikes also affected the health sector but with much less severity given mandatory service requirements. Unusually warm weather in December also hit utilities (-3.6% m/m) which knocked another 0.1 ppts off of GDP growth. Most of that combined effect of strikes and the drag from utilities is likely to rebound in January.
The question then becomes one of assessing further momentum into February. We have very little to go by in estimating what Statcan could offer for a preliminary reading. Hours worked were up by another 0.3% m/m which should buoy GDP defined as hours times labour productivity. Housing starts rebounded by about 14% m/m SA which should aid construction sector activity. Home sales took a breather, however, which may weigh on ancillary services. Auto sales were up again.
As for the overall quarter, hours worked are tracking the largest jump in four quarters (chart 1). The 3.3% q/q SAAR increase in hours after the 1% decline in Q4 is a major support for Q1 GDP.
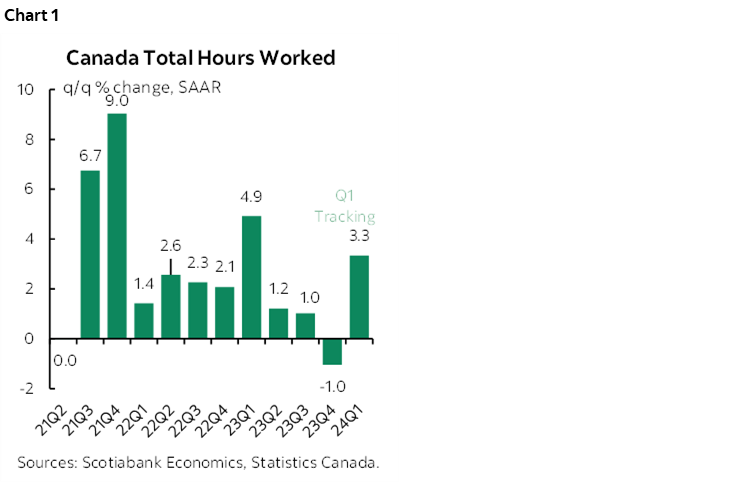
All netted out, if my estimates are anywhere close to what gets revealed, then Q1 may be tracking GDP growth around 2% q/q SAAR. That’s also in the rough ballpark of nowcast estimates for expenditure-based GDP growth. It could estimate upside potential to the BoC’s forecast for Q1 GDP growth of 0.5% q/q SAAR in its January MPR way back on January 24th and which pre-dated much of the better data since then.
Other considerations could support future growth as well as inflation risk.
Fiscal Pump Priming Continues
One is ongoing fiscal contributions to Canadian GDP growth. It's being assessed since we're in the midst of the Budget season with key ones like Ontario due out on Tuesday and then the Feds on April 16th. They will likely add to what we already know from Quebec, BC and Alberta each of which added more stimulus. Ontario is expected to add billions in additional housing supports and higher wage bills for the public service among other efforts.
At this point, I'd hazard a guess that fiscal policy adds up to around 1% as a contribution to GDP growth in 2024 and 0.75–1% in 2025. The BoC had estimated fiscal contributions of 0.6 ppts in 2024 and 0.5 ppts in 2025 in its January MPR forecast. That only included announced initiatives up to that point and nothing from the current Budget season.
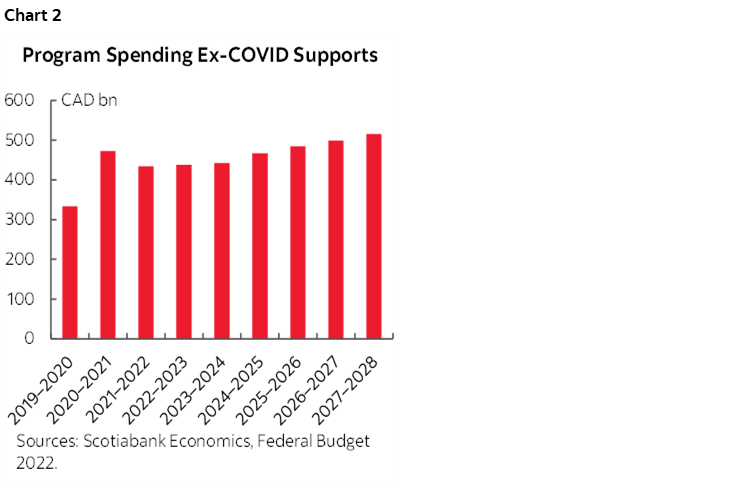
The BoC won’t be able to incorporate anything from the Federal budget into the April MPR unless it’s all leaked well in advance instead of the usual pattern in the days immediately prior. I can easily see the BoC adding a few tenths to the weighted fiscal contribution to growth once they have all of the information and they might do it in two steps in the April MPR and then the July MPR to capture the Federal budget. Still, the direction of risks to the 30% increase in Federal program spending excluding temporary Covid supports since the start of the pandemic and the cumulative 60% planned increase by FY2026–27 relative to the start of the pandemic may be headed even higher yet once pharmacare is fully factored in, along with additional housing and other supports (chart 2).
So what you say? During press conferences, Macklem has said that fiscal stimulus would already add to growth this year and next and anything further during the Budget season would not be helpful to their goal of containing inflation. That was about as direct of a warning shot from a central banker as is likely. Ergo why I argue that the BoC shouldn't add monetary easing to fiscal easing.
The Terms of Trade
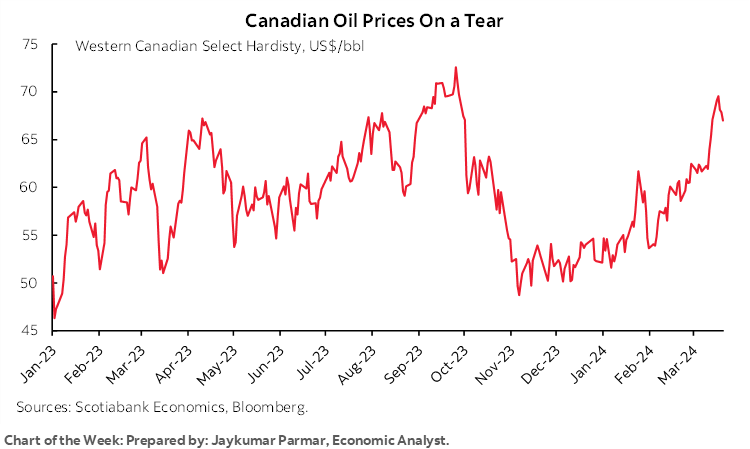
One point I've been making on the BoC is to bear in mind that they keep a strong eye on the terms of trade (export to import prices) since Canada is an open economy that trades a lot. Key in this regard are commodity prices and particularly oil.
On that note, chart 3 hardly screams 'cut.' Western Canada Select—a proxy for the price at which heavy oil out of Alberta and Saskatchewan sells—is up by about US$19 per barrel since the low in October and by over US$10 since the BoC’s January MPR forecasts. That serves as an imported positive income shock that trickles through the economy into fiscal balances, corporate financial conditions, and households. It's a source of external stimulus to the economy.
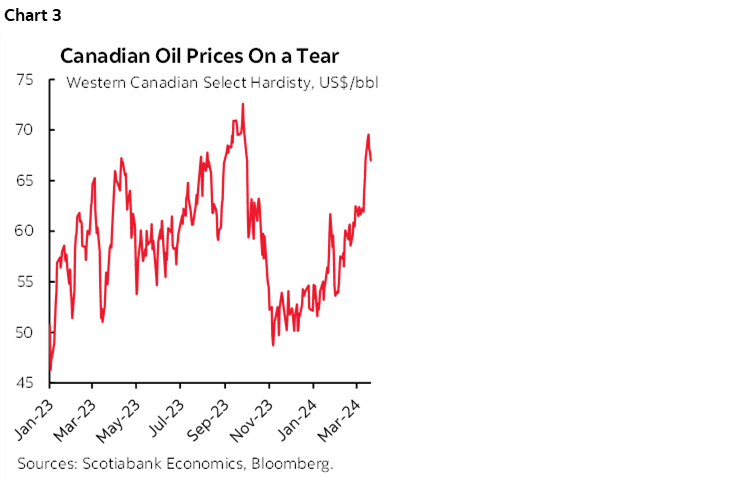
Most of the rise in this measure of oil prices has been due to a falling discount to WTI which in turn is probably significantly due to the Trans Mountain expansion pipeline that has begun filling with oil and is set to being exporting oil by early Summer. The pipeline expansion will roughly triple the amount of oil going to Canada’s west coast to about 900kbpd. That opens up a new avenue for getting Canadian oil to market than the bottlenecks through Keystone and down to the US Gulf Coast. Canada suffered a large discount to its oil prices because of that bottleneck and because of higher processing costs for heavy versus WTI. By corollary, this is a hike in US imported oil prices given that Canada accounts for about 60% of US oil imports.
In the past, the BoC has cut when oil prices tumbled (eg. early 2015) and turned incrementally more hawkish when they rise.
Immigration Remains Excessive
Canadian immigration remains far beyond the ability of the economy to absorb such volumes in such a short period of time even with the Federal Government’s recent curtailment of the temporary residents category.
Chart 4 shows the path forward if the Feds stick to their targets for permanent residents and actually achieve agreement and effective enforcement on lowered nonpermanent immigration targets with the provinces. Population growth will slow markedly, but probably more so next year and in 2026 given that negotiations with the provinces are only just about to start and will extend into late Summer.
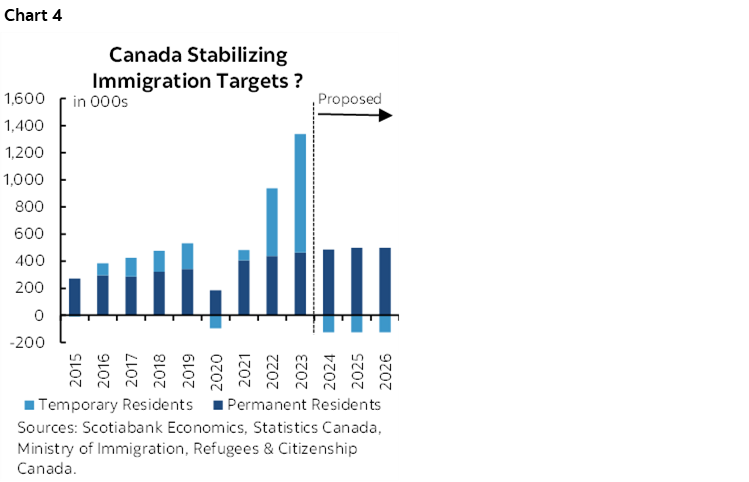
That will still leave Canada in the position of absorbing the over two million increase in population over 2022–23 and with more in 2024 through a surge in immigration, plus additional increases each year. I think that will continue to pressure housing affordability and broader inflation risk relative to supply constraints for a long while yet.
So, cut you say. With a policy rate 50bps below the Fed's to begin with, with the key 5s yield around 3½% and hence about 90bps below last Fall's peak with pass-through ahead, with a soft currency versus the Fed's strong dollar, with soaring oil prices, and with progress toward building a small amount of excess capacity likely stalled out in Q1. Fin conditions do not scream ease. Nor does immigration or fiscal policy or the interplay between wages and productivity that I’ll return to below.
CENTRAL BANKS—WILL THE RIKSBANK BE NEXT TO TEE ONE UP?
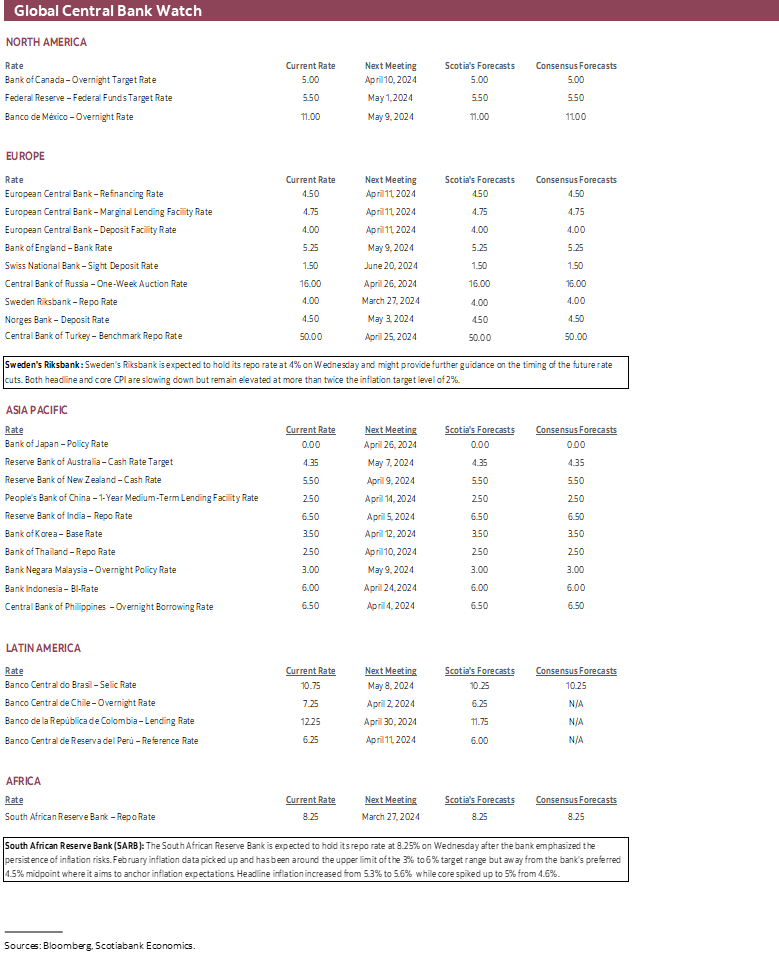
Only two regional central banks deliver decisions this week while there will be light communications from the Federal Reserve and Bank of Canada among others.
Riksbank—Avoiding Sadomonetarism
Sweden’s Riksbank delivers an updated policy decision on Wednesday. It’s expected to hold its policy rate unchanged at 4% again. The bias and refreshed explicit forward guidance on the policy rate will be the key. They will be published in an updated Monetary Policy Report with this meeting.
At its last meeting in early February, the Riksbank said “The policy rate can therefore probably be cut sooner than was indicated in the November forecast” because “there is less risk of inflation becoming entrenched at levels that are too high.”
Its November forecast had held out the prospect of a further hike but this was struck from the February 1st policy statement. The November forecast only guided cutting by 2025 and only by perhaps a quarter point and perhaps up to half a point by 2026. Only by 2025 was underlying inflation projected to slip under 2% y/y.
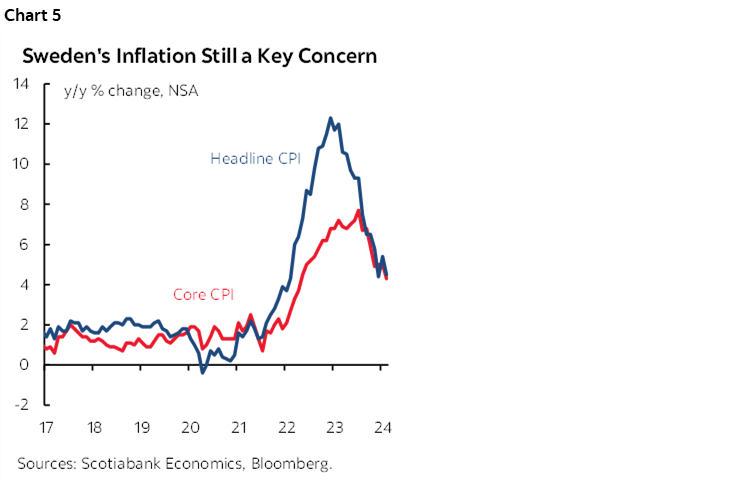
Recent inflation has been coming in lower than expected on an underlying ex-energy basis (chart 5). The path prompted the Riksbank to guide in February that “the possibility of the policy rate being cut during the first half of the year cannot be ruled out” in reference to 2024. Since then, Deputy Governor Floden has remarked that “In recent months, it has become increasingly clear that inflation is falling back towards the target” and that February’s reading “was a very good number, which confirms that we are still heading in the right direction.”
Markets are already only the risk. OIS market pricing is assigning over 50% odds to a cut as soon as the next meeting on May 8th and 100–125bps of cutting by year-end.
Longer memories will recall the spat between Paul Krugman when the Riksbank tightened policy by 175bps starting in 2010 into 2011 that he felt was too much too soon after the GFC and so much so that he coined the term ‘sadomonetarism.’ He’s quiet this time. That could be because the Riksbank would rather not repeat such an episode by maintaining overly restrictive policy for too long, though they had their own equally aggressive defense against Krugman’s charges at the time.
SARB—No Rush to Cut Here!
The South African Reserve Bank will be the other central bank to weigh in this week with a policy decision on Wednesday. No change in the repo rate of 8.25% is expected but the bias will be carefully monitored.
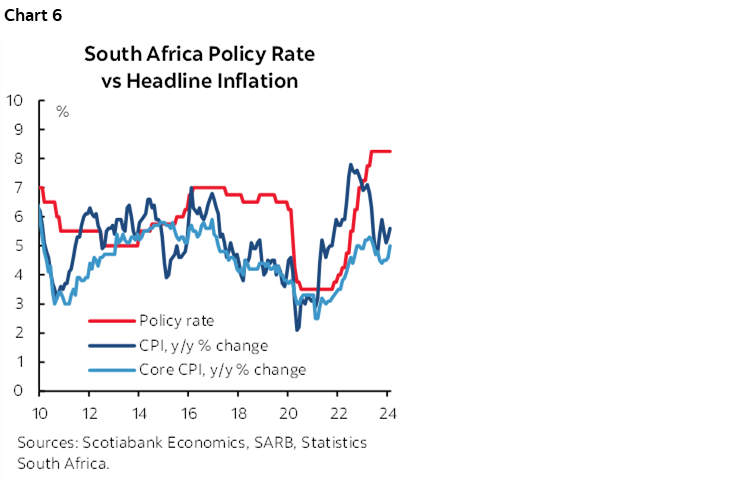
Unlike the Riksbank, SARB faces rising inflation (chart 6). February’s headline CPI reading moved up to 5.6% y/y and is threatening the upper end of SARB’s 3–6% inflation target range while core CPI reading climbed to 5% y/y and has been on an upswing again since October. The latest catalyst was a 1.2% m/m NSA jump in core prices during February that made it the hottest month of February since the very beginning of the pandemic.
SARB said at its last meeting in January—and hence before February’s inflation reading—that “serious upside risks to the inflation trajectory from global and domestic sources are evident.” What has happened since then would not alter its restrictive stance.
The BoC On Canadian Productivity
BoC Senior Deputy Governor Carolyn Rogers will deliver a speech on “the urgent need to improve Canadian productivity” on Tuesday. Rogers is not a trained economist (she’s an accountant) but her insights and those of the whole Governing Council and BoC staffers could shed light on how seriously the BoC is treating the challenge.
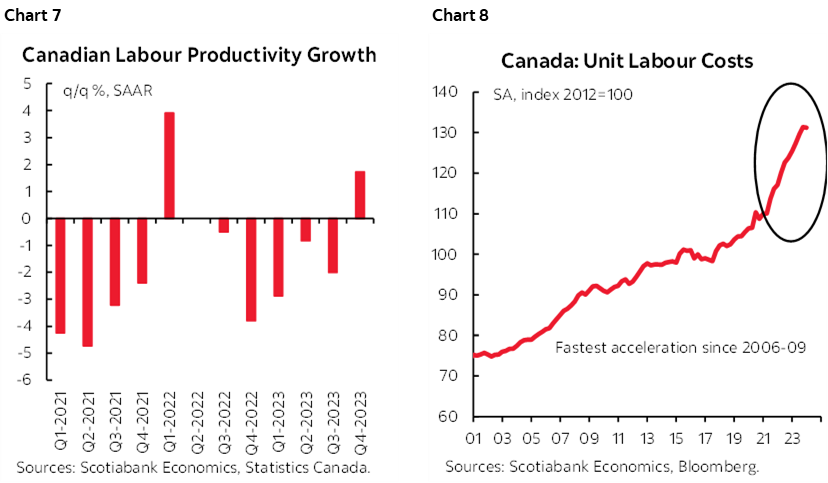
Chart 7 serves as a reminder of the gravity of the situation. So does chart 8 on unit labour costs that reflect productivity-adjusted employment costs. They only improved a very tiny amount in Q4 because strikes took down hours worked and created the illusion of a productivity lift that is likely to fall again in 2024Q1.
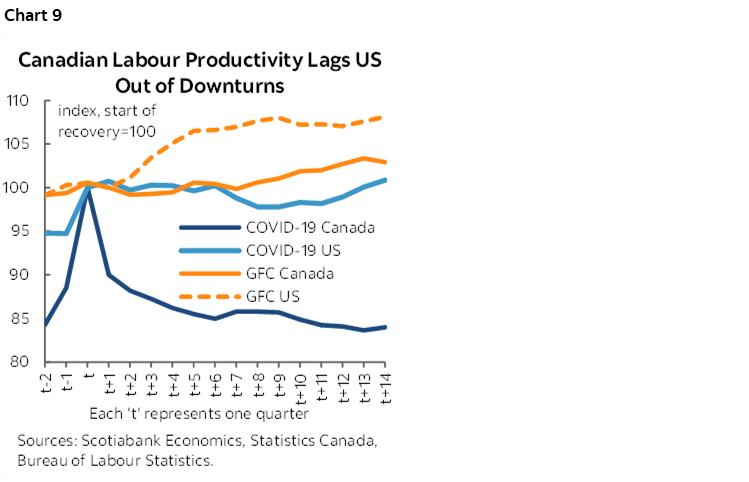
Everyone has pet theories as to why Canadian labour productivity—defined the way most economists would as output per hour worked—has been so bad for so very long. It is not a new phenomenon and spurious correlations need to be avoided. Long-lived challenges include underinvestment by businesses, low technology adoption rates by businesses, possibly structural drivers such as Canada’s much bigger weight upon lower small business productivity than bigger businesses compared to the US, and of course the public policy framework that may contribute to these issues and others. Plus, there is something about the Canadian economy that makes it perform much worse on productivity coming out of major shocks than the US (chart 9).
Of instance, Canada never let labour become more efficiently reallocated from areas of lower return to higher return because pandemic supports were overly generous and lasted too long. Supports for rent and wage bills were extraordinarily generous. The US did away with more modest supports earlier and that may be why they are witnessing a strong rebound.
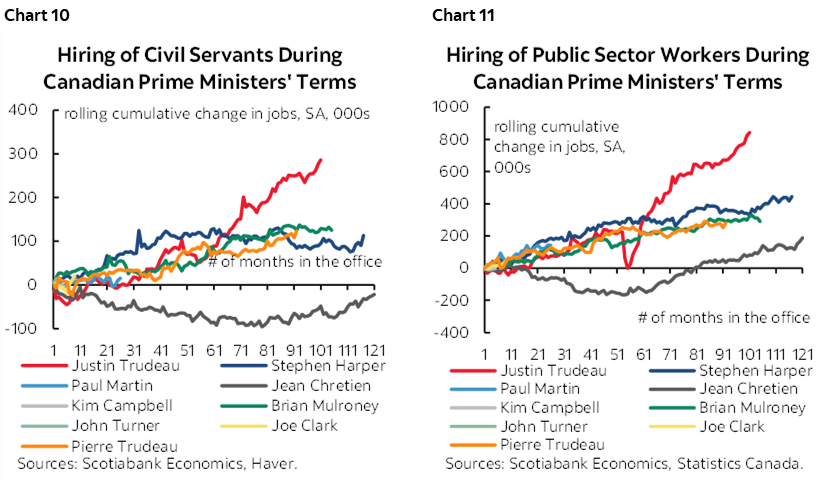
Very strong public sector over-hiring (charts 10, 11) may have added further complications by causing unfilled job vacancies and therefore lost opportunities in the private sector to produce more.
I’ll be interested to hear what they think of immigration’s role. I’ve previously argued that we cannot be overly hasty in judging the impact upon real gdp per capita and productivity. A sudden population shock can present first- and subsequent-round effects. The first-round effect may be to depress GDP per capita as new arrivals struggle to integrate into the economy. The second-round and subsequent effects could unleash an improving trend as new arrivals get integrated, get jobs, start businesses, buy homes and consume, and begin to drive overall output. It’s far too early to judge the outcome in my view.
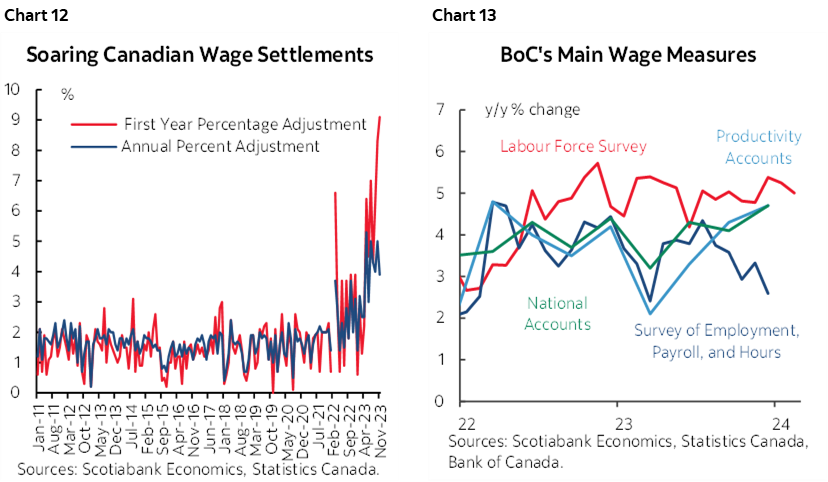
Regardless, pay gains are vastly outpacing productivity which is why unit labour costs are now rising much more rapidly than in Mexico and therefore driving a) inflation risk in Canada, and b) an erosion of Canada’s business competitiveness.
This week should bring a reminder of the role of collective bargaining exercises when Quebec’s public sector wage agreements get factored into the latest readings on contract settlements. The last round of monthly data showed that fresh agreements struck an average wage gain of over 9% in the first year and about double the BoC’s 2% inflation target over the multi-year life of the agreement (chart 12). That hardwires years of wage pressures for the one-in-three workers who are unionized in Canada (10% in the US). It’s one reason why I think we can’t just look at short-term data on economy wide wages including the four measures that the BoC follows (chart 13). The weakest of them—SEPH—measures only payroll employees and excludes the many smaller businesses that don’t have formal payrolls which is a big deal in Canada. It also lags way behind other wage data. Plus, payroll wages have also probably yet to begin to incorporate wage settlements in earnest.
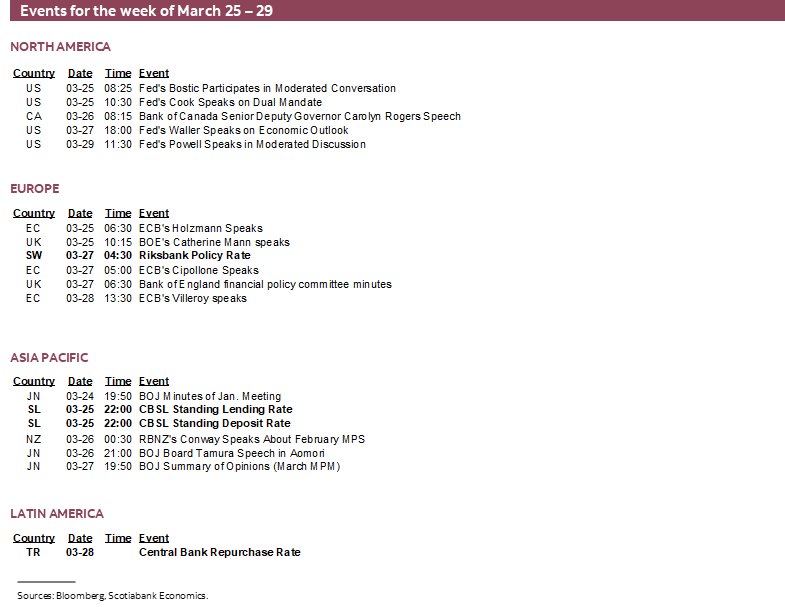
Key Fed-Speak
Post-blackout Fed-speak returns in the wake of the recent communications (recap here).
- Governor Cook speaks on ‘the dual mandate and the balance of risks” on Monday.
- She will be followed by Governor Waller’s speech on the economic outlook on Wednesday.
- The boss speaks on Friday when Chair Powell participates in a moderated discussion at the San Francisco Fed’s policy conference.
GLOBAL INFLATION—FOCUS ON THE US AND EUROZONE
Several global inflation readings will emerge this week, notably including from the US and Eurozone.
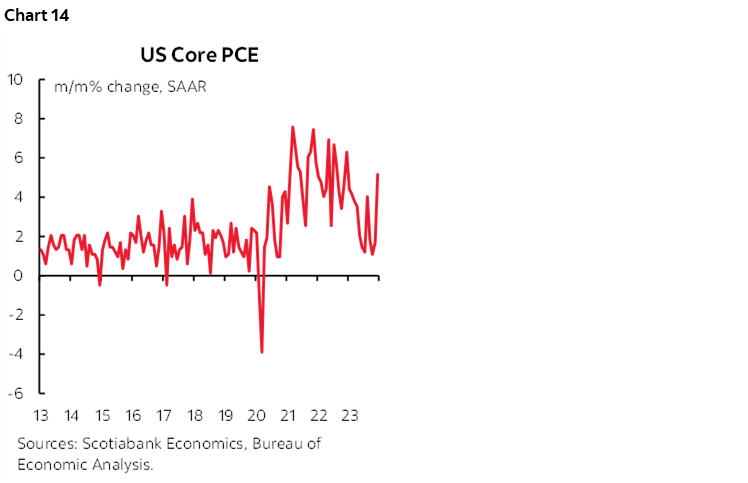
- US PCE (Thursday): The Fed’s preferred core PCE gauge will be updated with an estimate for February on Thursday. Just about everyone went with 0.3% m/m SA. Some of us submitted this estimate that is below the 0.4% core CPI reading and the prior core PCE reading of 0.4% before Chair Powell spoke this week. When he said that the figure was likely “well below 0.3%” on a m/m basis he was assumed to be quoting estimates by Fed economists. How much below 0.3%? Presumably not enough to avoid it being rounded up to 0.3. A reading around 0.3% m/m would lift the three month moving average of underlying trend core PCE inflation after the prior surge (chart 14).
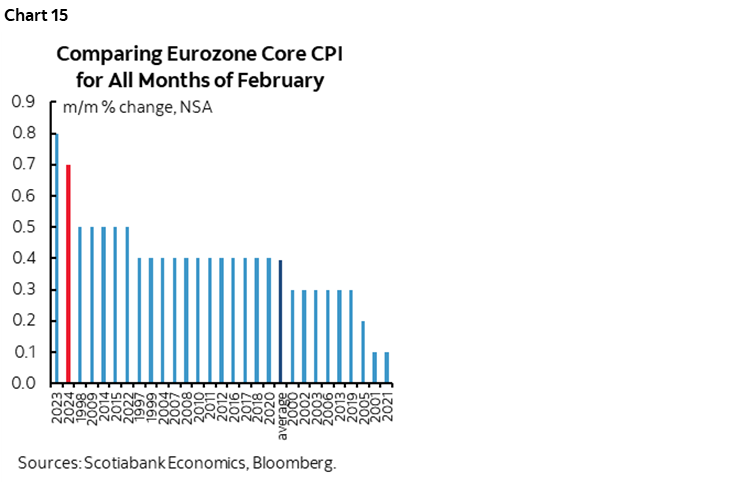
- Eurozone CPI: While the Eurozone add-up doesn’t arrive until the following week, we should get a pretty good feel for it when figures are released from Spain (Wednesday) and then France and Italy (Friday). Key will be whether they indicate the Eurozone core CPI in seasonally unadjusted terms puts in hotter than normal readings compared to like months in history as did each of the prior three months (chart 15). Also watch for any pop higher in travel-related categories like package holiday prices and airfare ahead of the Easter long weekend but that is more likely to be a sensitivity into the April readings.
- Australian CPI (Monday): February’s reading is expected to tick up in year-over-year terms to 3.5%. More important will be whether trimmed mean CPI continues to decelerate. Australia’s trimmed mean gauge lops off the top and bottom 15% of the basket which is a little wider than others like Canada where the 20% tails are removed in order to arrive at a central tendency measure of underlying inflation.
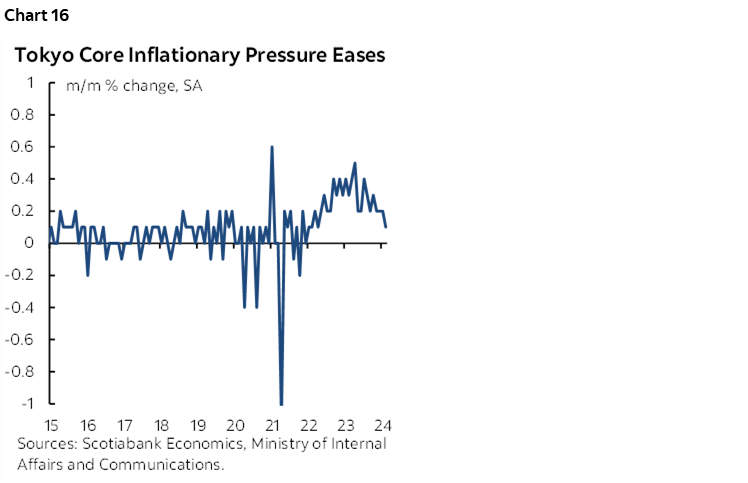
- Tokyo (Thursday): The Tokyo and national core CPI readings have been decelerating in m/m terms which raises the prospect that the rise was temporarily driven by factors like the lagging pass through effects of prior moves in the yen and oil prices (chart 16). The reading for March will be another milestone along this path, but not one with immediate policy implications since the BoJ is likely to take a prolonged breather from further policy changes.
GLOBAL MACRO INDICATORS
There will be a round of other global releases on tap this week that I’ll write more about as the week progresses. Please see the indicator tables for a list of the key ones.
DISCLAIMER
This report has been prepared by Scotiabank Economics as a resource for the clients of Scotiabank. Opinions, estimates and projections contained herein are our own as of the date hereof and are subject to change without notice. The information and opinions contained herein have been compiled or arrived at from sources believed reliable but no representation or warranty, express or implied, is made as to their accuracy or completeness. Neither Scotiabank nor any of its officers, directors, partners, employees or affiliates accepts any liability whatsoever for any direct or consequential loss arising from any use of this report or its contents.
These reports are provided to you for informational purposes only. This report is not, and is not constructed as, an offer to sell or solicitation of any offer to buy any financial instrument, nor shall this report be construed as an opinion as to whether you should enter into any swap or trading strategy involving a swap or any other transaction. The information contained in this report is not intended to be, and does not constitute, a recommendation of a swap or trading strategy involving a swap within the meaning of U.S. Commodity Futures Trading Commission Regulation 23.434 and Appendix A thereto. This material is not intended to be individually tailored to your needs or characteristics and should not be viewed as a “call to action” or suggestion that you enter into a swap or trading strategy involving a swap or any other transaction. Scotiabank may engage in transactions in a manner inconsistent with the views discussed this report and may have positions, or be in the process of acquiring or disposing of positions, referred to in this report.
Scotiabank, its affiliates and any of their respective officers, directors and employees may from time to time take positions in currencies, act as managers, co-managers or underwriters of a public offering or act as principals or agents, deal in, own or act as market makers or advisors, brokers or commercial and/or investment bankers in relation to securities or related derivatives. As a result of these actions, Scotiabank may receive remuneration. All Scotiabank products and services are subject to the terms of applicable agreements and local regulations. Officers, directors and employees of Scotiabank and its affiliates may serve as directors of corporations.
Any securities discussed in this report may not be suitable for all investors. Scotiabank recommends that investors independently evaluate any issuer and security discussed in this report, and consult with any advisors they deem necessary prior to making any investment.
This report and all information, opinions and conclusions contained in it are protected by copyright. This information may not be reproduced without the prior express written consent of Scotiabank.
™ Trademark of The Bank of Nova Scotia. Used under license, where applicable.
Scotiabank, together with “Global Banking and Markets”, is a marketing name for the global corporate and investment banking and capital markets businesses of The Bank of Nova Scotia and certain of its affiliates in the countries where they operate, including; Scotiabank Europe plc; Scotiabank (Ireland) Designated Activity Company; Scotiabank Inverlat S.A., Institución de Banca Múltiple, Grupo Financiero Scotiabank Inverlat, Scotia Inverlat Casa de Bolsa, S.A. de C.V., Grupo Financiero Scotiabank Inverlat, Scotia Inverlat Derivados S.A. de C.V. – all members of the Scotiabank group and authorized users of the Scotiabank mark. The Bank of Nova Scotia is incorporated in Canada with limited liability and is authorised and regulated by the Office of the Superintendent of Financial Institutions Canada. The Bank of Nova Scotia is authorized by the UK Prudential Regulation Authority and is subject to regulation by the UK Financial Conduct Authority and limited regulation by the UK Prudential Regulation Authority. Details about the extent of The Bank of Nova Scotia's regulation by the UK Prudential Regulation Authority are available from us on request. Scotiabank Europe plc is authorized by the UK Prudential Regulation Authority and regulated by the UK Financial Conduct Authority and the UK Prudential Regulation Authority.
Scotiabank Inverlat, S.A., Scotia Inverlat Casa de Bolsa, S.A. de C.V, Grupo Financiero Scotiabank Inverlat, and Scotia Inverlat Derivados, S.A. de C.V., are each authorized and regulated by the Mexican financial authorities.
Not all products and services are offered in all jurisdictions. Services described are available in jurisdictions where permitted by law.