Next Week's Risk Dashboard
- Fed Board to advance plans for easing large bank capital rules
- Fed Chair Powell to testify before Congress
- Fade Waller’s guidance
- Capping the US 10-year Treasury yield
- Banxico expected to cut, amid inflation warning signs
- BanRep expected to hold with cut risk
- Canadian CPI starts the clock ticking for the BoC’s July decision
- Canada’s economy probably put in a soft April, May—with caveats
- Why so silent on rising Canadian real per capita GDP?
- Global PMIs to offer a fresh take on tariffs and supply chains
- US PCE expected to be soft again
- Eurozone CPI might pick up
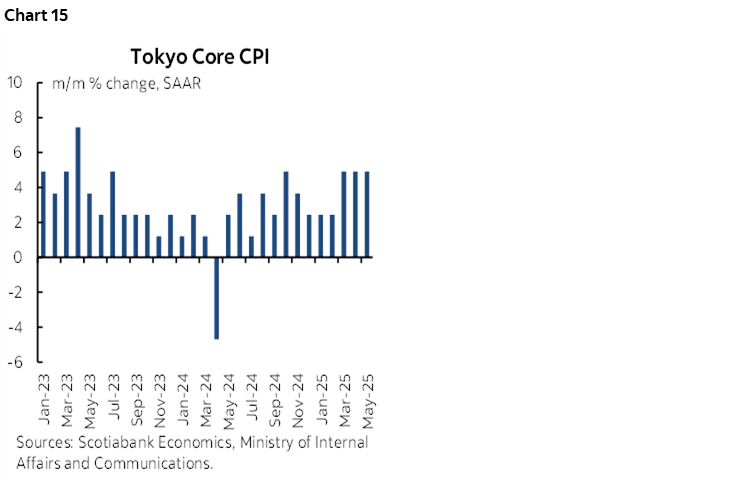
- Tokyo core CPI still on a tear?
- Australian core inflation: aberration or a new trend?
- BoT unlikely to surprise again
Chart of the Week
Last week may have simply been a warm-up for what’s to come. A dull FOMC meeting could give way to more impactful developments this week. Bank of Canada Governor Macklem’s recent speech had little effect, but the clock starts ticking for his emphasis on the two CPI reports due out before the next decision. Developments in the Middle East remain tense, as Trump pushed out the timing of his at best thinly veiled threats and perhaps because his MAGA base is divided on what to do and unconvinced that success would be assured.
We’ll hear a lot from the Federal Reserve, but also witness fresh decisions by a trio of regional central banks (Banxico, BanRep, BoT). A lot of data risk will be packed into the week with key ones including a wave of global PMIs that will offer fresh soft data on supply chains and tariffs, US core PCE inflation, Canadian GDP and CPI, early indications for Eurozone CPI, Australian CPI, Tokyo CPI and other readings.
CENTRAL BANKS—THIS WEEK’S FED MATTERS MORE TO MARKETS THAN LAST WEEK’S
A potentially more important week for Federal Reserve communications will combine with policy decisions by three regional central banks.
This Week’s Fed Communications May be More Important than Last Week’s
Federal Reserve Chair Powell delivers the semi-annual Monetary Policy Report (here) and Congressional testimony on Tuesday before the House Financial Services Committee and then repeats it on Wednesday before the Senate Committee on Banking, Housing, and Urban Affairs. For the most part, he may repeat many of the messages that were provided in this past week’s communications (recap here). There could be two twists.
How Soon is Too Soon for a Cut?
He may be asked about whether July is a ‘live’ meeting that could deliver a cut. Powell’s remarks sounded very much like the Committee is taking the summer off to assess developments and data. His remarks did not sound like he is amenable to easing as soon as the next July meeting. Powell’s usual preference—particularly at potential turning points following long pauses—is to hold the market’s hand, yet absent from his talk were references like how “it may soon be appropriate” to ease, or “somewhat soon” that could inform timing of cuts. Watch for a potential direct question asking him if such language is in his nearer-term toolkit.
And yet Governor Waller recently sounded open to a July cut, dismissive of inflation effects from tariffs, and (perhaps) prematurely declared there is no tariff effect showing up in inflation data despite plausible arguments for how such effects are merely delayed. Waller may be revealing that he is one of the two bottom dots for this year (ie: -75bps of cuts) which is against large number of colleagues who prefer either no cut or 50bps of cuts.
And yet is Waller saying these things because he truly believes them with a justifiable case? Maybe, there is a path to his views on inflation but a very high bar against his July cut. Or is he doing so because I think he has a tendency to misjudge inflection points? In my opinion, he enjoys playing in the tails of debates. For instance, recall his role in driving premature easing bets by early 2024 when he said in November 2023 that if inflation eases “for several more months—I don’t know how long that might be—three months, four months, five months …. you could then start lowering the policy rate just because inflation is lower.” Also recall his dissenting vote against tapering quantitative tightening at the March 2025 meeting that—with the partial benefit of hindsight given events that followed—turned out to probably have been the wrong stance.
Alternatively, while Governor is a respected official, it merits noting that his dovish stance is compatible with President Trump’s views and that the President must choose a successor to Powell before the Chair’s term is up next May.
How Might the Board Change Bank Capital Restrictions?
Powell could also be grilled about possible changes to the Supplementary Leverage Ratio. The notice for the Federal Reserve Board’s public meeting next Wednesday at 2pmET included a brief reference (here) to consider “proposed revisions to the Board’s supplementary leverage ratio standards.” Powell’s two rounds of testimony straddle this meeting and therefore offer an opportunity for the more adventurous members of Congress to grill him on it in between their political rants.
The supplementary leverage ratio was introduced in January 2018 as part of Basel III changes and requires large banks to hold 3% of on-balance sheet and many off-balance sheet assets such as derivatives in Tier 1 capital that itself includes common equity, preferred equity, and disclosed reserves. The smaller number of very large Global Systematically Important Banks (GSIBs) must hold 5% through an enhanced supplementary leverage ratio (eSLR). The ratio is risk-insensitive, meaning that it may result in too much capital being held for lower risk assets relative to higher risk assets. For example, the capital requirement does not differentiate between some riskier assets and lower risk assets such as Treasury securities. The aim of the SLR was to improve safety and soundness of the financial system after the Global Financial Crisis by providing more of a capital buffer against adverse shocks.
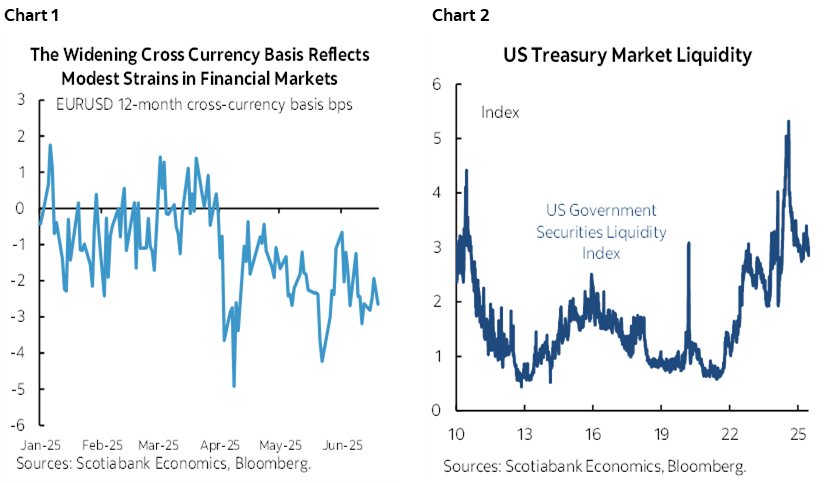
The SLR is widely viewed to have had some unintended and undesired effects. For instance, it restrained the ability of banks to put their balance sheet heft to work in periods when market dysfunction may be rising as a response to shocks out of fear they could violate the rule as the denominator is revalued which would require increasing capital. It’s not uncommon to overshoot the SLR/eSLR requirements out of fear that a shock could drive the ratio below the requirement and land banks in trouble with regulators. By not exempting Treasury securities, for example, the ability of banks to play the same important role as arbitrage players to restore equilibrium between the rates and FX markets in a covered interest parity framework was lessened and therefore the error term on this relationship—the basis—widens (chart 1). The SLR is also part of the plausible explanation for the deterioration of Treasury market liquidity as shown in chart 2 (higher is worse liquidity as pricing strays further from a measure of fair value).
To lower the ratio and exempt Treasuries could conceivably free up trillions of dollars for the Treasury market and lower yields by a material amount. What the Board discusses and decides, plus any comments during Powell’s testimony, could inform the expected magnitude of change and its composition.
A key question, however, is how much of a potential change is not already priced in. There has long been talk of revisiting the SLR and eSLR. Changing it to address criticisms would hardly be a total surprise. Some of the possible changes are probably already priced in, but we cannot judge how much until we see important details. Ditto for other asset classes that may also be affected by SLR changes.
The SLR/eSLR is Among Reasons for Lower than Feared Treasury Yields
Still, this likely set of changes is among the reasons why I’m of the belief that crossing 5%++ on US 10-year Treasury yields—while not fleetingly impossible—is unlikely to be a durable outcome. Other supporting points include the following ones:
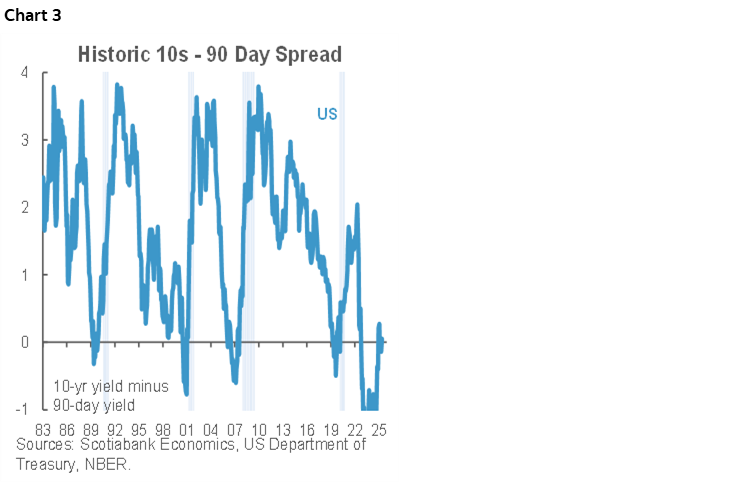
- We think pain still lies ahead for the US economy in forthcoming data that reflects the uncertainty and confidence shock plus the direct and indirect effects of tariffs and other policies like immigration changes. A safe haven premium may arise relative to what is likely the current case that has markets more prone to believing in the resilience of the US economy to date. 10s90s usually flattens into soft patches and especially recessions (that we are not presently forecasting). Chart 3.
- Deficit projections have largely been factored into markets at present valuations.
- If Trump is adamant that he wants a baseline universal tariff against all—or significant countries—of, say, 5–10%, then these revenues could offset the CBO’s projected cumulative deficit impact of the ‘one big beautiful bill’ of about $2½ trillion over the next ten years. The CBO cannot include tariff revenues because they are driven by executive orders, not legislated actions by Congress. Tariffs are bad economic policy that could cost US growth but could divert revenue from US consumers and businesses into Treasury’s coffers. That means less bond supply than taking the deficit projections literally.
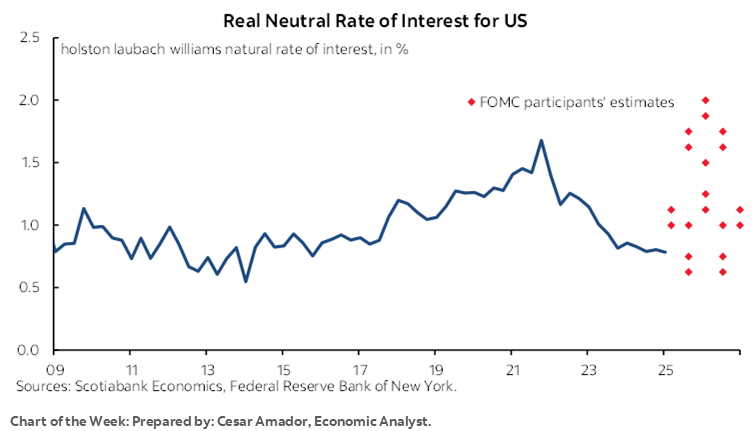
- 5%++ 10s would probably require almost all estimates of the Fed’s nominal neutral policy rate of around 3% to be far too low.
- the term premia in 10s has already risen, but as governments adjust issuance plans and some central banks (eg. BoJ) adjust purchase plans, it may be unlikely to keep rising to prior peaks in the 1980s through early 2000s.
- we forecast that inflation will crest this year and—while remaining sticky in 2026—should pull off from first-round effects of tariffs that could last for several quarters.
- The Federal Reserve is expected to end its Quantitative Tightening program by late Winter or early Spring next year. That’s uncertain, but it has already taken a major step back with the changes in March that reduced the amount of its Treasury holdings allowed to mature and roll off the balance sheet from $25 billion to $5B per month. This means less supply coming off the Fed’s balance sheet into markets all else equal.
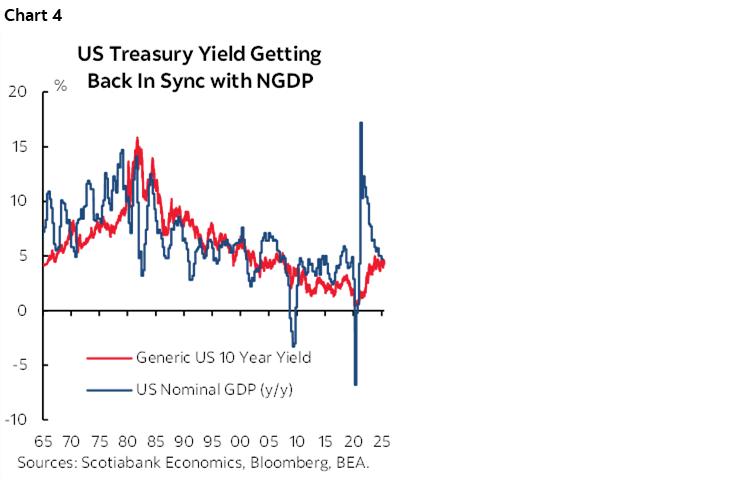
- Over time, US 10s should be roughly correlated with longer-run nominal GDP growth. The relationship is hardly airtight (chart 4), but it serves as a broad guide. Therefore, 5%++ US 10s would require believing that NGDP growth could sustainably accelerate toward such levels. Outside of some US politicians, most economists would probably find that to be a stretch.
- External influences on carry into the US Treasury market have become less harmful. In particular, carry out of Japan’s bond market into US Treasuries was becoming a negative influence as heavy longer-end issuance and plans to sharply curtail BoJ buying of JGBs were pushing through markets while JGB auction results were deteriorating. Since then, altered issuance signals and reduced pullback of JGB buying by the BoJ have contained the upward pressure on JGB yields and the translation effect into US Treasury yields.
BanRep—One Surprise Too Many?
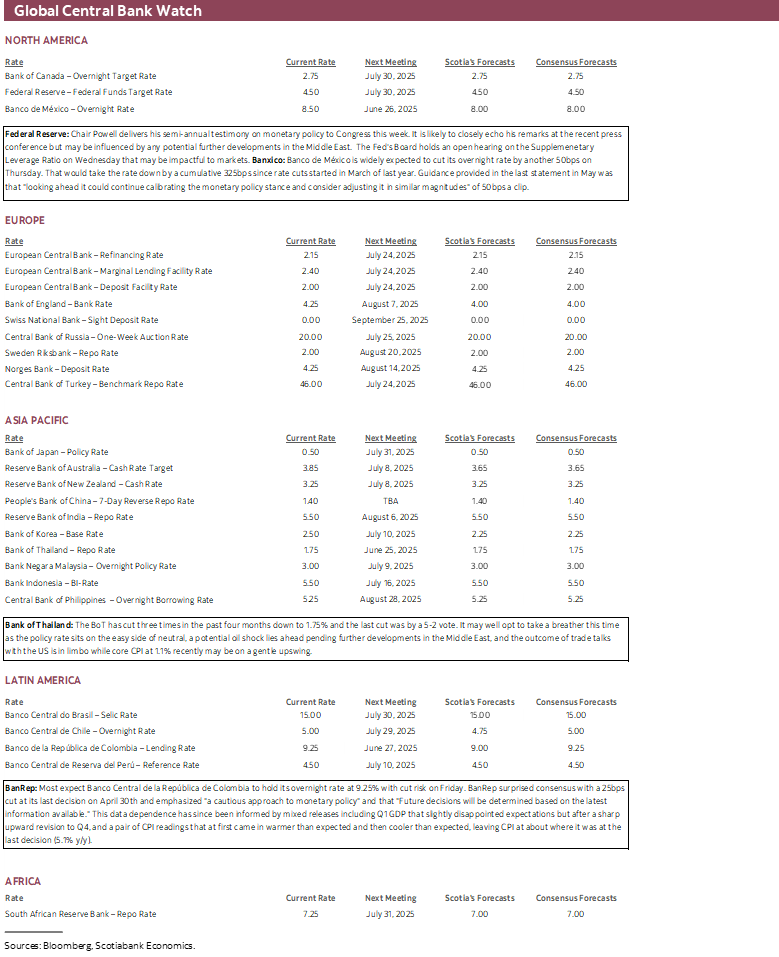
Most expect Banco Central de la República de Colombia to hold its overnight rate at 9.25% on Friday. Our local economists are in the minority that is expecting a 25bps cut. BanRep surprised consensus with a 25bps cut at its last decision on April 30th and emphasized "a cautious approach to monetary policy" and that "Future decisions will be determined based on the latest information available." This data dependence has since been informed by mixed releases including Q1 GDP that slightly disappointed expectations but after a sharp upward revision to Q4, and a pair of CPI readings that at first came in warmer than expected and then cooler than expected, leaving CPI at about where it was at the last decision (5.1% y/y).
Banxico—Adhering to Guidance
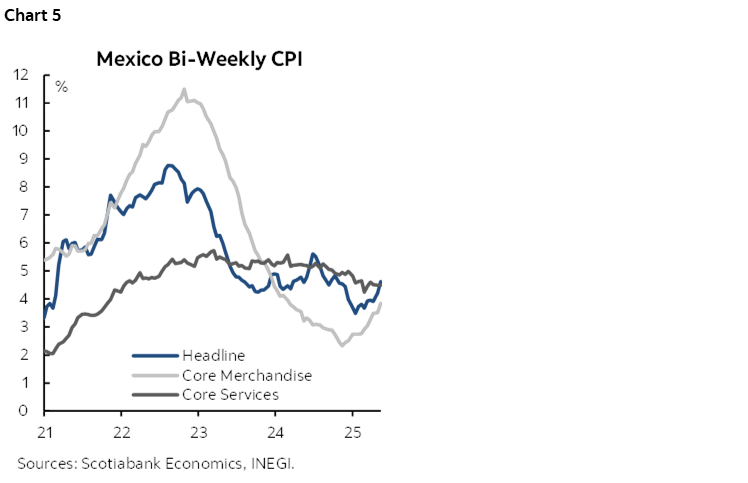
Banco de México is widely expected to cut its overnight rate by another 50bps on Thursday. Our Mexican economists agree. That would take the rate down by a cumulative 325bps since rate cuts started in March of last year. Guidance provided in the last statement in May was that "looking ahead it could continue calibrating the monetary policy stance and consider adjusting it in similar magnitudes" of 50bps a clip. Complicating the outlook may be that headline inflation and core goods inflation have been rising of late (chart 5).
Bank of Thailand—Enough?!
The BoT has cut three times in the past four months down to 1.75% and the last cut was by a 5–2 vote. It may well opt to take a breather this time as the policy rate sits on the easy side of neutral, a potential oil shock lies ahead pending further developments in the Middle East, and the outcome of trade talks with the US is in limbo while core CPI at 1.1% recently may be on a gentle upswing.
CANADIAN CPI—A LOW STANDARD
Canada refreshes CPI for the month of May on Tuesday. It’s one of two inflation readings before the next Bank of Canada policy decision on July 30th. Governor Macklem’s conflicting guidance has been that on the one hand they don’t have confidence in the outlook amid all of the uncertainty in order to be able to provide guidance, but they’ll be closely watching the next two inflation reports before that meeting nonetheless. Does that mean July is a ‘live’ meeting?
Next up is what to expect. Headline CPI won’t really be what matters, but my guesstimate is for a 0.4% m/m NSA rise that would mean the year-over-year rate would slip to 1.6%. Here are a few reasons for this estimate:
- May is normally a seasonal up-month for CPI. Normally, folks come out of hibernation and in a rite of passage for new Canadians start doing things like eating on patios and planting gardens. Seasonal price pressures in those areas can be significant.
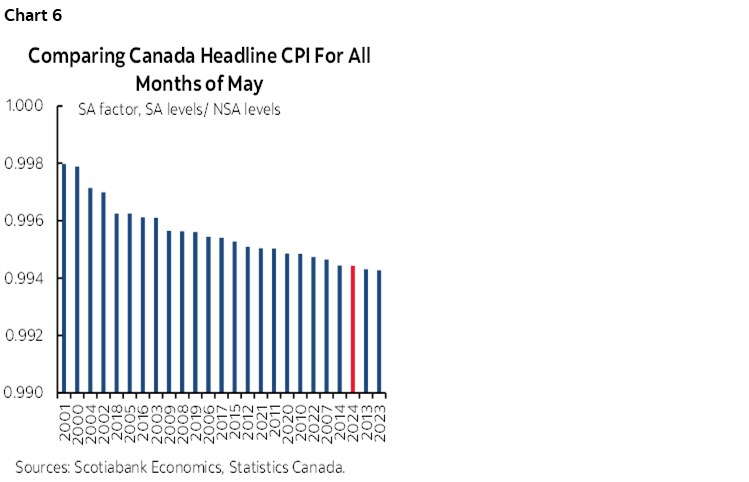
- Notwithstanding the prior point, seasonal adjustment factors have recently been lower than for like months of May in history. 2024 and 2023 saw the lowest SA factors on record compared to like months of May (chart 6). SA factors are calculated with a recency bias rooted in the pandemic and immediate post-pandemic era that may not be suitable to now and going forward. Being lower than normal tamps down seasonally adjusted CPI.
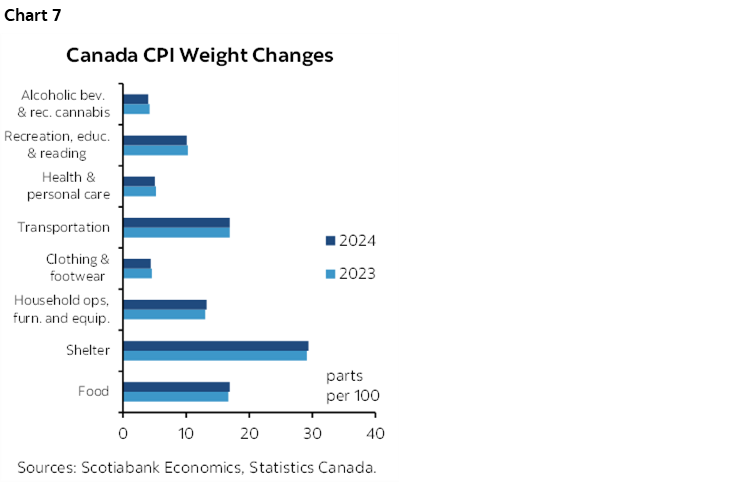
- There will be basket weight changes introduced by this report as part of Statistics Canada’s annual exercise to refresh spending weights to the latest year’s figures which means 2024 in this case. No material effect is expected from this factor. Chart 7 shows the spending weight changes by major CPI category. Applying the new 2024 weights in lieu of the 2023 weights for the prior month of April assuming no price changes themselves would have meant no material difference to that month’s 1.7% y/y and -0.2% m/m SA readings. Expect Statcan to include a sentence in their summary of the data like last year’s: “The headline CPI for May 2024 would have been the same using the 2022 basket weights.”
- Across other components, shelter cost inflation has been ebbing and with help from the elimination of the consumer portion of the carbon tax and the effects on home energy bills, but not because of rent inflation that remains sticky. Gasoline is not expected to be a material driver ex-taxes, but energy in general won’t be the same carbon-tax driven drag on m/m CPI that it was the prior month. Key will be services that were a significant part of the contributions to April CPI in categories like travel, rent, and health care.
Now for two wildcard effects. May was wet and cold across much of Canada and more so than usual. This probably explains part of why Statcan’s guidance for May retail sales was a nominal decline of over 1% m/m SA. Less activity in weather-affected categories could be disinflationary, but June has improved and so some of that price pressure might just be pushed out.
And then we have tariffs. Canada’s retaliatory tariffs have been fairly small as a share of overall imports. Like the US, it’s unclear when to expect some pass-through into prices paid by consumers given inventory being sold at pre-tariff prices, lagging supply chain responses, and at least a short-term tendency to absorb some tariffs in profit margins.
What will matter to the BoC, however, is what happens to the preferred core inflation readings—trimmed mean and weighted median CPI. You can’t look at them in y/y terms (3.2% and 1.5% for median and trimmed mean respectively) because they are not spot calculations. They are slow moving month-over-month compounded readings that take in one new month and drop the earliest month out of 12 at a time. They adapt slowly, and I don’t have a great answer for why BoC officials or much of the street quotes such measures that are so slow to adjust to new information.
I’ve always emphasized m/m seasonally adjusted and annualized rates for these measures. They capture new information at the margin and stand a better chance at adapting quickly to fresh developments like tariff shocks.
The second thing I don’t understand is why BoC officials talk of core inflationary pressures as potentially just recent volatility, or ‘ups and downs’ as one deputy governor puts it. That’s not true. Look at the data in charts 8 and 9. For about a year now these measures have been far above the BoC’s 2% headline inflation target. The BoC has no evidence to lean on that this has been temporary or just a recent phenomenon.
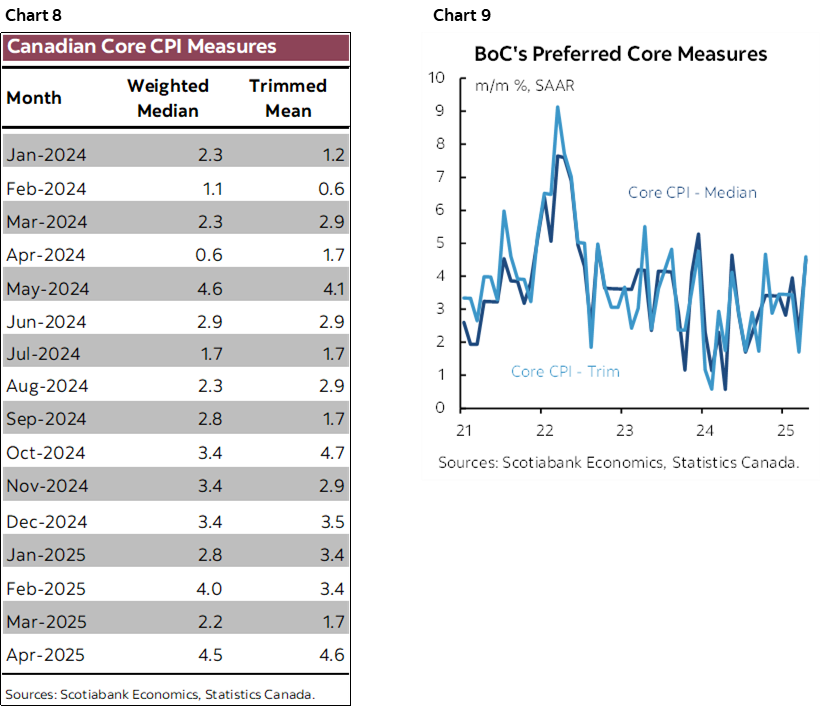
The third thing I don’t understand is why the BoC remarks that these measures may overstate inflation. They should be a little more careful. If they overstate by a lot in serially correlated fashion, then show the evidence. Otherwise, I think they might be a touch overstated but not by anywhere enough to dismiss such a prolonged overshoot.
And so back to Governor Macklem’s emphasis on the next two inflation readings before the next decision on July 30th. It’s feasible we see cooler m/m SAAR pressures in May off of the strong readings in April and effects cited above. The measures exclude all taxes including tariffs and so there will be no direct effect of tariffs on the core gauges, but there could well be indirect ones. A lousy two months of inflation data after overshooting for a year and with long and variable lags surrounding global supply chain responses to trade wars should merit setting a higher standard for evaluating pressures than just two months.
CANADA’S ECONOMY—PROBABLY SOFTER THAN GUIDED
Canada refreshes GDP figures on Friday. Due out is a potential revision to advance guidance for April GDP growth along with details by sector that are not provided with that advance guidance, plus the first ‘flash’ reading—sans details—of GDP growth in May.
StatCan had indicated on May 30th that April GDP was likely up by 0.1% m/m SA. The agency said at the time that “Increases in mining, quarrying, and oil and gas extraction and finance and insurance were partially offset by decreases in manufacturing.” Since then, data has been softer than advance readings from the agency had suggested in areas like manufacturing shipments, wholesale sales, and retail sales. How these disappointments translate into value-added GDP by sector is uncertain, but they point to more downside than upside risk to April GDP which is why I’ve gone with 0% m/m with risk of a small negative. Any election effect is likely to be very small at under 0.1% m/m on a weighted contribution basis.
As for May GDP, the limited number of advance readings we have to go by suggest another soft month. Hours worked were flat, the prior surge in housing starts levelled off, and limited other readings were soft (eg. the retail sales flash).
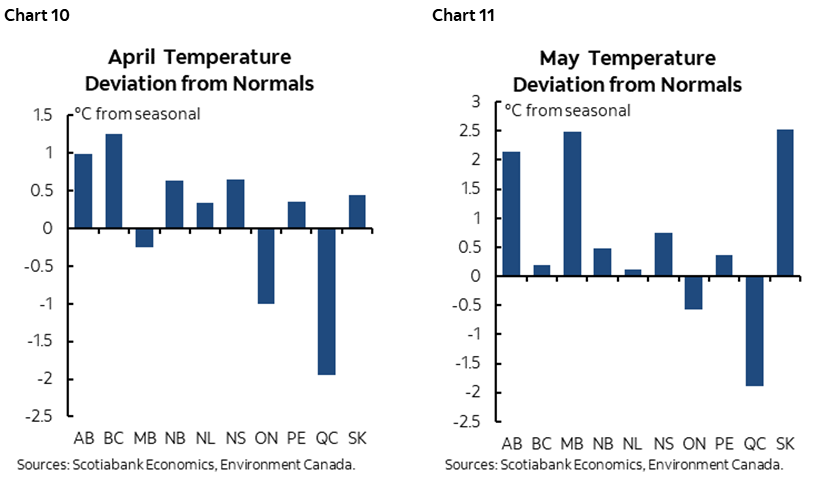
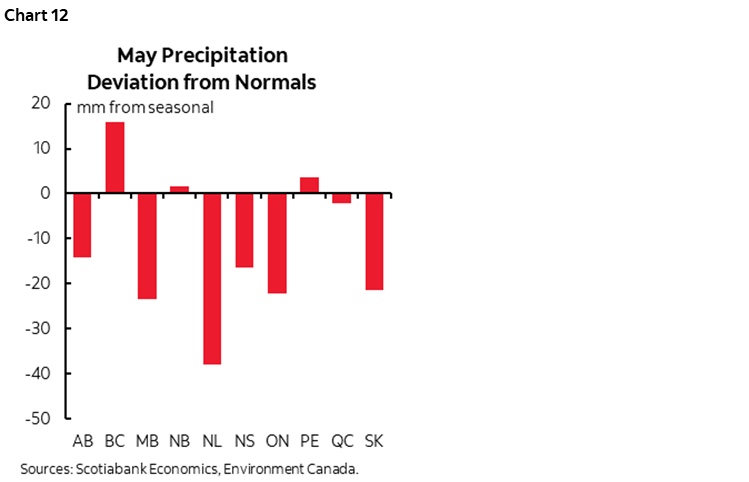
April and May were also cooler than usual months on average in the population dense regions in central Canada but warmer than usual across the prairies that have been dealing with forest fires that may weigh on growth by affecting large projects, tourism, agriculture and other affected industries (charts 10, 11). Much of the country was also drier than a usual month of May (chart 12). That likely explained some of the softness in the retail sales flash estimate for May, but there could be more underlying weakness in other weather-affected sectors.
Bear in mind, however, that monthly GDP is measured on a production basis as opposed to quarterly expenditure-based GDP that the BoC follows more closely. This is important because quarterly GDP captures influences like inventory and net import swings on GDP. After Q1 saw a large rise of imports that serve as a leakage from GDP accounts and hence a drag on growth, much of that went into higher inventories that added to GDP growth along with higher exports. These swings reflected tariff front-running effects by the trade sector and are likely to reverse into Q2 with the key question being how they net out, and more importantly, what happens to Final Domestic Demand that excludes trade and inventory effects to focus on consumption plus investment plus government spending as a measure of the domestic economy.
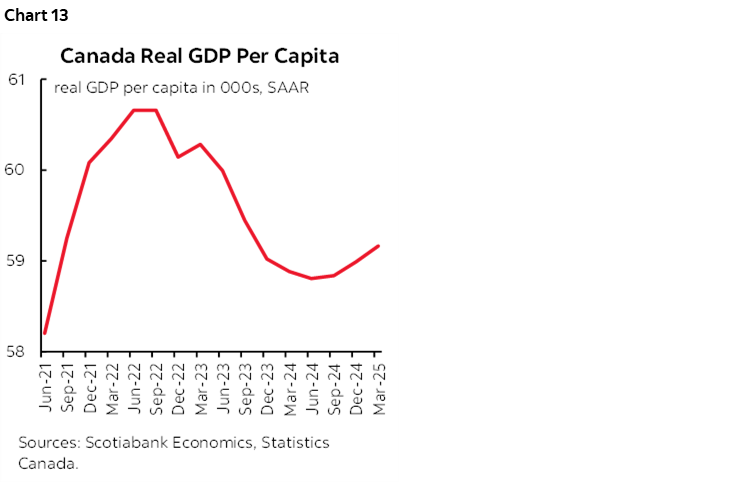
As an interesting aside, per capita GDP is perhaps carving out an unheralded bottom (chart 13). Per capita GDP had been one-part dragged lower by poor productivity, but also one part by the first-round shock effects of an immigration surge. The second-round effects are likely to see greater economic integration of this wave of immigration into the economy alongside curtailment of population growth through tightening immigration policy that has been put in place over the past 3–4 quarters. Funny, but I don’t hear the folks who were all over this measure when it was declining suddenly restoring much needed balance to their pessimism!
GLOBAL MACRO ROUND-UP
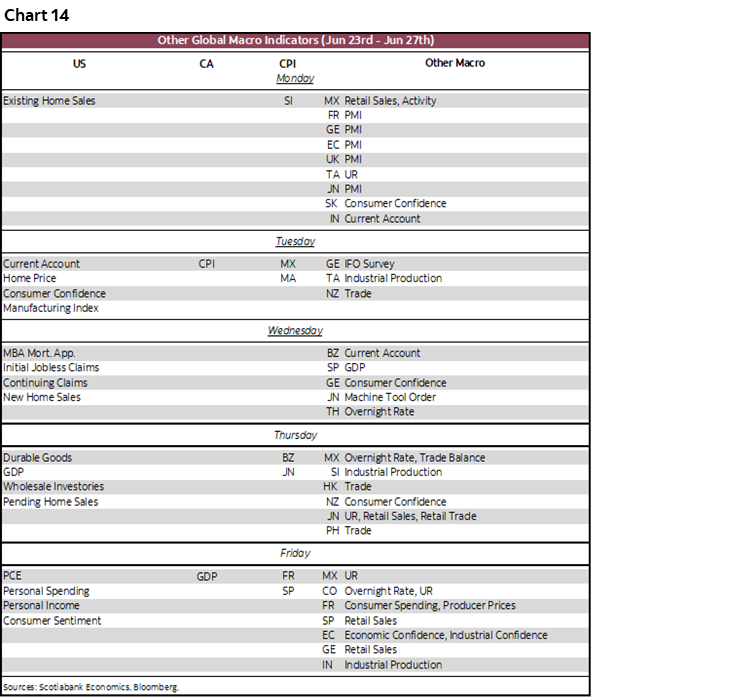
Chart 14 shows the round up of global economic indicators not already discussed. More will be written about them over the course of the week and estimates for the main US and Canadian ones are included in the indicator tables. The key readings are as follows.
Another batch of global purchasing managers indices for June arrive at the start of the week. The soft, survey-based data will inform growth in new orders, hiring intentions, prices paid, and other supply chain metrics. The readings and subcomponents plus anecdotes could inform tariff effects earlier than hard data. First up will be Australia on Sunday evening 9pmET, followed by Japan ninety minutes later, then India overnight, followed by the Eurozone and UK into the early morning hours before the N.A. market open. The US S&P PMIs arrive 15 minutes after the S&P open.
Several countries will report fresh inflation gauges.
- The US updates core PCE for May. Most expect 0.1% m/m SA, several are at 0.2%, and a couple of us are at 0.0%. Core CPI was only 0.1% m/m SA off of which my estimate knocks a generously rounded 0.1% given weighting differences between CPI and PCE and given how the pertinent categories in the producer price index translate into PCE.
- Eurozone CPI won’t arrive until July 1st after Germany and Italy refresh on June 30th, but this coming week will shape expectations when France and Spain update on Friday. Both countries are expected to see firmer price pressures across headline and core components partly as the June readings begin to bring out possible tariff effects with the same uncertainty as elsewhere.
- Was Australia’s uptick in trimmed mean CPI in April to 2.8% y/y an aberration or a small step toward a new trend into tariff wars? Australia has not offered meaningful tariff retaliation.
- Tokyo core CPI has been on a hot trend (chart 15). Watch Thursday’s update to see if that continues as one of two readings before the next BoJ policy decision on July 31st.
DISCLAIMER
This report has been prepared by Scotiabank Economics as a resource for the clients of Scotiabank. Opinions, estimates and projections contained herein are our own as of the date hereof and are subject to change without notice. The information and opinions contained herein have been compiled or arrived at from sources believed reliable but no representation or warranty, express or implied, is made as to their accuracy or completeness. Neither Scotiabank nor any of its officers, directors, partners, employees or affiliates accepts any liability whatsoever for any direct or consequential loss arising from any use of this report or its contents.
These reports are provided to you for informational purposes only. This report is not, and is not constructed as, an offer to sell or solicitation of any offer to buy any financial instrument, nor shall this report be construed as an opinion as to whether you should enter into any swap or trading strategy involving a swap or any other transaction. The information contained in this report is not intended to be, and does not constitute, a recommendation of a swap or trading strategy involving a swap within the meaning of U.S. Commodity Futures Trading Commission Regulation 23.434 and Appendix A thereto. This material is not intended to be individually tailored to your needs or characteristics and should not be viewed as a “call to action” or suggestion that you enter into a swap or trading strategy involving a swap or any other transaction. Scotiabank may engage in transactions in a manner inconsistent with the views discussed this report and may have positions, or be in the process of acquiring or disposing of positions, referred to in this report.
Scotiabank, its affiliates and any of their respective officers, directors and employees may from time to time take positions in currencies, act as managers, co-managers or underwriters of a public offering or act as principals or agents, deal in, own or act as market makers or advisors, brokers or commercial and/or investment bankers in relation to securities or related derivatives. As a result of these actions, Scotiabank may receive remuneration. All Scotiabank products and services are subject to the terms of applicable agreements and local regulations. Officers, directors and employees of Scotiabank and its affiliates may serve as directors of corporations.
Any securities discussed in this report may not be suitable for all investors. Scotiabank recommends that investors independently evaluate any issuer and security discussed in this report, and consult with any advisors they deem necessary prior to making any investment.
This report and all information, opinions and conclusions contained in it are protected by copyright. This information may not be reproduced without the prior express written consent of Scotiabank.
™ Trademark of The Bank of Nova Scotia. Used under license, where applicable.
Scotiabank, together with “Global Banking and Markets”, is a marketing name for the global corporate and investment banking and capital markets businesses of The Bank of Nova Scotia and certain of its affiliates in the countries where they operate, including; Scotiabank Europe plc; Scotiabank (Ireland) Designated Activity Company; Scotiabank Inverlat S.A., Institución de Banca Múltiple, Grupo Financiero Scotiabank Inverlat, Scotia Inverlat Casa de Bolsa, S.A. de C.V., Grupo Financiero Scotiabank Inverlat, Scotia Inverlat Derivados S.A. de C.V. – all members of the Scotiabank group and authorized users of the Scotiabank mark. The Bank of Nova Scotia is incorporated in Canada with limited liability and is authorised and regulated by the Office of the Superintendent of Financial Institutions Canada. The Bank of Nova Scotia is authorized by the UK Prudential Regulation Authority and is subject to regulation by the UK Financial Conduct Authority and limited regulation by the UK Prudential Regulation Authority. Details about the extent of The Bank of Nova Scotia's regulation by the UK Prudential Regulation Authority are available from us on request. Scotiabank Europe plc is authorized by the UK Prudential Regulation Authority and regulated by the UK Financial Conduct Authority and the UK Prudential Regulation Authority.
Scotiabank Inverlat, S.A., Scotia Inverlat Casa de Bolsa, S.A. de C.V, Grupo Financiero Scotiabank Inverlat, and Scotia Inverlat Derivados, S.A. de C.V., are each authorized and regulated by the Mexican financial authorities.
Not all products and services are offered in all jurisdictions. Services described are available in jurisdictions where permitted by law.