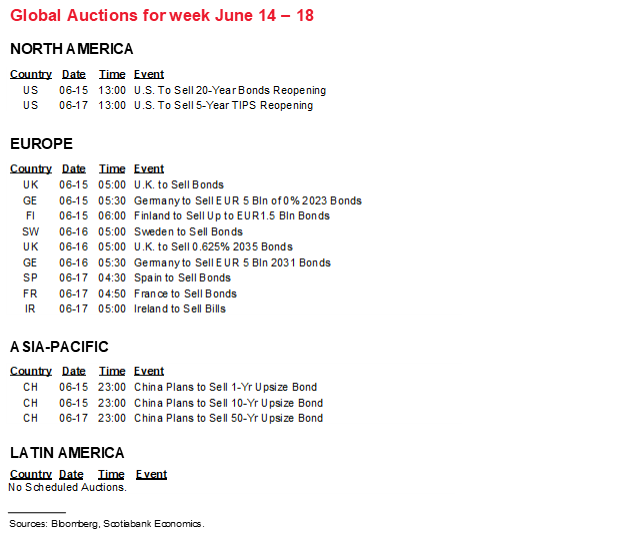
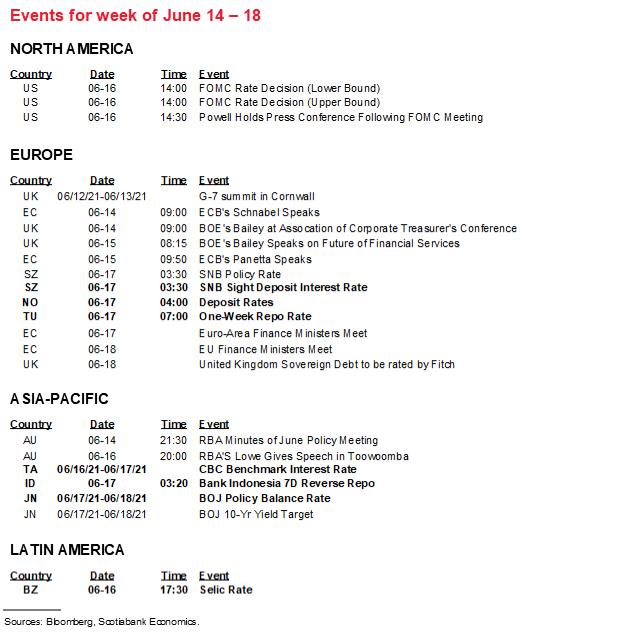
Next Week's Risk Dashboard
• FOMC Preview
• Canadian inflation
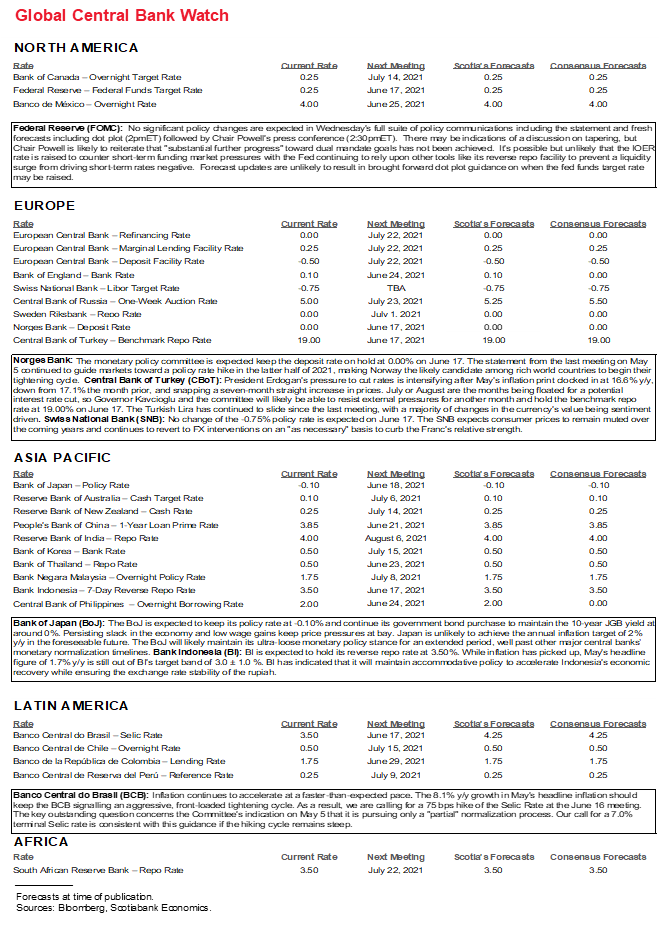
• Other CBs: BoJ, Norges, SNB…
• …Brazil, BI, CBCT, Turkey
• UK inflation
• US retail sales
• Australian jobs
Chart of the Week
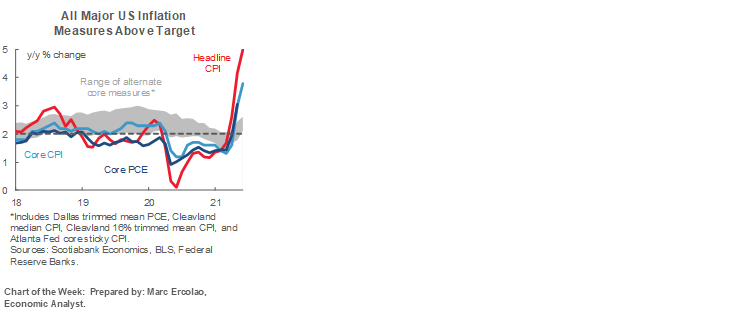
FEDERAL RESERVE—UNCLE SAM SURE MAKES LIFE DIFFICULT FOR HIMSELF
The week’s main focus is likely to be upon Wednesday’s FOMC communications. The two day meeting culminates in Wednesday’s statement and updated forecasts including a revised dot plot (2pmET) followed by Chair Powell’s press conference. I’ll focus upon three considerations.
First, will the Fed make additional changes in an effort to address downward pressure upon short-term market rates? That can’t be ruled out but it isn’t a base case risk in my opinion. Instead, we may hear Chair Powell say that the forces distorting the shorter-term rates complex are likely to be transitory and the tools they are presently using to smooth the adjustments are generally holding the fort.
A bit of background on the matter may be worth offering in that it also helps to explain at least part of why global bond yields have been under downward pressure over recent weeks and why that might not last beyond July. A major driver has been the wall of cash that has gone into the financial system and the associated policy responses.
The Debt Ceiling is the Main Culprit
Recall that the US government’s debt ceiling was suspended in August 2019 but will be reinstated on August 1st of this year. During the pandemic, the Treasury was able to run-up its debt to finance current and prospective future stimulus needs under the auspices of the CARES Act and subsequent stimulus measures, given the suspension of the ceiling. A by-product of the reinstatement of the ceiling is that it curtails the ability of the US Treasury to borrow and hence roll over the supply of t-bills that has been shrinking (chart 1). Instead, the Treasury will have to utilize cash balances by running down its General Account (TGA) at the Federal Reserve and it has been doing so in preparation for the August 1st reinstatement of the ceiling (chart 2). The peak was last July at just over US$1.8 trillion but the real run-down began from about mid-February this year onward when the account fell from US$1.6 trillion to about half that now. It could still have to fall by about another US$650B or so between now and the end of July in order to get back toward where the balance sat before the debt ceiling was suspended.
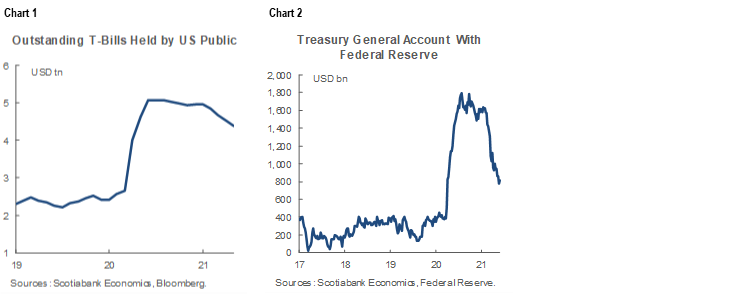
The result is a massive gusher of cash hitting the financial system, but it is a transitory factor. By the August 1st reinstatement of the debt ceiling, the process of running down the TGA account should be over. The next vulnerability could take the form of agreement to raise the debt ceiling over the second half of this year which would enable a return to borrowing and thus reverse some of the tidal wave of cash that has hit markets. Of course, the very notion of a debt ceiling is unusual across international experience and the repeated challenges it represents are often akin to Uncle Sam shooting himself in the foot.
Reinstatement of the Supplementary Leverage Ratio
The gusher of cash into the financial system from the Treasury’s General Account at the Fed has been reinforced by the Fed’s quantitative easing program that continues to buy US$120 billion of Treasuries and MBS each month. The problem these two forces represent is where to put all that money that is chasing relative scarcity in a shrinking pool of treasury bills.
Banks don’t really want it as a general observation and there have been warnings about this for quite a while now including from money centre banks. The reason is that accepting this redeployment of the Treasury’s cash through bank deposits would put banks in violation of regulatory rules. On March 19th, the Federal Reserve’s Board of Governors announced that the suspension of the Supplementary Leverage Ratio would end on March 31st. The suspension of the SLR’s inclusion of holdings of Treasury bonds and reserves was a policy response to the initial stages of the pandemic. Because Treasuries and reserves now count as assets again in the SLR, it has meant renewed upward pressure on assets relative to tier 1 Capital. Should banks respond to the gusher of cash coming back into the financial system by willingly accepting more deposits, it would risk violating the Basel III regulatory requirement because those deposits would have to be invested in assets of one form or another including, say, Treasuries. To stay within the SLR requirements, banks would either have to turn away deposits, shed other assets which may not make profitable sense or issue common equity which may be undesirably dilutive. An added constraint is the capital surcharge against global systemically important banks as another factor limiting the willingness of some banks to accept deposits.
Since banks can’t really accept such a tidal wave of deposits with regulators breathing down their necks, the flows wind up at money market funds. More money market inflows while T-bill supply shrinks has bid prices upward and yields to practically nothing. Through arbitrage, the effective fed funds rate has also fallen.
Reverse Repo Facility Changes
If left unchecked, then the gusher of cash into the financial system through the combined effects of reinstating the debt ceiling, banks having to turn away deposits and ongoing Fed buying of Treasuries and MBS to the tune of US$120B per month would have driven such a wall of cash through private markets as to push measures like the effective fed funds rate and t-bill yields durably and deeply below zero. A negative effective fed funds rate would be uncharted waters for the nature of the US financial system.
The Fed could have tried to offset such pressures by paying more for reserves held on deposit with it. Some still think this remains an option. Raising Interest on Excess Reserves from 0.1% to something higher but without altering the 0.25% upper limit of the Fed rate corridor could have held back some of this cash from the open market and, through arbitrage, limit downward pressure on other short-term rates.
But the Fed has multiple tools and opted instead to enhance its reverse repo facility whereby it sells securities into the market in exchange for withdrawing cash from the financial system as a way of soaking up excess liquidity. The purpose of the facility is to operate as a safety valve on the system by allowing excess cash to have an alternative place to park without further disrupting short-term market rates and it has definitely worked (chart 3). At the March FOMC, the Fed increased the RRP counterparty limit by US$50B to US$80B in order to increase the ability to drain cash from the system. On April 30th, the NY Fed announced changes to counterparty eligibility criteria for its reverse repo facility to increase its accessibility. Those changes increased accessibility to the facility for a broader array of counterparties.
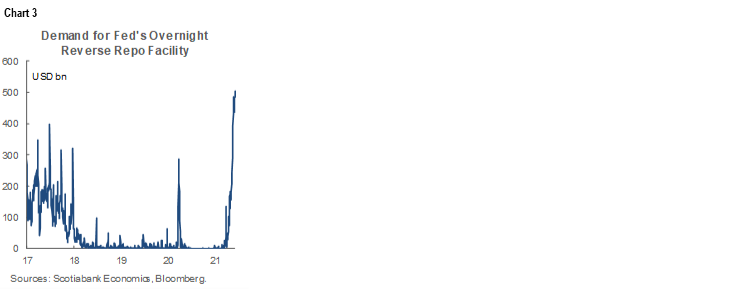
There are other tools that could be pursued such as easing the regulatory constraints on banks that are forcing them to turn away some deposits, though pressures within the administration and Congress may be difficult to overcome. The Fed could also still raise its IOER by, say, 5bps in order to pull other short-term market rates higher. So far, however, the Fed’s reverse repo facility is holding the fort and able to absorb the gusher of cash without courting negative rates.
I think that these combined forces have driven reach for yield pressures further up the yield curve and tamped down Treasury yields across maturities while also inflating other asset prices. If the debt ceiling is the prima facie culprit made worse by regs, then this should be a transitory effect after which point the gusher of cash stabilizes, maybe bill issuance picks up again if the debt ceiling is lifted and maybe the Fed transitions toward taper talk as we expect over the duration of the year. This is among the foundations behind why we continue to forecast upward pressure on, say, the US 10 year Treasury yield at 2.1% by year-end and 2.3% by the end of 2023.
Taper Talk?
A second consideration is whether Chair Powell indicates that the FOMC is “talking about talking about tapering” as he once put it. He probably can’t repeat his answer at the last press conference which was a decisive ‘no.’ That’s because we learned in the minutes to that meeting that ‘a number’ of FOMC officials did indeed wish to start getting on with the movement toward a discussion on tapering. We’ve since heard several FOMC officials either indicate that now is the time to taper, that now is the time to start talking about tapering, or that they will be watching data and developments over the next few months to inform whether we are getting closer to a taper dialogue.
For now, Chair Powell is likely to say that there are varying opinions across the FOMC but that the criteria of ‘substantial further progress’ toward the Fed’s dual mandate policy goals is not yet being met given the number of unemployed Americans.
For a long time now, we’ve expected the Fed to implement tapered bond purchases at the January 2022 meeting after announcing the policy shift at the December 2021 meeting. Opening up the discussion by late summer perhaps at either Jackson Hole in late August or at the September meeting would be compatible with guidance they will communicate their intentions well in advance. This view requires further progress on jobs and vaccinations.
Forecasts and Dots
The final consideration is that FOMC participants will refresh forecasts they last offered in March. A lot has happened since then including about 200 million extra vaccine doses administered (presently ~306 million) and the outlining of proposals for new fiscal stimulus including the American Jobs Plan and the American Families Plan that are still marked by high uncertainty around the negotiations.
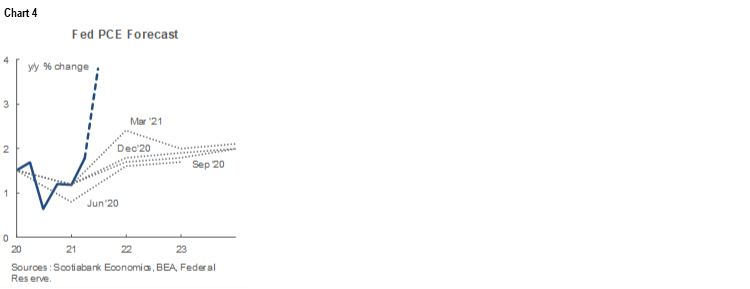
They might revise upward 2021 growth from 6.5% y/y (we have 7.7%) and perhaps add a touch to inflation projections given greater evidence of supply chain and other pressures since the March meeting. Like the argument in the Canadian section below, the Fed is overstating the role of base effects in driving inflation higher in the US. While the FOMC was submitting forecasts through last year and early this year, it knew in real time what the base effects were and yet the committee lowballed their inflation forecasts compared to present reality (chart 4). The chart plots actual inflation alongside dotted lines for the forecasts at each point in the pandemic. That indicates that higher inflation is not just a function of base effects from a year ago but also greater-than-anticipated price resilience and pressure with each evolving month than FOMC officials had feared. To say bah, we knew that would happen all along is a grand overstatement by the Fed. We simply did not get the deflationary or sharply disinflationary outcome that was feared when gigantic monetary and fiscal policy stimulus measures were put in place. An offsetting risk might be if they show less conviction in the decline in the unemployment rate given ongoing supply side challenges.
The median dot that signals when the committee consensus thinks the policy rate could begin to gravitate higher is unlikely to change. There were only four out of eighteen officials who saw a hike in 2022 at the March meeting and even if that changes it’s highly unlikely that six more would join them. It’s probably also unlikely but not impossible at this point that the median dot for a continued rate hold in 2023 will change; in March, 11 of 18 thought the policy rate would be unchanged in 2023. It’s unlikely that three more would join the seven anticipating hikes before Chair Powell embraces a taper dialogue.
CANADA—HERE TOO, IT’S NOT JUST ABOUT THE BASE
Canada updates CPI inflation for May on Wednesday. It’s with only modest confidence that I went with an estimate that is little changed in May versus April at 3.5% y/y (from 3.4%). Month-over-month seasonally unadjusted CPI is forecast at +0.4% while seasonally adjusted is estimated to land around 0.2–0.3% m/m after rising by 0.6% m/m in April. It may be that Canada faces a supply-chain-driven risk toward faster price gains similar to the US that has registered consecutively large gains, but that was in a reopening economy versus Canada’s economy that remained under lockdown measures for a second month in May.
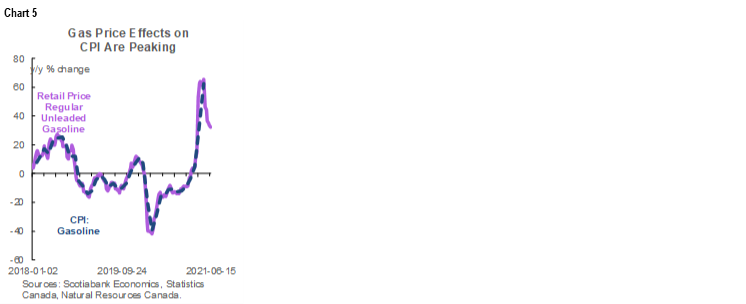
The drivers of this headline estimate include less pressure from year-ago base effects that alone would drop the rate from 3.4% in April to 3.1% y/y in May. Gasoline prices probably won’t add much in weighted terms to the month-over-month change in CPI and the base effects on year-over-year inflation are in the early stages of waning with what we’ve already observed for retail pump prices in May and June (chart 5). May is usually a seasonal up-month for prices in a “normal” year with, for example, core and headline both up by an average of 0.3% m/m in May over the five years prior to the pandemic. A typical degree of seasonality would lift the year-over-year rate back up to 3.5%. The wild card remains supply chain effects as just observed once again in the US.
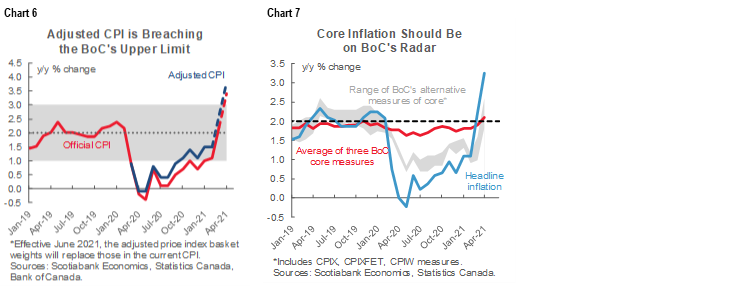
Remember to also add to the official reported figure. Recall that when Statistics Canada replaces current CPI measures by using pandemic-era spending weights in July for June CPI we’ll likely be tracking around a half percentage point higher on the year-over-year rate based on StatsCan’s tracking of the effects of using pandemic-era spending weights to date versus pre-pandemic spending weights (chart 6). All measures of core inflation—some more driven by base effects than others—have also accelerated (chart 7).
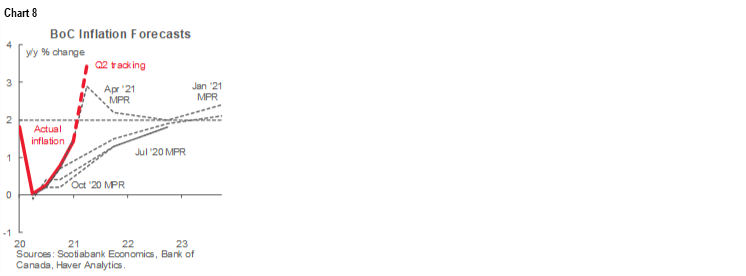
In a grander sense, however, we can’t just pin the rise in headline inflation on year-ago base effects as that misses two other relative contributions. The first and most important is that prices each month have been much firmer than expected during the recovery to date. Enter chart 8 that shows the pattern of actual headline inflation versus the Bank of Canada’s forecasts for where inflation would land over its forecast horizon as drawn from Monetary Policy Reports throughout the pandemic but starting only in June of last year since the BoC boycotted forecasting at the start of the pandemic. If base effects were the only—or dominant—driver behind rising inflation and the BoC knew those base effects in real time by observing price levels last Spring through Fall, then how come it didn’t forecast the rise in inflation to present? They knew the starting point for prices in the year-over-year comps with certainty and yet their forecasts for inflation have been sharply exceeded by actual inflation to date.
The answer lies in the fact that relative to fears at the start of the pandemic, Canada did not experience deflation or deep disinflation. Instead, price levels each month proved to be a lot more resilient than feared. When this point is combined with base effects it explains much of the overall run-up in inflation, but it’s misleading to argue that the only reason inflation has accelerated is due to base effects.
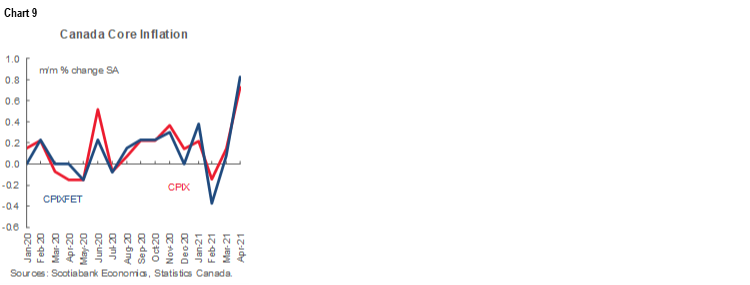
The added contribution is the month-over-month pace of increases in seasonally adjusted prices. Chart 9 shows the acceleration in various measures of core prices that, among other things, remove emphasis upon rising gasoline prices.
As a last main point for now, the “transitory” camp seems to be cherry-picking the data in both the US and Canada. This point was made on the latest US CPI reading (here). They are only considering what may be transitory upsides to inflation while neglecting legitimate points on how some of the weakest categories may be only temporarily weak. For example, has food price inflation really gone away at just 0.9% y/y in Canada and with US food-at-home up by just 0.7% y/y? Or is that form of inflation soft now because of high base effects of a year-ago due to pandemic hording, and are longer-term secular forces behind expanding world population, income growth, environmental shocks and supply chain challenges still likely to drive rising food prices? What about medical care commodity and medical care services prices in US CPI that are presently flat in year-over-year terms; will secular forces toward more expensive treatments and technological innovation go away as drivers of higher price pressures? Or take overall services prices by contrast to the fact that almost all the accelerated inflation during the pandemic so far has been driven by goods prices with reopening effects still ahead for services. Categories like travel services, vegetables, communications, local and commuter transit, rented accommodations among others could well be subject to upside pressure over the cycle ahead as economies hopefully continue to normalize.
Perhaps the deal clincher here is that if the BoC really thinks inflation is driven by transitory forces, then by corollary presently distorted base effects into the year ahead might cause inflation to crash in the absence of other influences. Their forecasts don’t reveal such a bias with inflation forecast to average just above the 2% target throughout 2021–23.
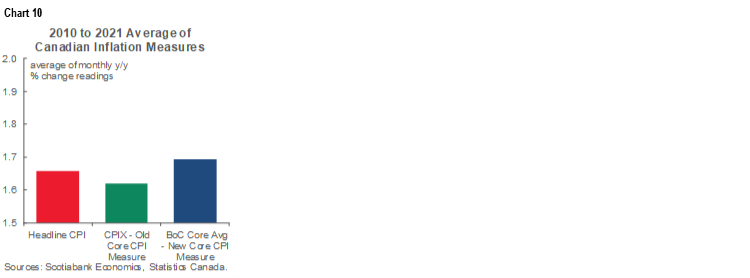
In any event, as a reminder of how difficult it remains to forecast and target inflation, recall chart 10 that shows inflation persistently below the BoC’s target 94% of the time across individual months since 2010 on an average core basis and two-thirds of the time on a headline basis. The BoC’s inflation targeting success since going down that path in the early 1990s has more recently stumbled along with the experiences of other major central banks. The fact they tend to downplay or dismiss this is perhaps a signal they have no desire to follow what the Fed did in revising its strategic framework last August.
THE REST!
More will be offered on the rest of the week’s developments in daily notes over the coming week. Highlights are offered below.
Seven other central banks that are not named the Federal Reserve will also weigh in with updated policy decisions. All of them will do so over the back half of the week.
- Brazil goes first with another expected 75bps hike on Wednesday and set against the backdrop of faster-than-expected inflation. Then we get a clustering of other central banks.
- Bank Indonesia is forecast to stay on hold at 3.5% as a soft economy and below-target inflation are nevertheless set against concerns regarding rupiah volatility and capital account flows.
- The Central Bank of China Taiwan is expected to hold at 1.125%
- The Bank of Japan ends the week with the expectation it will leave all policy variables intact but perhaps extend support programs that are otherwise scheduled to expire in September. It could delay this decision to the mid-July meeting before taking August off.
- Norges Bank’s refreshed guidance on Thursday will be closely watched in order to see if a recent downside surprise in inflation alters guidance that rate hikes will commence “in the latter half of 2021.” Moving at the August meeting is unlikely, but any of the September, November or December meetings are candidates for a first hike.
- The Swiss National Bank (Thursday) has backed off some of its earlier talk of franc intervention and the recent relative stability in the Swiss franc to the dollar over the past month is unlikely to change that.
- Turkey’s central bank is likely to hold at a lofty 19% on Thursday. Political pressure toward cutting the policy rate may build further over coming meetings.
The main US economic indicator will be Tuesday’s retail sales during May. Total sales may dip by around -½% m/m while sales ex-autos post a mild gain of a comparable magnitude. Vehicle sales carry about a one-fifth weight and should drag on the headline given we know that new vehicle sales were down 8.2% m/m in May partly due to chip shortages while auto prices in CPI were up by 1.6% m/m. Higher prices may guard against some further downside risk as gasoline prices were up 4.6% m/m with about a 7% weight, while broader CPI increased by 0.6% m/m and core CPI was up by 0.7%. The other ~70% of retail sales that are not made up of gas and new vehicle sales could be more resilient on reopening effects.
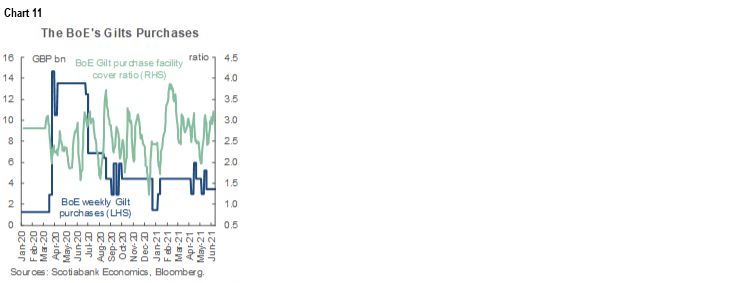
UK inflation may come under further upward pressure when May’s reading arrives on Wednesday. Core CPI is likely to rise a couple more tenths toward 1 ½% y/y with headline running at about 1 ¾% y/y. May’s retail sales (Friday) may add to the gains in April on further reopening effects. As the economy reopens and inflation gradually moves closer to target, the Bank of England tapered its weekly gilts purchase rate to £3.44 billion at the May meeting (chart 11) while retaining the guidance that the total size of the purchase program would remain at £875 billion once purchases are completed “around” year-end.
Australia updates jobs for May at mid-week. The prior month’s drop of about 31k is expected to rebound from the policy-induced decline. The Australian government’s Job Keeper wage subsidy program ended in March and likely sparked the shedding of payroll positions.
China’s retail sales and industrial production during May (Wednesday) could further inform momentum concerns in China’s economy.
Most expect Wednesday’s Q1 GDP report from New Zealand to indicate a rebound from the 1% q/q non-annualized drop in Q4. Most estimates range from 0.4–0.9%.
India’s CPI inflation rate for May is expected to spike higher on Monday and further breach the mid-point of the Reserve Bank of India’s 4% +/-2% inflation target range by stretching above 5%. With the COVID-19 case surge and risks to growth, the RBI has been talking through the rise in inflationary pressure that is partly distorted.
Latin American markets face light calendar-based risk with just Argentina’s inflation during May (Wednesday) and Colombia’s retail sales and industrial output during April (Tuesday).
DISCLAIMER
This report has been prepared by Scotiabank Economics as a resource for the clients of Scotiabank. Opinions, estimates and projections contained herein are our own as of the date hereof and are subject to change without notice. The information and opinions contained herein have been compiled or arrived at from sources believed reliable but no representation or warranty, express or implied, is made as to their accuracy or completeness. Neither Scotiabank nor any of its officers, directors, partners, employees or affiliates accepts any liability whatsoever for any direct or consequential loss arising from any use of this report or its contents.
These reports are provided to you for informational purposes only. This report is not, and is not constructed as, an offer to sell or solicitation of any offer to buy any financial instrument, nor shall this report be construed as an opinion as to whether you should enter into any swap or trading strategy involving a swap or any other transaction. The information contained in this report is not intended to be, and does not constitute, a recommendation of a swap or trading strategy involving a swap within the meaning of U.S. Commodity Futures Trading Commission Regulation 23.434 and Appendix A thereto. This material is not intended to be individually tailored to your needs or characteristics and should not be viewed as a “call to action” or suggestion that you enter into a swap or trading strategy involving a swap or any other transaction. Scotiabank may engage in transactions in a manner inconsistent with the views discussed this report and may have positions, or be in the process of acquiring or disposing of positions, referred to in this report.
Scotiabank, its affiliates and any of their respective officers, directors and employees may from time to time take positions in currencies, act as managers, co-managers or underwriters of a public offering or act as principals or agents, deal in, own or act as market makers or advisors, brokers or commercial and/or investment bankers in relation to securities or related derivatives. As a result of these actions, Scotiabank may receive remuneration. All Scotiabank products and services are subject to the terms of applicable agreements and local regulations. Officers, directors and employees of Scotiabank and its affiliates may serve as directors of corporations.
Any securities discussed in this report may not be suitable for all investors. Scotiabank recommends that investors independently evaluate any issuer and security discussed in this report, and consult with any advisors they deem necessary prior to making any investment.
This report and all information, opinions and conclusions contained in it are protected by copyright. This information may not be reproduced without the prior express written consent of Scotiabank.
™ Trademark of The Bank of Nova Scotia. Used under license, where applicable.
Scotiabank, together with “Global Banking and Markets”, is a marketing name for the global corporate and investment banking and capital markets businesses of The Bank of Nova Scotia and certain of its affiliates in the countries where they operate, including; Scotiabank Europe plc; Scotiabank (Ireland) Designated Activity Company; Scotiabank Inverlat S.A., Institución de Banca Múltiple, Grupo Financiero Scotiabank Inverlat, Scotia Inverlat Casa de Bolsa, S.A. de C.V., Grupo Financiero Scotiabank Inverlat, Scotia Inverlat Derivados S.A. de C.V. – all members of the Scotiabank group and authorized users of the Scotiabank mark. The Bank of Nova Scotia is incorporated in Canada with limited liability and is authorised and regulated by the Office of the Superintendent of Financial Institutions Canada. The Bank of Nova Scotia is authorized by the UK Prudential Regulation Authority and is subject to regulation by the UK Financial Conduct Authority and limited regulation by the UK Prudential Regulation Authority. Details about the extent of The Bank of Nova Scotia's regulation by the UK Prudential Regulation Authority are available from us on request. Scotiabank Europe plc is authorized by the UK Prudential Regulation Authority and regulated by the UK Financial Conduct Authority and the UK Prudential Regulation Authority.
Scotiabank Inverlat, S.A., Scotia Inverlat Casa de Bolsa, S.A. de C.V, Grupo Financiero Scotiabank Inverlat, and Scotia Inverlat Derivados, S.A. de C.V., are each authorized and regulated by the Mexican financial authorities.
Not all products and services are offered in all jurisdictions. Services described are available in jurisdictions where permitted by law.