Next Week's Risk Dashboard
- Inflation updates to pit “Too Late” against “Too Early”
- US CPI: could this be the start of pass-through pressures?
- Canadian core inflation’s firm trend enters tariff uncertainties
- Why the BoC is likely to extend its policy hold
- Chair Powell’s response to Vought and the grey area around ‘for cause’
- US Q2 earnings season begins in earnest…
- …and could inform tariff debates
- China to provide damage assessments of early tariff effects
- US also updates retail sales, industrial output, consumer sentiment
- Will Aussie jobs restore momentum?
- UK CPI, jobs and wages unlikely to sway the BoE from its gradual easing path
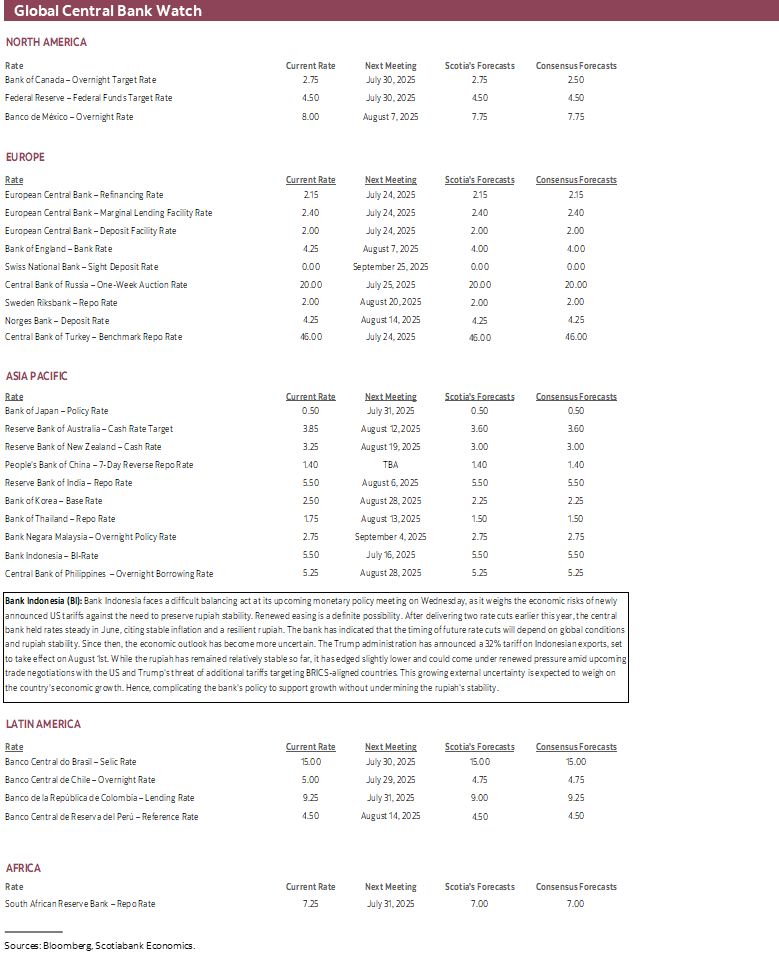
- Bank Indonesia to trade off tariff threat versus rupiah stability
- Indian CPI the last reading before the RBI’s next decision
Chart of the Week
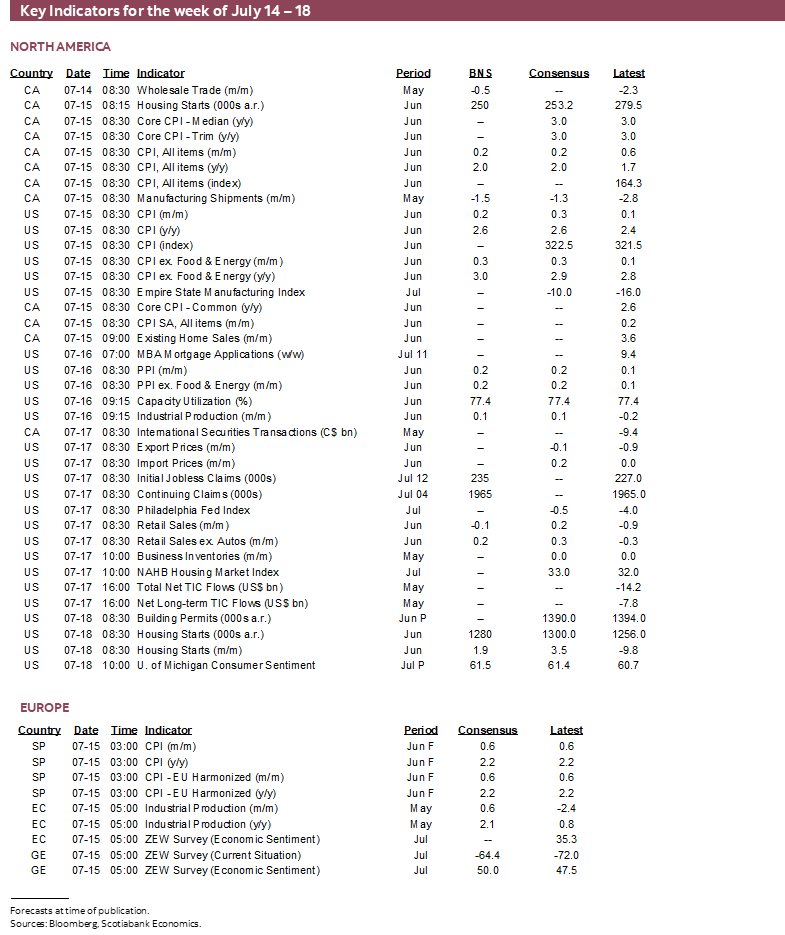
A key week for macro and earnings risk lies ahead. The US earnings season begins in earnest and what it reveals could be pertinent to macro debates like tariff pass through.
The US and Canada release CPI readings at the same time on Tuesday before their respective central banks issue policy decisions on the same day about two weeks later. What US CPI may or may not reveal about tariff pressures on inflation will pit “Too Late” against “Too Early” in a battle to be continued over subsequent readings.
Canada’s figures will be one of two reports Governor Macklem has emphasized before the next decision. They are likely to be less influential given recent events that include a blow-out jobs report (recap here) and renewed tariff threats (recapped here). The BoC could well continue to avoid producing a base case projection at its July 30th meeting for the same reason it relied on just scenarios in April’s forecasts: a lack of any confidence around how trade and fiscal policies may evolve and their high importance to the outlook.
Also keep a close eye on political developments surrounding Federal Reserve Chair Powell’s required response to the Trump administration’s allegations and the grey area that surrounds the issue of dismissing the Chair with cause as opposed to a difference of opinion.
A whole wave of global macro readings will also pepper the market landscape. Beyond CPI, the US will also refresh key readings like retail sales and industrial output. China updates GDP and higher frequency gauges to help assess tariff damage. UK reports on jobs and inflation, Australian jobs, Indian CPI and one central bank decision (Bank Indonesia) will round out a full calendar.
Off-calendar market risk is likely to include ongoing trade policy tensions such as the prospect of an outlined agreement between the US and EU, while the path toward a potential Canada-US agreement has been pushed out from July 21st to August 1st.
US CPI—COULD THIS BE THE ONE?
By Wednesday, we’ll have enough information to assess how the Federal Reserve’s preferred inflation metrics—PCE and core PCE—are likely to perform despite the fact the official readings will be reported the day after the FOMC’s next decision on July 30th. That’s because CPI lands on Tuesday followed by the next day’s release of the producer price index for June. Several PPI components are used as input into PCE. CPI translates into PCE with different weights and methodologies.
CPI is estimated to have risen by 0.2% m/m SA, or 2.6% y/y (from 2.4%). Core CPI ex-food and energy is estimated to have risen by 0.3% m/m, or 3% y/y (from 2.8%). The Cleveland Fed’s nowcast is on the fence between 0.2–0.3% m/m for headline CPI and at 0.2% for core CPI but rests heavily upon a handful of measures like energy prices.
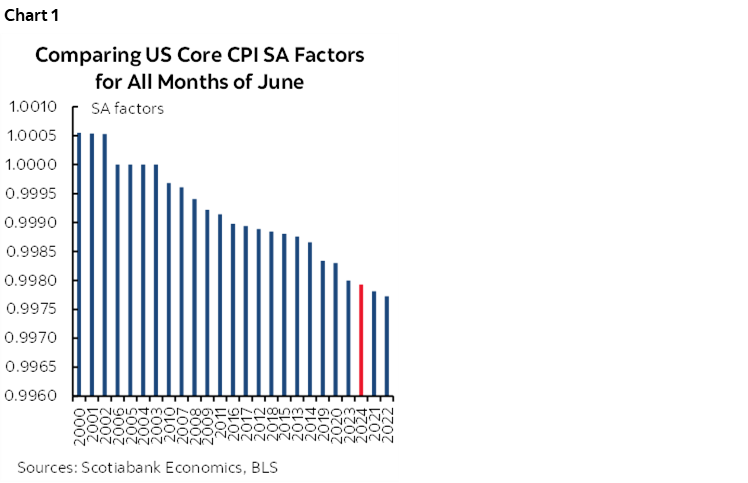
Before turning to tariffs, other drivers might suggest a soft set of prints will be offered. For one thing, seasonal adjustment factors for core CPI have been low in June during recent years (chart 1) which reflects a recency bias in how they are calculated and which biases the figures to the downside.
Among the other drivers are expected to be muted influences from gasoline and food prices. Small gains in industry-reported new and used vehicle prices are also unlikely to have a material weighted influence. Trend pressures on shelter, rent and owners’ equivalent rent are expected but amid uncertainty over when weakening market rents will work through the CPI measures (chart 2). Less discounting in clothing prices is feasible after a couple of soft months and slow start to Spring and Summer in parts of the country. More difficult to estimate are core services prices ex housing and energy services. They’ve been running softly of late.

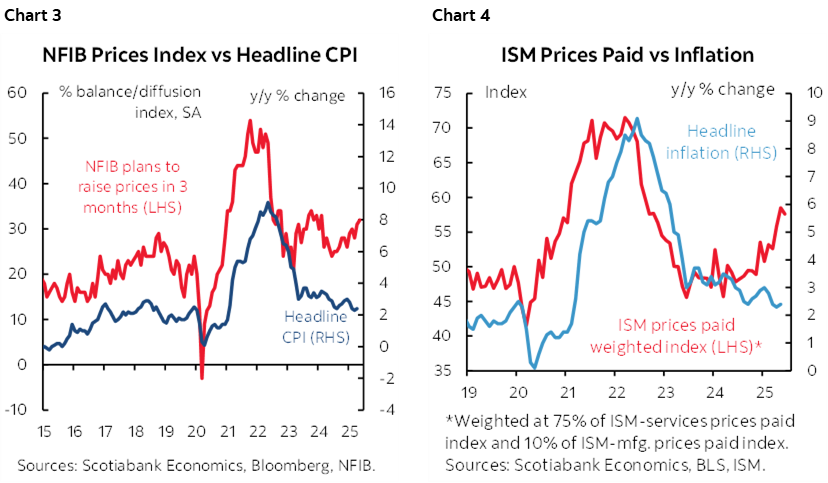
Two forms of soft, survey-based data suggest that prices might be about to spike if not in this report, then soon. The NFIB’s measure of plans by small businesses to raise prices has been on a renewed upswing and can lead changes in CPI inflation (chart 3). The ISM readings for price pressures indicate something similar could be coming (chart 4). The lags between when the NFIB and ISM measures point to rising y/y inflation merit patience over haste.
At least some of rise in these soft data guides could be indicative of tariff pressures, but there is a gap between what businesses say and when consumers may feel the pain of rising prices. That gap could be due to allowing profit margins to erode either sustainably or temporarily, selling down prior inventories that were stockpiled at pre-tariff prices, and smoothing pricing models if tariffs are viewed as a temporary shock.
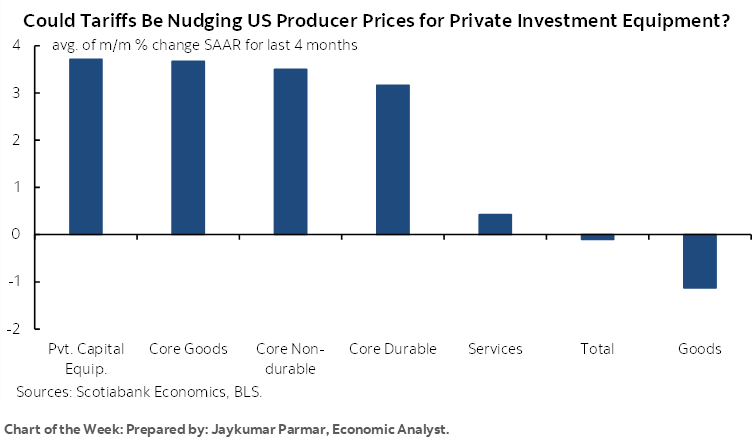
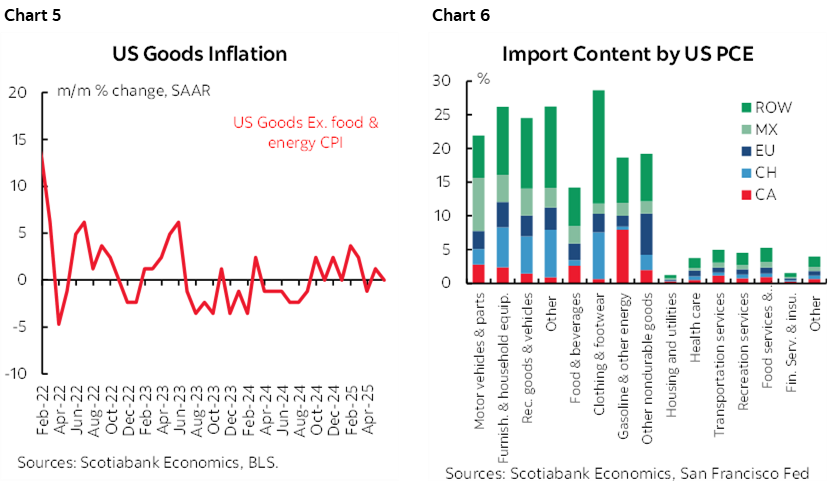
The category called ‘commodities excluding food and energy’ is where to look for signs of tariff pressures on prices mixed in with other influences. To date, this category has been running at a relatively soft pace (chart 5). Chart 6 emphasizes parts of the inflation picture—using PCE categories—that are especially vulnerable to tariff pressures because of high import content.
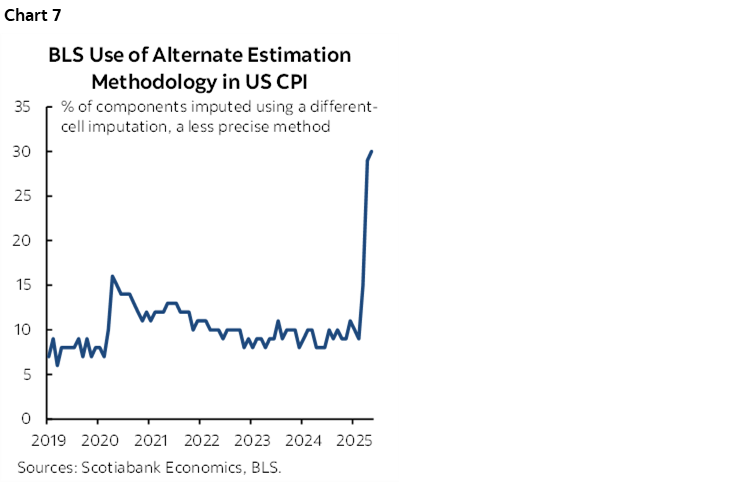
If that’s not enough to consider, then questions surrounding data quality may cast a cloud over the report once more. For two months now, the BLS has used alternative methods to estimate about 30% of the CPI basket (chart 7). Budget cuts to the agency have meant relying more upon prices of comparable goods and from other regions within the US in the absence of more data. This share of the basket is twice as high as anything in the depths of the pandemic when agents couldn’t be sent out into the field. It raises serious questions around the quality of the data as the Trump administration debases institutions including data collection agencies.
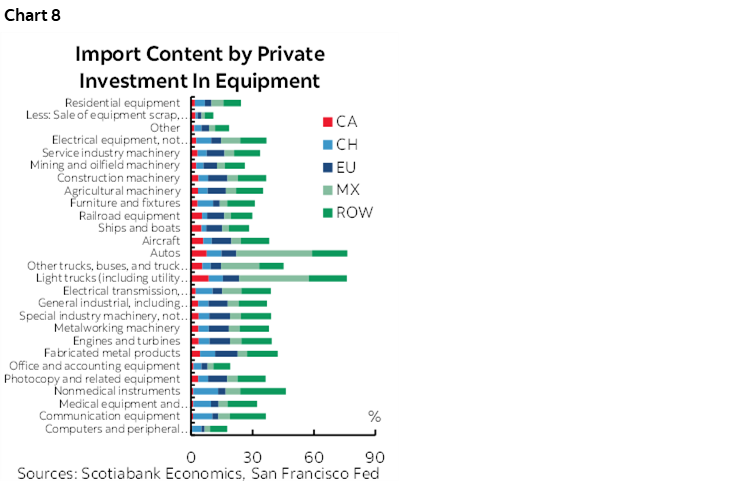
As for Wednesday’s PPI report, increases of 0.2% m/m are expected for both total producer prices and PPI excluding food and energy. Here is where there may be more immediate signs of tariff-induced price pressures in the business market, but recall that the PPI categories that flow into PCE wouldn’t reflect such pressures. Those categories include air transportation, portfolio management and investment services, outpatient services in the health care sector, and hospital and nursing home services. Where there may be indirect spillover effects of tariffs into PPI categories could be because of passing along the higher costs of imported investment goods that have relatively high import content (chart 8).
CANADIAN CPI—SHORT OF BEING TARIFFIC?
CPI for June will be updated on Tuesday. This is one of two reports before the BoC’s next decision on July 30th. Governor Macklem has emphasized the importance of this pair of readings, while nevertheless also indicating unease toward persistent pressures on core inflation and need for patience.
A seasonally unadjusted gain of 0.2% m/m that translates into 0.3% m/m SA is estimated. Combined with year-ago base effects this would translate into a rise of 2.0% y/y from 1.7% the previous month.
June is normally a seasonal up-month for prices and I’ve gone with a conservative estimate of seasonal influences. Gasoline prices shouldn’t be a material effect this time. The same goes for food. Shelter may be an upside risk as it was weighed down in April and May by the pass through of the elimination of the consumer portion of the carbon tax and provincial measures into home energy costs. Also monitor potential upside risk from travel related categories such as airfare.
Key, however, will be the BoC’s preferred core gauges. The measures that matter are the month-over-month seasonally adjusted changes in trimmed mean CPI and weighted median CPI. The former strips out the top and bottom 20% of the CPI basket after ranking weighted contributions by component from highest to lowest and recalibrating what’s left, while the latter measures the change in the price at the 50th percentile of the CPI basket ranked in similar fashion. Looking at it in m/m terms reveals price pressures at the margin. The year-over-year measures for trimmed mean and weighted median CPI are less useful because they are calculated as compounded and weighted m/m changes over twelve individual months and hence can be very slow to turn as a lagging indicator.
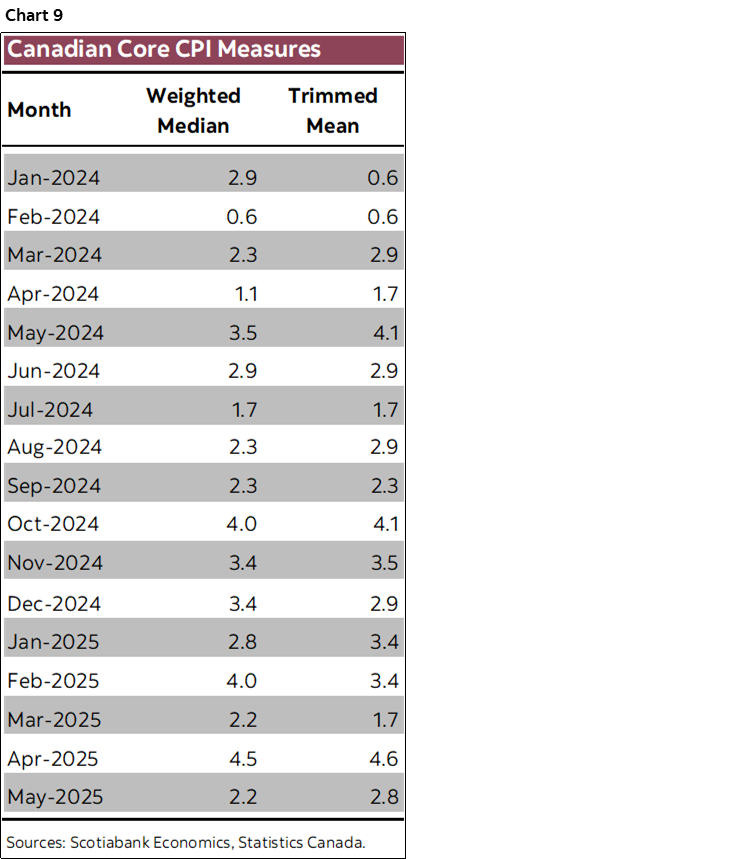
These gauges are impossible to predict given a paucity of high frequency data on the dozens of components and the high sensitivities to their weighted effects. With that caution in mind, I wouldn’t be the least bit surprised to see them fall back down to earther after 4½% m/m SAAR readings by both in May and in light of the oscillating pattern over the months while nevertheless being hot throughout the past year-and-a-half (chart 9).
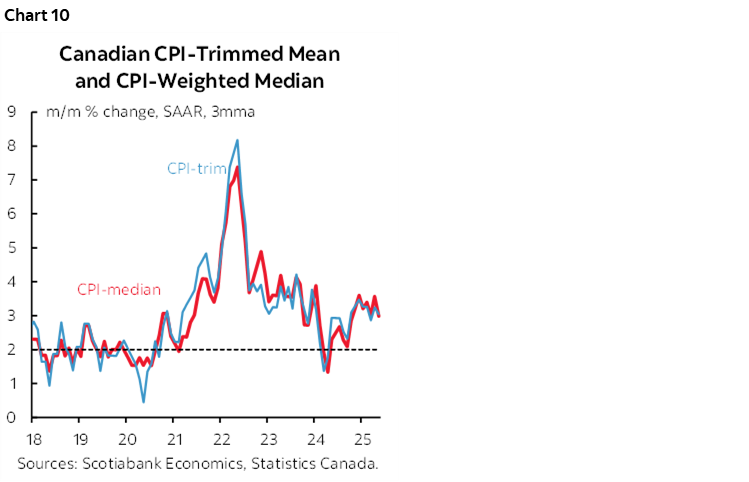
What will therefore matter will be the averaged trend, shown as a three-month moving average in chart 10. It remains far too warm for the BoC to be contemplating easing as inflation risk has yet to have been licked into forward-looking risks to supply chains.
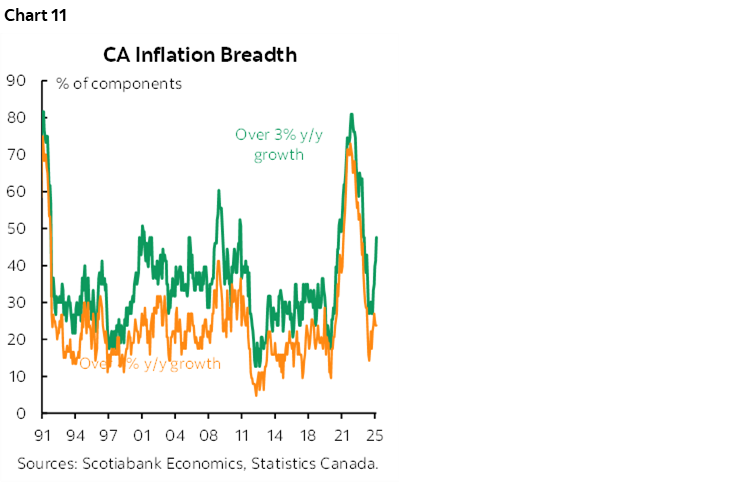
What will also matter will be evidence on the breadth of price increases which has been on the rise (chart 11).
As for tariffs, these core gauges exclude the direct effects of changes in all indirect taxes like property taxes, sales taxes and tariffs. They cannot, however, exclude any indirect effects and that’s the part that reflects incidence effects and adds another layer of risk into the report.
Enter the limited research on the topic in an applied Canadian context to buttress survey-based evidence on what businesses expect to happen to prices (chart 12). This recent piece from the BoC’s economists used micro data sets drawn from the 2018 tariff experience and concluded the average tariff pass through in 2018 was about 60% after six quarters for the tariffed representative products. Pass through for groceries was estimated to be around 70% and for durable goods (autos, appliances etc) to be around 50% and 60% for semi-durable and non-durable goods.

Such pass-through evidence could make for a meaningful impact upon CPI notwithstanding the small share of the basket that is affected by Canada’s retaliatory tariffs on C$90 billion of imports of consumer and business goods.
While pass through is relatively quick in their judgement, it’s a bit of a mystery as to why Governor Macklem would place such emphasis upon two CPI reports before the July 30th decision when the BoC’s staff research shows the effects are spread over multiple quarters. In fairness, he has also said “past experience suggests pass-through of about 75% of the costs of tariffs over roughly a year and a half” which reflects BoC staff research. As noted here, however, why emphasize two CPI reports while also talking about effects expected to evolve over six quarters?
The added complexity is that the longer the tariffs remain in place and the higher the rates, the greater the damage to the supply and demand sides of the economy. Because the US tariffs on Canada are a bigger deal than Canada’s retaliatory tariffs, the net effect is likely to create more slack. The impact of more slack on inflation is also likely to be a long and drawn out affair spread over 1–2 years. Thus, the competing effects of tariffs on Canadian inflation require vastly more than two lousy months of data to assess. In turn, this means that pre-emptively adjusting policy now could prove to be a mistake.
There could be several explanations for why pass through evolves gradually over time. One is that businesses may be hesitant to immediately raise prices in the hope that tariffs ultimately disappear or become materially lower. Why bother revising pricing plans and supply chains while putting off your customers if you think it’s all just bluster. They could allow profit margins to absorb the initial effects but pass through could become more likely over time under increasing shareholder pressure. Inventory ordered months ago may still be working through consumer spending such that tariff effects could take many months to show up.
A distinguishing feature of today’s tariff wars, however, is that there may be added supply chain turmoil imported into Canada such that only relying upon estimates of pass through of tariffs imposed by Canada on its imports would be incomplete. The US has imposed a massive tariff shock upon its own imports and tightly integrated North American supply chains may feed spillover effects into Canada. By contrast, any evidence of dumping by other countries into Canada in an effort to seek some relief from US tariffs may be offsetting by an uncertain amount.
This piece from Statistics Canada offers further insights into how Canadian businesses are dealing with tariffs.
In short, it’s next to impossible to estimate a tariff effect on this coming week’s CPI data, or the next month’s data, and very possibly further out than that. Data and the passage of time will guide the matter and the BoC should be very careful especially given renewed volatility in US trade policy.
US EARNINGS SEASON—SUSPENDED ANIMATION
The Q2 earnings season begins in earnest this week. About forty S&P500 firms release results and perhaps guidance with the latter depending on the firm.
Recall that dozens of US companies suspended guidance during the last earnings season because of uncertainty surrounding the impact of US trade policies. A key uncertainty is how many will continue to suspend guidance or how much faith markets may have in whatever guidance is provided amid the elevated uncertainty.
BlackRock, JP Morgan Chase, BoNYM, Citigroup, Wells Fargo, State Street, Bank of America, Goldman Sachs, Morgan Stanley, GE, United Airlines, Netflix, and Amex are among the key names.
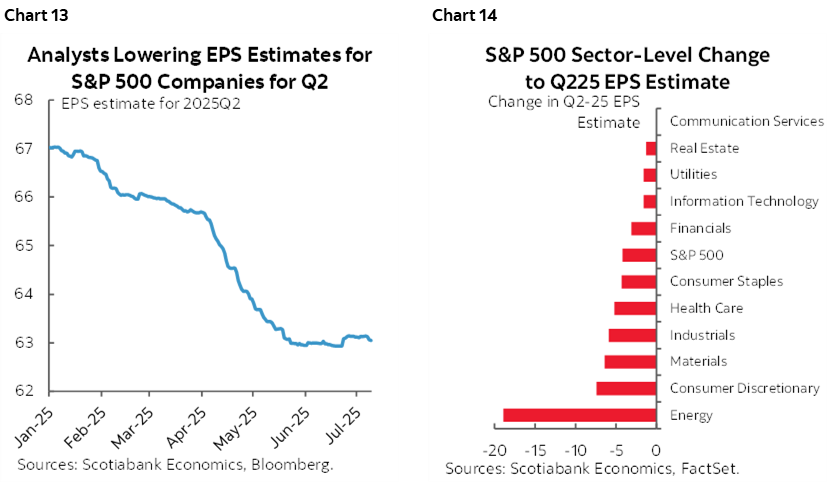
Key will be results relative to expectations that have been ratcheted lower over time (chart 13) especially for energy and consumer discretionary stocks (chart 14).
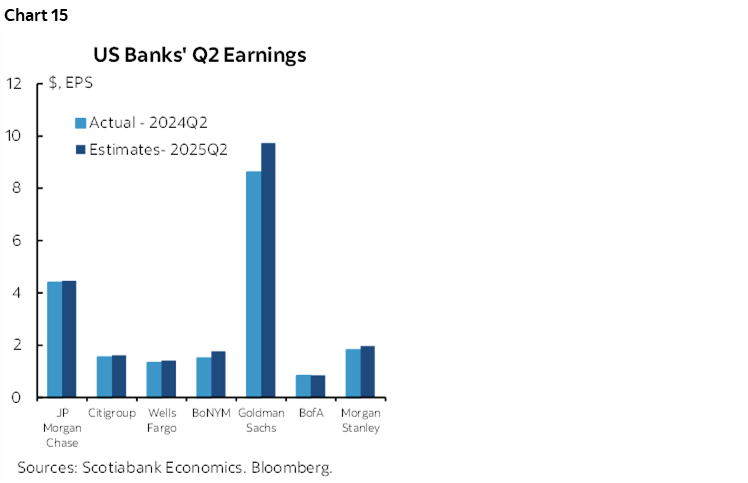
As for banks, chart 15 depicts analysts’ expectations relative to the same seasonally unadjusted quarter last year. There may also be references to estimates of the impact of regulatory changes on bank capital and balance sheets including changes to Supplementary Leverage Ratios and e-SLR changes for larger Global Systemically Important Banks (GSIBs) that are the largest of the banks.
Keep an eye on profit margins as well. One theory is that tariffs may not initially pass through to inflation if relatively high profit margins are allowed to erode at least for a time (chart 16).

DEFENDING THE FED
I’ve certainly had issues with the Federal Reserve’s mismanagement of inflation risk coming out of the pandemic and was among the first to argue they were underestimating inflation and would have to rapidly catch up with aggressive tightening as a result of not having acted sooner.
Yet I’d draw the line at what’s happening in Washington now. I’d still take an error prone independent central bank in a highly uncertain environment over a thoroughly politicized one operating at the behest of what fancies the administration.
Enter recent disturbing developments. President Trump’s attacks on Chair Powell—a Republican, first appointed to Chair by Trump in 2018 and reappointed by Biden in 2022—were escalated by OMB Director Russ Vought’s letter to Powell demanding further explanation of the Fed’s renovations and potential inconsistencies in Powell’s remarks on the topic before the Senate Banking Committee on June 25th. Vought—on behalf of Trump—has demanded a response by Thursday July 17th.
Vought is a Trump acolyte and so the temptation is to downplay this, especially in relation to costly White House renovations. Yet the grey area here is whether Powell can be fired for cause due to malfeasance or inefficient management. The other grey area is whether Trump would gamble such a thing, given the likely market turmoil that could involve wholesale selling of US financial instruments. Yet another grey area is whether Powell would step down or resign as Chair but linger on the Board. Trump recently reaffirmed that he would not fire Powell, which could make Vought’s letter purely a political tactic.
But I don’t like this turn of events. It’s no longer just about a difference of opinion (to be charitable) or the vested interests of a President who needs the Fed to bail out the consequences of the administration’s other policies (to be less charitable).
The Federal Reserve Act allows for firing the Chair for cause, but then yet another grey area is to define cause, and to prove that Powell had intent and was directly involved in any material grievances. That could beget a legal challenge before the Supreme Court’s stacked Republican deck, but that too would involve delays and uncertainty. The Supreme Court has nevertheless ruled that Trump has the power to fire agency heads, but not the Fed Chair. If that’s not enough grey area, then how would the rest of the Board and broader FOMC react to any nasty turn of events against Powell?
GLOBAL MACRO—SOMETHING FOR (ALMOST) EVERYONE
This could be a highly impactful week for global economic indicators. Several key indicators from the US, China, UK, Australia and India will be accompanied by just one central bank decision by Bank Indonesia. What follows are thoughts on key readings from Jay Parmar and I for this section of the report.
US—A Trio of Other Macro Readings
Other key US indicators are on tap as follows:
- Retail sales: June’s reading (Thursday) is expected to be soft following the -0.9% m/m drop in May. Lower vehicle sales and little change in seasonally adjusted gasoline prices may weigh on the headline reading more than sales ex-autos-and-gas.
- Industrial output: June’s measure (Wednesday) might post a gain, but not for great reasons. The 2.9% m/m drop in utilities output in May could rebound as air conditioners whirred back to life. More important will be the manufacturing component, however, and given the generally weak trend in the ISM-manufacturing gauge’s measure of production. Tuesday’s Empire manufacturing gauge and Thursday’s Philly Fed measures—both for July—kick off the path to the next ISM-manufacturing reading and will also inform manufacturing momentum and supply chain challenges.
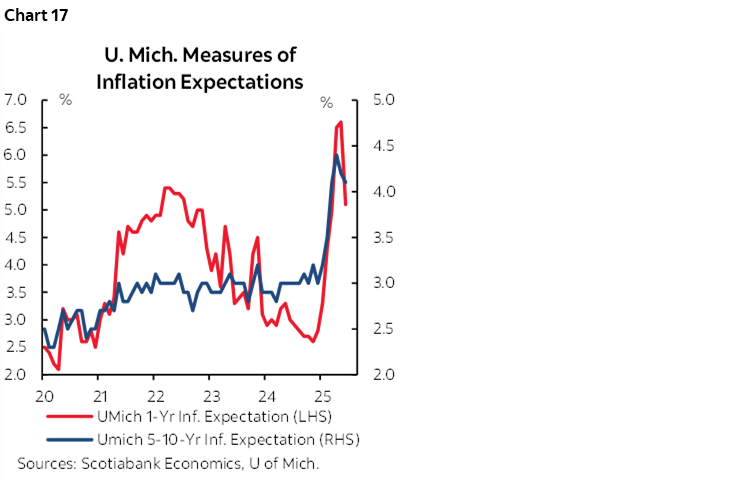
- UMich sentiment: July’s reading for consumer sentiment (Friday) will try to build on the bounce higher in June and dip in inflation expectations albeit at still elevated and volatile readings (chart 17).
Canada—Quiet Beyond CPI
Canada also updates a few third-tier indicators early in the week. General weakness is expected for wholesale trade in May (Monday), manufacturing shipments in May (Tuesday) and housing starts for June (Tuesday). Existing home sales in June (Tuesday) follow the only up-month this year.
China—Damage Reports
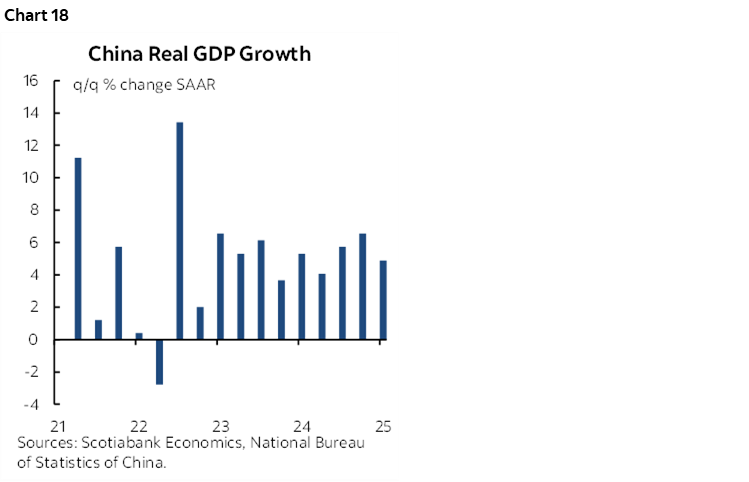
Damage assessments will roll in for China’s economy this week. It may be too soon to expect material effects on the economy given all of the delays and avoidance tactics surrounding tariff wars to date.
Monday night’s (ET) Q2 GDP report is expected to indicate growth of around 1% q/q SA nonannualized. That would extend a slowing pattern (chart 18). June readings may be more insightful by way of fresher evidence on how Q2 ended and the baked-in math effects into Q3. Cooler growth is expected in retail sales and industrial output with a stable 5% unemployment rate. New and resale home prices are expected to continue their slide, thereby limiting efficacy of monetary policy against inelastic demand for money given a lack of confidence in property markets.
UK—CPI & Jobs Unlikely to Sway the BoE
The UK will release its final set of key economic data this week ahead of the Bank of England’s policy meeting on August 7. The June inflation report is due on Wednesday, followed by an updated labour market report on Thursday. Markets have largely priced in a 25bps rate cut at the upcoming meeting, with limited expectation that this week’s data will change that call.
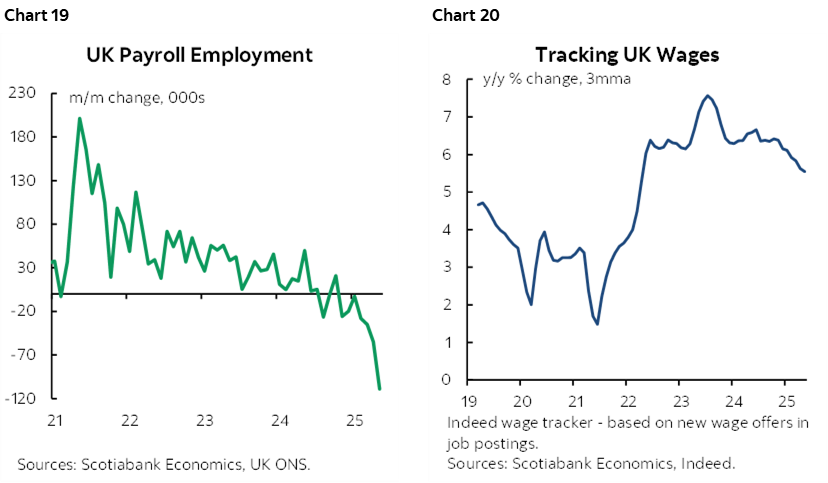
The UK job market is expected to show continued signs of softening, with little indication of near-term recovery. Payroll employment has declined for seven consecutive months (chart 19), and the unemployment rate has been edging higher. Job vacancies have also fallen below pre-pandemic levels. However, wage growth remains resilient, with Indeed’s wage tracker showing that new job postings continue to offer elevated pay gains (chart 20).
As for the inflation report, it’s unlikely to alter the BoE’s stance unless it moves away meaningfully from expectations. The bank has already noted that "consumer price inflation is expected to remain broadly at current rates throughout the remainder of the year before falling back towards target next year." Furthermore, a cut in August would maintain the oscillating cut-hold-cut pattern that has marked the BoE’s gradual approach to easing.
Australia—RBA More Sensitive to Inflation than Jobs
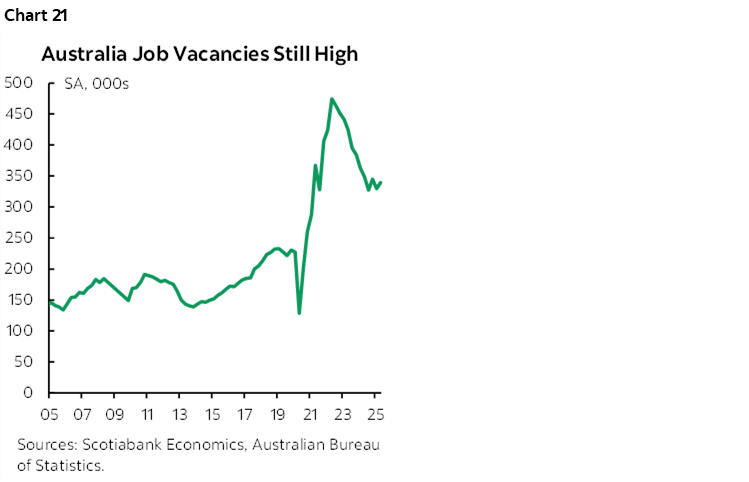
Following a flat outcome in May, the Australian labour market is expected to show continued signs of resilience in June (Monday) while the unemployment rate is expected to remain steady at 4.1%. Although the headline figure in May was weighed down by a loss of 41K part-time jobs, full-time positions were actually up by around 39K, suggesting underlying strength. Job vacancies (chart 21) and Indeed jobs postings continue to point to robust labour demand. As such, it may be premature to interpret May’s data as a sign of weakness. In any event, the RBA recently signalled it was more focused upon waiting “for a little more information to confirm that inflation remains on track to reach 2.5% on a sustainable basis” with the next guidepost coming on July 29th when Q2 inflation figures are released.
India—The Last CPI Report Before the RBI’s August Decision
India’s June inflation report, due on Monday, is expected to show headline inflation rising at a modest pace, with core inflation likely remaining stable near the mid-point of the RBI’s 2–6% inflation target range (chart 22). Forecasts of above average monsoon rainfall are expected to keep food inflation contained in the months ahead. However, barring a significant downside surprise, the release is not expected to shift the monetary policy outlook meaningfully.

Bank Indonesia—Tariff Hit to Growth to Dominate
Bank Indonesia faces a difficult balancing act at its upcoming monetary policy meeting on Wednesday, as it weighs the economic risks of newly announced US tariffs against the need to preserve rupiah stability. Renewed easing is a definite possibility.
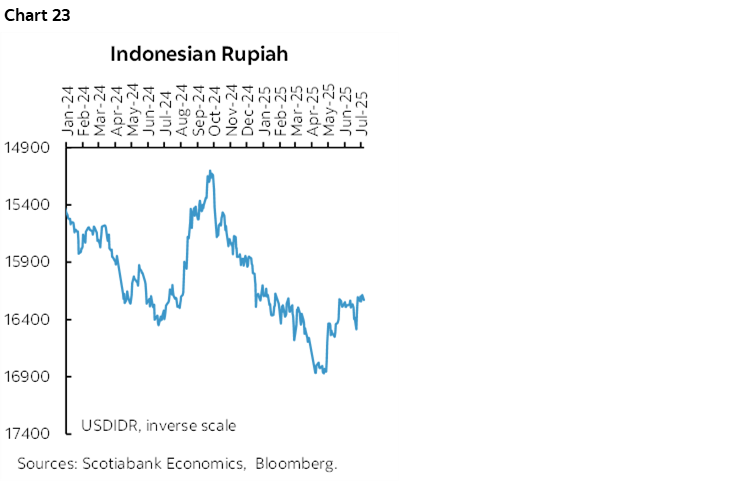
After delivering two rate cuts earlier this year, the central bank held rates steady in June, citing stable inflation and a resilient rupiah. The bank has indicated that the timing of future rate cuts will depend on global conditions and rupiah stability. Since then, the economic outlook has become more uncertain. The Trump administration has announced a 32% tariff on Indonesian exports, set to take effect on August 1st. While the rupiah has remained relatively stable so far, it has edged slightly lower (chart 23) and could come under renewed pressure amid upcoming trade negotiations with the US and Trump’s threat of additional tariffs targeting BRICS-aligned countries. This growing external uncertainty is expected to weigh on the country’s economic growth. Hence, complicating the bank’s policy to support growth without undermining the rupiah’s stability.

DISCLAIMER
This report has been prepared by Scotiabank Economics as a resource for the clients of Scotiabank. Opinions, estimates and projections contained herein are our own as of the date hereof and are subject to change without notice. The information and opinions contained herein have been compiled or arrived at from sources believed reliable but no representation or warranty, express or implied, is made as to their accuracy or completeness. Neither Scotiabank nor any of its officers, directors, partners, employees or affiliates accepts any liability whatsoever for any direct or consequential loss arising from any use of this report or its contents.
These reports are provided to you for informational purposes only. This report is not, and is not constructed as, an offer to sell or solicitation of any offer to buy any financial instrument, nor shall this report be construed as an opinion as to whether you should enter into any swap or trading strategy involving a swap or any other transaction. The information contained in this report is not intended to be, and does not constitute, a recommendation of a swap or trading strategy involving a swap within the meaning of U.S. Commodity Futures Trading Commission Regulation 23.434 and Appendix A thereto. This material is not intended to be individually tailored to your needs or characteristics and should not be viewed as a “call to action” or suggestion that you enter into a swap or trading strategy involving a swap or any other transaction. Scotiabank may engage in transactions in a manner inconsistent with the views discussed this report and may have positions, or be in the process of acquiring or disposing of positions, referred to in this report.
Scotiabank, its affiliates and any of their respective officers, directors and employees may from time to time take positions in currencies, act as managers, co-managers or underwriters of a public offering or act as principals or agents, deal in, own or act as market makers or advisors, brokers or commercial and/or investment bankers in relation to securities or related derivatives. As a result of these actions, Scotiabank may receive remuneration. All Scotiabank products and services are subject to the terms of applicable agreements and local regulations. Officers, directors and employees of Scotiabank and its affiliates may serve as directors of corporations.
Any securities discussed in this report may not be suitable for all investors. Scotiabank recommends that investors independently evaluate any issuer and security discussed in this report, and consult with any advisors they deem necessary prior to making any investment.
This report and all information, opinions and conclusions contained in it are protected by copyright. This information may not be reproduced without the prior express written consent of Scotiabank.
™ Trademark of The Bank of Nova Scotia. Used under license, where applicable.
Scotiabank, together with “Global Banking and Markets”, is a marketing name for the global corporate and investment banking and capital markets businesses of The Bank of Nova Scotia and certain of its affiliates in the countries where they operate, including; Scotiabank Europe plc; Scotiabank (Ireland) Designated Activity Company; Scotiabank Inverlat S.A., Institución de Banca Múltiple, Grupo Financiero Scotiabank Inverlat, Scotia Inverlat Casa de Bolsa, S.A. de C.V., Grupo Financiero Scotiabank Inverlat, Scotia Inverlat Derivados S.A. de C.V. – all members of the Scotiabank group and authorized users of the Scotiabank mark. The Bank of Nova Scotia is incorporated in Canada with limited liability and is authorised and regulated by the Office of the Superintendent of Financial Institutions Canada. The Bank of Nova Scotia is authorized by the UK Prudential Regulation Authority and is subject to regulation by the UK Financial Conduct Authority and limited regulation by the UK Prudential Regulation Authority. Details about the extent of The Bank of Nova Scotia's regulation by the UK Prudential Regulation Authority are available from us on request. Scotiabank Europe plc is authorized by the UK Prudential Regulation Authority and regulated by the UK Financial Conduct Authority and the UK Prudential Regulation Authority.
Scotiabank Inverlat, S.A., Scotia Inverlat Casa de Bolsa, S.A. de C.V, Grupo Financiero Scotiabank Inverlat, and Scotia Inverlat Derivados, S.A. de C.V., are each authorized and regulated by the Mexican financial authorities.
Not all products and services are offered in all jurisdictions. Services described are available in jurisdictions where permitted by law.