Next Week's Risk Dashboard
- US indicators may not repeat prior strengths
- Eurozone CPI to inform the ECB’s bias
- Is Canada’s economy still resilient?
- China’s economy probably sustained gains
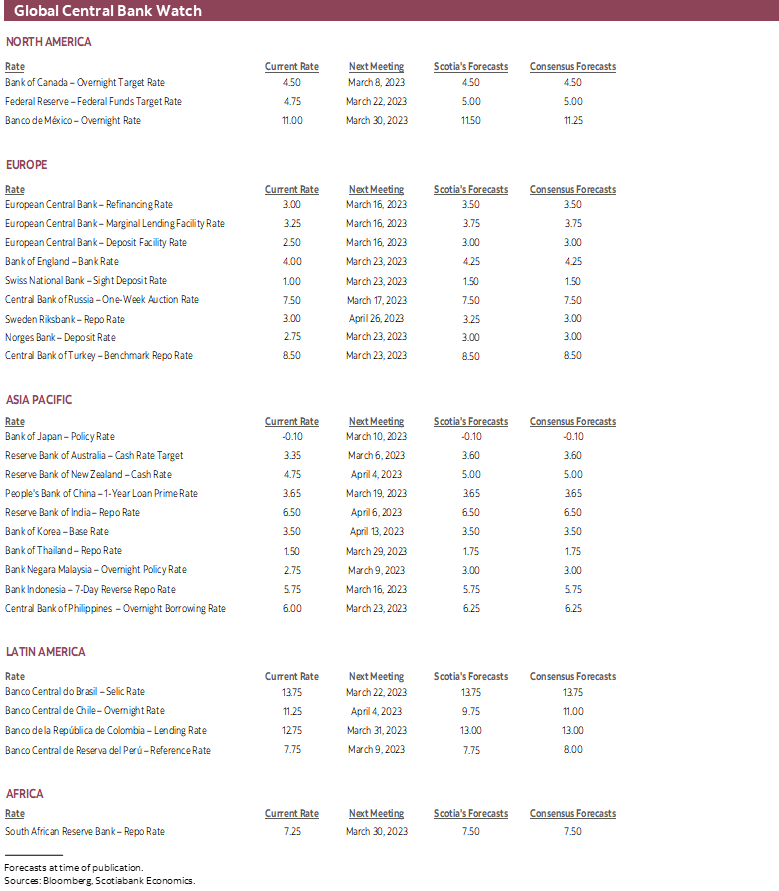
- Hurray! No central bank decisions
- Canadian bank earnings
- Canada’s budget season commences
- Other global macro
Chart of the Week
Will markets adhere to the old proverb that March can come in like a lion and go out like a lamb? A tough month of February for risk appetite could make it so. Still, it may depend in part on a round of fresh evidence on some of the factors that recently drove strengthened optimism toward the global economy. The cost to this has been greater concern about ongoing upside risks to inflation and additional policy tightening by major central banks like the Fed and the ECB.
Key developments will emphasize the health of the US, Canadian and Chinese economies as well as the last Eurozone inflation report before its March meeting. There will be no major central bank decisions this week. Canadian banks update quarterly earnings and a couple of Canadian provinces will kickstart the annual budget parade.
CHINA’S ECONOMY—SUSTAINED MOMENTUM?
Was the strong snapback in China’s economy during January a one-off response to suddenly abandoning Covid Zero policies? Or does a recovery have legs to it and to what degree?
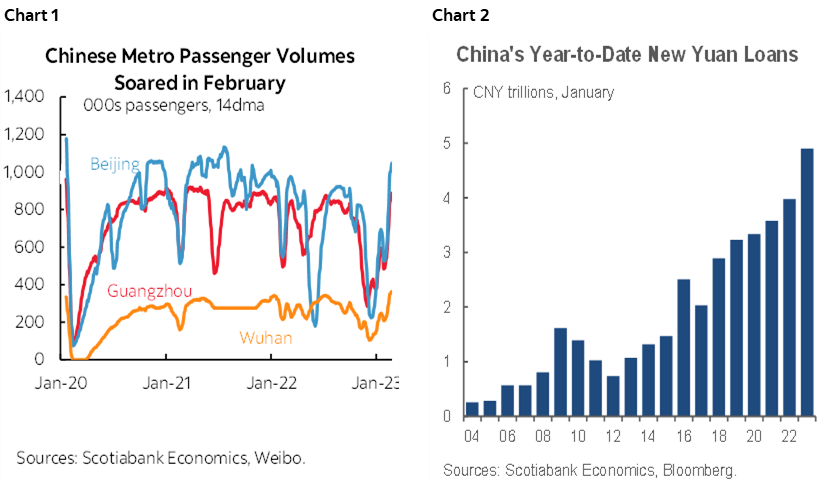
The answer to this question will arrive with purchasing managers’ indices for February on Tuesday evening (eastern time as always in this publication). These measures can correlate to GDP growth and evaluate business conditions through the lens of a purchasing manager. Most of the rebound in January was driven by the non-manufacturing sector and hence primarily services activity as mobility restrictions were removed. The Lunar New Year occurred on January 22nd this year but momentum appeared to continue into February.
Evidence of this takes the form of the number of flights and also transit ridership (chart 1) since evidence of such mobility indicates sustained spending activity. New yuan loans also surged in January to the greater volume of new loans for a month of January on record and this may carry spillover effects on economic activity into February (chart 2).
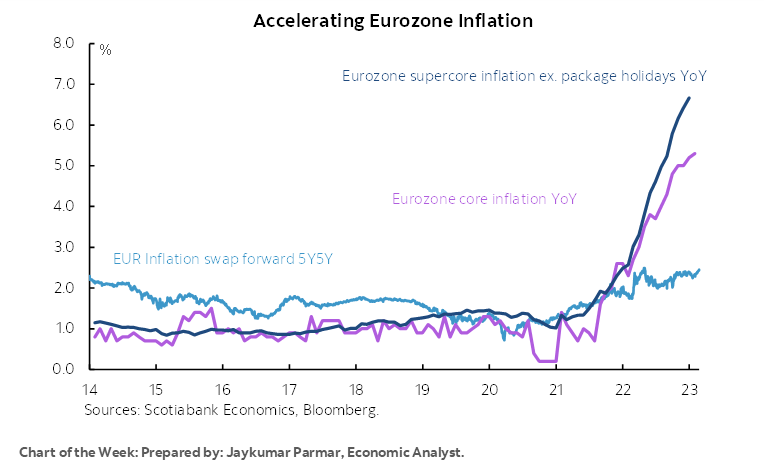
EUROZONE INFLATION—CORE MAY INFORM THE ECB’S POST-MARCH BIAS
The last inflation reading before the ECB’s next decision on March 16th arrives on Thursday when Eurozone CPI will be updated for February. This reading is unlikely to sway the ECB from guidance that it intends to hike each of its policy rates by 50bps on March 16th, but it may play into the bias that is delivered at that meeting when fresh forecasts will be provided.
President Lagarde made this clear when on February 21st she said “What comes after that will be data dependent. We will look at all numbers – inflation, obviously, labour cost, projections and we will determine what our monetary policy path will be after that.”
Spain and France will provide a first glimpse at what to expect when they release CPI estimates on Tuesday. They will be followed by Germany on Wednesday. There is likely to be much less intrigue by the time the Eurozone add-up arrives along with Italy’s estimate at the same time on Thursday.
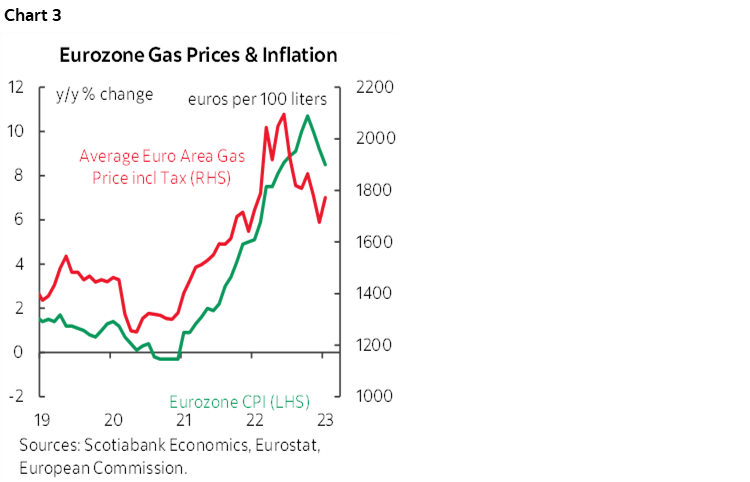
Higher fuel prices are expected to push seasonally unadjusted Eurozone CPI up by around ½% m/m (chart 3). That could mitigate some of the further deceleration in year-over-year inflation that is driven by base effect references. There were also policy changes that are expected to boost headline inflation. For instance, France raised the cap on electricity prices by 15% in February. It’s also possible that changes to basket weights in Germany may put more emphasis upon service price inflation. The latter point may fan core Eurozone inflation that would matter more to the ECB than headline inflation.
US MACRO—CAN UPSIDES REPEAT?
Part of what drove the bond market selloff over recent weeks was a round of bullish evidence on the state of the US economy. Readings from nonfarm payrolls to retail sales, vehicle sales, manufacturing output, durable goods orders and service sector activity vaulted ahead and smashed expectations.
Key this coming week will be the commencement of the next round of such indicators that will test whether these gains were one-offs or something that is sustainable. Here is the list in chronological order of release.
- Durable goods orders (Monday): January’s orders will likely reverse much of the 5.6% m/m gain that occurred in December but this may mask more constructive details. Boeing recorded a surge to 250 plane orders in December with 73% of those placed by US airlines from just 21 the prior month and then saw an additional 55 planes ordered in January. Lumpy aircraft orders will probably drag on total durable goods orders. It’s possible that vehicle orders will mitigate these effects given that vehicle sales soared by 18% m/m in January. Regardless, the focus will be upon core durable goods orders ex-planes and ex-defence that have slipped in three of the past four months.
- Pending home sales (Monday): January’s reading could benefit from the surge in mortgage purchase applications in January and early February before more recent weakness set in. This indicator measures contract signings before sales close and turn into existing home sales 30–90 days later on average.
- Advance merchandise trade (Tuesday): Little change is expected in the two-way balance on merchandise trade that stood at a deficit of about $90B in December as oil prices have been largely moving sideways into the new year.
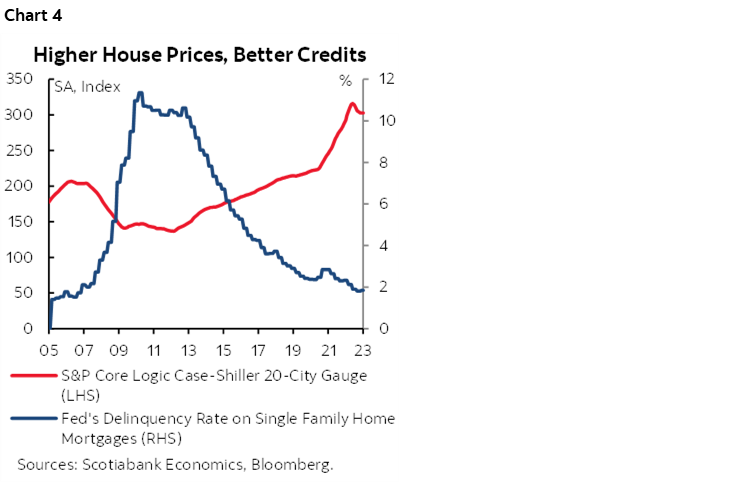
- S&P house prices (Tuesday): December’s repeat-home sales price probably fell again in December for the fifth straight month. The magnitude of the cumulative decline to date has been a fairly modest -4% from last summer’s peak after prices soared during the pandemic, while the mortgage delinquency rate remains very low (chart 4).
- Consumer confidence (Tuesday): February’s reading might improve again as a reflection of underlying strength in the US job market. This measure is more driven by job markets than the UofM Sentiment gauge that is more driven by cash flows including considerations like gasoline prices.
- Construction spending (Wednesday): January’s estimate may continue to be weighed down by another drop in housing starts unless the nonresidential sector snaps back.
- ISM-manufacturing (Wednesday): February’s reading is expected to continue to show manufacturing in contraction but perhaps at a slower pace given evidence from regional surveys conducted by the NY Federal Reserve, the Philly Fed and the KC Fed. Tuesday’s Richmond Fed gauge may also help to inform expectations.
- Vehicle sales (Wednesday): February’s reading will probably reverse some of the spurt that occurred in January when sales were up by 18% m/m SA. Industry guidance points toward about 14¾ million vehicles sold at a seasonally adjusted and annualized rate in February for a drop of about 6%. If that happens then it could shave about 1% off of retail sales on March 15th. A caveat is that this guidance is based on only two-thirds of February’s selling days and so it could be significantly off in either direction.
- Weekly initial jobless claims: With Thursday’s latest estimate the US pushes out of February’s nonfarm reference period that is the pay period including the 12th day of each month. Claims remain very low at sub-200k levels that continue to shake off layoff announcements since November’s pick up.
- ISM-services (Friday): February’s estimate is expected to dampen some of the enthusiasm following the large six-point surge in January that played a significant role in driving a global bond market selloff. Continued expansion at a more moderate pace is expected.
CANADA’S ECONOMY—STILL RESILIENT?
Canada updates GDP growth estimates for how 2022 ended and how 2023 began on Tuesday. The results will help to inform how resilient the Canadian economy may continue to be and the extent to which a tight economy continues to put upside risk to inflation.
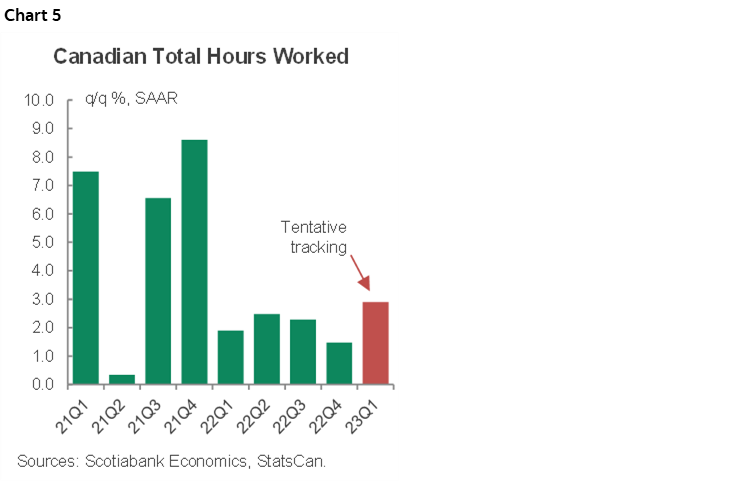
I’ve estimated GDP growth at 0.2% m/m in December, about 1.4% for Q4 overall, and with even greater trepidation forecast January to post another mild gain. That hours worked in the economy advanced by 1.5% q/q at a seasonally adjusted and annualized rate (SAAR) in Q4 suggests a solid gain in GDP given that it is an identity defined as hours worked times labour productivity. The mild dip in hours during December (-0.1%) may be offset by a pick-up in activity readings. The large 0.8% m/m rise in hours worked in January adds upside risk. Robust growth continues (chart 5).
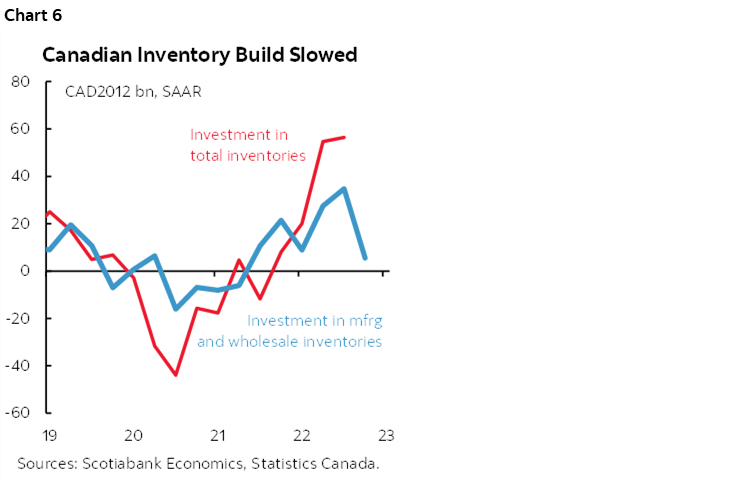
A strong caution when evaluating the numbers, however, is to parse through the details as growth is likely to be heavily distorted under the hood. For example, a sharp reversal in the pace of inventory investment will probably strongly subtract from GDP growth. We don’t have total business inventories for Q4 but do have them for manufacturers and wholesalers with the missing parts being retailers and farm inventories. Tracking of those two sectors suggest that total inventory investment will likely sharply diminish in Q4 (chart 6). By how much is highly uncertain such that headline GDP faces a range of scenarios from a contraction to a mild expansion around our base case estimate.
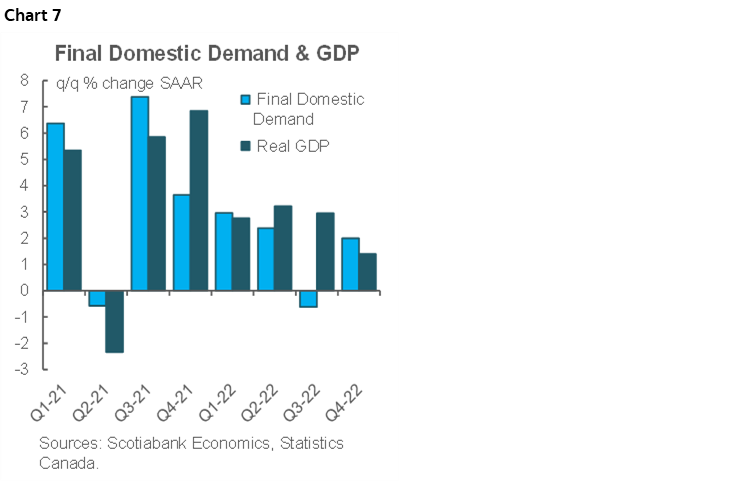
An offset to inventory moves may be net trade effects and the connection between exports, imports and inventories. In order to better gauge conditions in the domestic economy it may be important to focus upon final domestic demand (FDD) instead of GDP. This concept adds consumption plus housing investment plus business investment in structures and equipment plus government spending. FDD contracted in Q3 last year when consumer spending and housing investment dipped. It is expected to rebound in the Q4 figures (chart 7).
What this would leave us with is a picture of the economy that is still not opening up disinflationary slack in a robust fashion across top line growth or underlying details. The economy remains well into excess aggregate demand conditions that continue to slant toward upside risk to inflation going forward.
THE REST
Canadian bank earnings continue to roll out with fiscal Q1 results due from BNS, BMO and Laurentian Bank on Tuesday, RBC and National Bank on Wednesday, and then TD and Canadian Western Bank on Thursday.
Australia’s economy probably advanced at a healthy pace in Q4 with most estimates for Tuesday evening’s release in the ½% to 1% q/q non-annualized range.
Inflation reports will mainly emphasize the aforementioned Eurozone tally but watch for three other readings. Peru’s CPI for February is expected to accelerate to 8.8% y/y. Australia’s monthly CPI estimate is expected to decelerate to 8.1% y/y on Tuesday night. The Tokyo gauge for February could begin to deliver upon Governor-designate Ueda’s recent remark that inflation may soon crest. Indonesia will also update CPI sometime over the course of the week.
Other Asia-Pacific readings will include Indian GDP (Tuesday) and PMIs (Wednesday, Friday). Japan updates industrial output, retail sales and housing starts toward the start of the week.
LatAm markets will take down Brazilian GDP (Thursday) and PMIS (Friday), labour market readings from Chile (Monday) and Mexico (Thursday) plus Chilean retail sales and industrial output (Tuesday).
CANADA’S GOVERNMENT BUDGET SEASON
Canadian governments cram their budgets into a few months at this time of every year and the season kicks off on Tuesday with the third and fourth largest provincial governments. Scotia’s Laura Gu offers her views below.
BC Budget
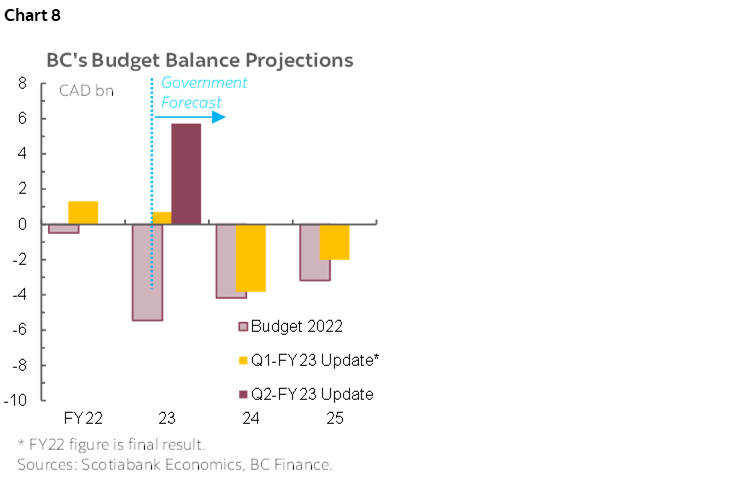
We expect BC to report a modestly improved fiscal position—but with mounting downside risks in the upcoming fiscal years—when it releases the 2023 budget on Tuesday. Recall that in its second-quarter update, the government projected a $5.7 bn (1.5% of nominal GDP) surplus in FY23, with revenues tracking $3.2 bn higher than in the first-quarter update and $12.5 bn higher than in the last budget, giving FY24 a strong handoff (chart 8). However, we expect revenue windfalls to unwind rapidly in FY24 as the impact of rising interest rates disproportionally affects the province—the province expects a return of deficit in FY24 at -$3.8 bn (-0.9% of GDP) in its first quarter update, and will likely further lower its economic growth forecast in the upcoming budget. The slowing nominal growth and potential deterioration in budget balances could send the net debt-to-GDP ratio on an upward trajectory.
With heightened uncertainty in its outlook, we expect BC’s updated blueprint to continue to include substantial contingencies. The current forecast incorporates a sizable fiscal buffer of $5.1 bn in contingencies and forecast allowances in FY23 and another $5.4 bn in FY24. Hence, the province likely has the capacity to absorb significant downside risks and additional spending pressures.
Alberta Budget
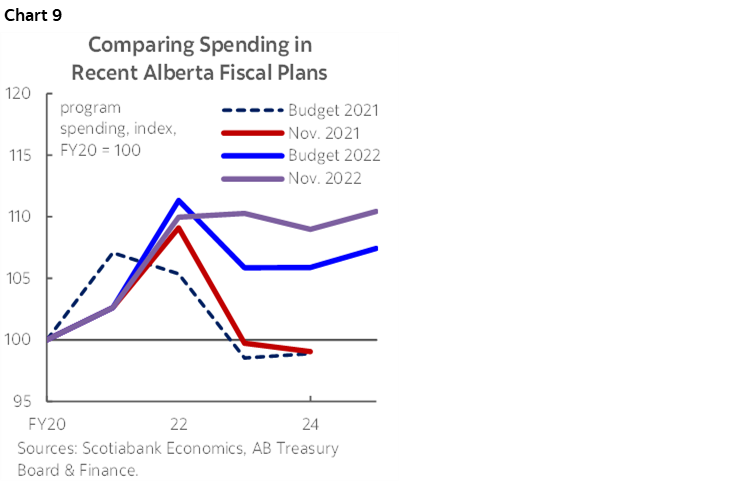
Alberta will release its 2023 budget on Tuesday where we expect to see continued surpluses for the upcoming fiscal years, and potentially an upgraded spending profile with the province’s abundant surplus cash. Recall that the mid-year fiscal update released in November projected three consecutive years of surpluses at $12.3 bn (2.6% of nominal GDP) in FY23, $5.6 bn (1.2%) in FY24, and $5.3 bn (1.1%) in FY25, underpinned by strong WTI price projections.
The province’s bottom line is highly sensitive to oil price assumptions, which is a main risk (both upside and downside) we are watching in this budget. The current forecast assumes WTI price to average US$78.5/bbl in FY24 and US$73.5/bbl in FY25—reasonable at the moment but heightened economic and policy uncertainty as well as largely unaffected Russian exports could bring prices lower. As every US$1 in WTI is linked to $500 mn in revenues according to the last Budget’s estimate, to completely unwind the surpluses pencilled in for FY24 and FY25, WTI would need to average below US$70/bbl.
The government has demonstrated prudent fiscal planning in FY23 by refraining from spending its sizable windfalls and instead dedicating them to debt reduction (chart 9). Recall that in its mid-year update, the province raised its spending profile modestly, but the overall spending growth remained restrained, especially considering the $2.8 bn pencilled in over three years for affordability initiatives. Given the highly uncertain outlook, this prudence continues to be warranted and the government should hold its line on new spending—a challenging mission with an upcoming election and the long-run diversification needs.

DISCLAIMER
This report has been prepared by Scotiabank Economics as a resource for the clients of Scotiabank. Opinions, estimates and projections contained herein are our own as of the date hereof and are subject to change without notice. The information and opinions contained herein have been compiled or arrived at from sources believed reliable but no representation or warranty, express or implied, is made as to their accuracy or completeness. Neither Scotiabank nor any of its officers, directors, partners, employees or affiliates accepts any liability whatsoever for any direct or consequential loss arising from any use of this report or its contents.
These reports are provided to you for informational purposes only. This report is not, and is not constructed as, an offer to sell or solicitation of any offer to buy any financial instrument, nor shall this report be construed as an opinion as to whether you should enter into any swap or trading strategy involving a swap or any other transaction. The information contained in this report is not intended to be, and does not constitute, a recommendation of a swap or trading strategy involving a swap within the meaning of U.S. Commodity Futures Trading Commission Regulation 23.434 and Appendix A thereto. This material is not intended to be individually tailored to your needs or characteristics and should not be viewed as a “call to action” or suggestion that you enter into a swap or trading strategy involving a swap or any other transaction. Scotiabank may engage in transactions in a manner inconsistent with the views discussed this report and may have positions, or be in the process of acquiring or disposing of positions, referred to in this report.
Scotiabank, its affiliates and any of their respective officers, directors and employees may from time to time take positions in currencies, act as managers, co-managers or underwriters of a public offering or act as principals or agents, deal in, own or act as market makers or advisors, brokers or commercial and/or investment bankers in relation to securities or related derivatives. As a result of these actions, Scotiabank may receive remuneration. All Scotiabank products and services are subject to the terms of applicable agreements and local regulations. Officers, directors and employees of Scotiabank and its affiliates may serve as directors of corporations.
Any securities discussed in this report may not be suitable for all investors. Scotiabank recommends that investors independently evaluate any issuer and security discussed in this report, and consult with any advisors they deem necessary prior to making any investment.
This report and all information, opinions and conclusions contained in it are protected by copyright. This information may not be reproduced without the prior express written consent of Scotiabank.
™ Trademark of The Bank of Nova Scotia. Used under license, where applicable.
Scotiabank, together with “Global Banking and Markets”, is a marketing name for the global corporate and investment banking and capital markets businesses of The Bank of Nova Scotia and certain of its affiliates in the countries where they operate, including; Scotiabank Europe plc; Scotiabank (Ireland) Designated Activity Company; Scotiabank Inverlat S.A., Institución de Banca Múltiple, Grupo Financiero Scotiabank Inverlat, Scotia Inverlat Casa de Bolsa, S.A. de C.V., Grupo Financiero Scotiabank Inverlat, Scotia Inverlat Derivados S.A. de C.V. – all members of the Scotiabank group and authorized users of the Scotiabank mark. The Bank of Nova Scotia is incorporated in Canada with limited liability and is authorised and regulated by the Office of the Superintendent of Financial Institutions Canada. The Bank of Nova Scotia is authorized by the UK Prudential Regulation Authority and is subject to regulation by the UK Financial Conduct Authority and limited regulation by the UK Prudential Regulation Authority. Details about the extent of The Bank of Nova Scotia's regulation by the UK Prudential Regulation Authority are available from us on request. Scotiabank Europe plc is authorized by the UK Prudential Regulation Authority and regulated by the UK Financial Conduct Authority and the UK Prudential Regulation Authority.
Scotiabank Inverlat, S.A., Scotia Inverlat Casa de Bolsa, S.A. de C.V, Grupo Financiero Scotiabank Inverlat, and Scotia Inverlat Derivados, S.A. de C.V., are each authorized and regulated by the Mexican financial authorities.
Not all products and services are offered in all jurisdictions. Services described are available in jurisdictions where permitted by law.