Next Week's Risk Dashboard
- Why growth is resilient so far…
- …and the forces working against tighter monetary policy
- It’s the real term structure that matters…
- …and it’s not outlandishly restrictive
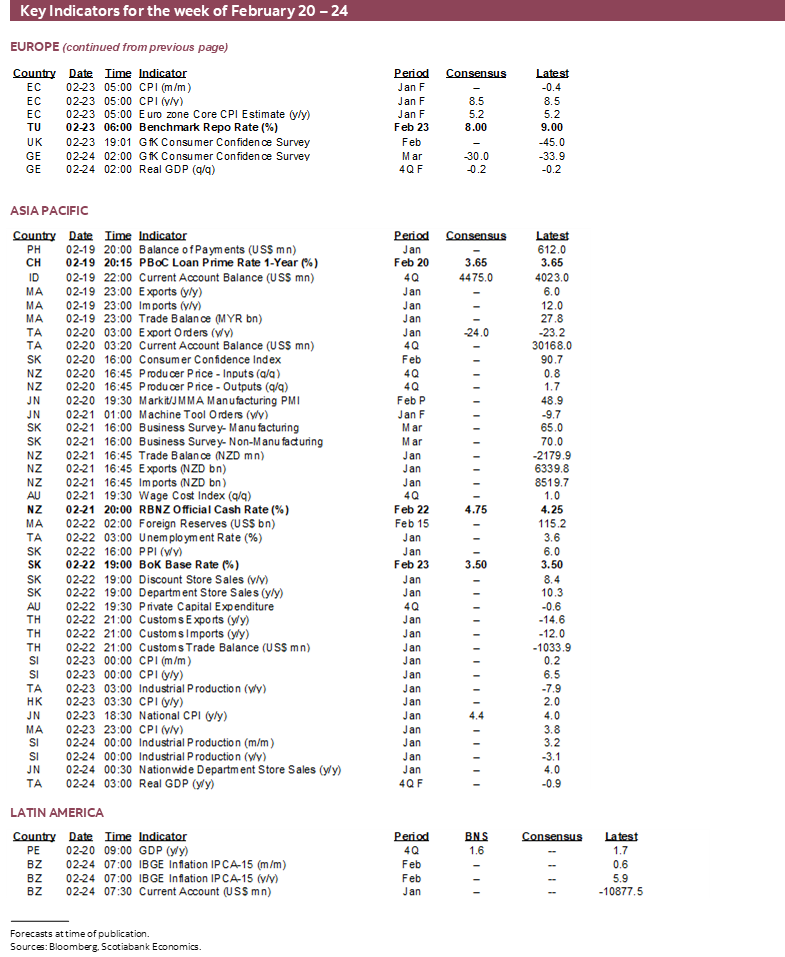
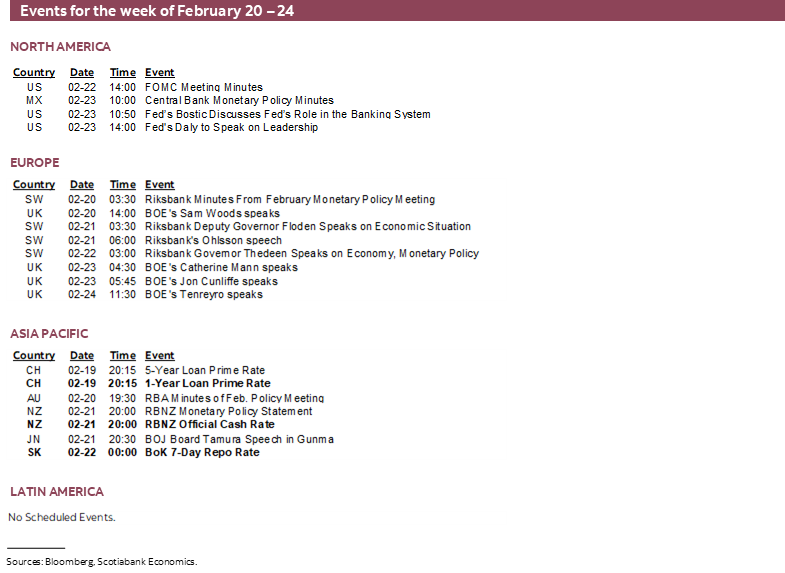
- FOMC minutes to refresh path guidance
- Canadian core inflation likely increased
- What makes this Canadian inflation reading special
- Global PMIs to inform Q1 growth tracking
- Fed’s preferred inflation gauge to follow CPI
- US consumption, incomes likely leapt forward
- RBNZ expected to hike again
- Bank of Korea is a tough call
- Australian wages to inform RBA’s stance
- Peru’s Q4 GDP to assess protest effects
- CPI: Japan, Malaysia, Sweden
Chart of the Week
One key question hangs over the minds of market participants more than others. Why are we getting robust signals from the economy about a year-and-a-half into upward pressure on market-based borrowing costs? A coming week that may well reveal more about the Fed’s intentions along with global readings on growth and inflation makes this an opportune moment to pose the question.
Forecasters need to readily admit that the macroeconomic environment has been better than feared and certainly a lot better than some of the most depressing narratives out there.
Why? I’ll lump possible explanations into two broad categories of explanations for your consideration.
NEW INFORMATION
No business sets a plan on autopilot and simply forgets about it. Or rather, no successful business should do so. The same applies to forecasters who have to be adept at incorporating new information and much of the new information received in a fairly short period of time has been more upbeat, or at least less downbeat.
That includes China’s abrupt reopening. Some felt Xi Jinping could pivot toward easing restrictions after securing his third term last October. Some felt he could do the opposite and clamp down further. But I never heard one single China watcher suggest that China might suddenly abandon all restrictions and yet they did just that. The first impulse effect is through domestic services and the second lagging effect is likely to be through industrial activity once high inventories are burned off and with positive implications for commodities over time.
New information also includes a less dire outlook for Europeans through this winter than feared last Fall given weaker energy prices and more public policy supports that took the shock to household and business cash flows onto government books.
A DIFFERENT CYCLE
There has to be more to it than just new information, however, since we’re still left with explaining how, say, the US economy—and even Canada’s economy—has performed considerably better than feared so far. There are still lagging negative effects of tighter monetary policy ahead of us, but it’s at least as important to consider the points of resilience. Put another way, there is a list of ‘never hads’ that mitigates the effects of a tightening cycle.
For one, it’s without precedent that a tightening cycle has coincided with healing supply chains. Usually, the supply side is maxed out when central banks begin tightening policy. This time around, however, multiple measures of supply chain pressures have improved and continue to do so which lends the ability to produce more for the customers who were being underserved.
Second, US household finances are usually stretched once monetary policy begins to clamp down. That’s untrue this time around. American households have less debt relative to incomes than they’ve had in twenty-two years because they learned from the GFC and/or were forced to learn by regulators. Debt payments remain toward record lows as a share of incomes and while higher rates will push them higher, they are still likely to remain compatible with consumption growth. Trump and Biden threw more cash at households than they knew what to do with it such that even the squirrel with the fullest den is looking on with envy. American mortgage borrowers have locked in 30-year mortgage lows with the one-way refi option in a curiously designed mortgage market. And of course the job market is extremely strong. Very strong US household finances are an important offset to weaker household finances north of the border through the trade connections.
Extending this latter point is the observation we’ve never gone into a recession with anywhere nearly as high unfilled job openings in sectors struggling to find workers as we have now. The Great Rotation of jobs from sectors that hogged all of the workers toward sectors that are finally able to get help is probably at a still nascent stage.
Never before has there been a tightening cycle with pent-up demand in less interest-sensitive sectors like services. Services spending has recovered to pre-pandemic levels but the lost spending from 2020–22 that couldn’t be inventoried is a big batch of activity still waiting to be unleashed in a continued quest to return to a more normal world. Services spending dominates GDP and could offset some if not all of the hit to interest sensitives.
Some Canadian never-hads as mitigating factors leaning against the effects of higher borrowing costs include OSFI’s B20 mortgage stress test that pre-empted some of the rate shock and helped the mortgage market adjust to higher rates years in advance. Immigration policy is a night-and-day difference now compared to decades of past cycles as Canada throws open its borders to the fastest population growth among industrialized nations. Further, past soft patches were met by procyclical fiscal policy that cut spending into a downturn; Canadian governments have no such inclinations whatsoever this time around!
There is, however, a cost to this list of never-hads. If the economy has greater supports into a hiking cycle than in the past, then persistent inflation risk is higher and the hiking cycle arguably has to lean more firmly on the exit button.
To this effect, it’s the real cost of borrowing (adjusted for inflation) that matters in terms of what affects economic growth, labour markets and broader conditions. Charts 1–5 provide different measures of the real policy rate in the US and charts 6–10 do likewise for the real US 10-year Treasury yield.
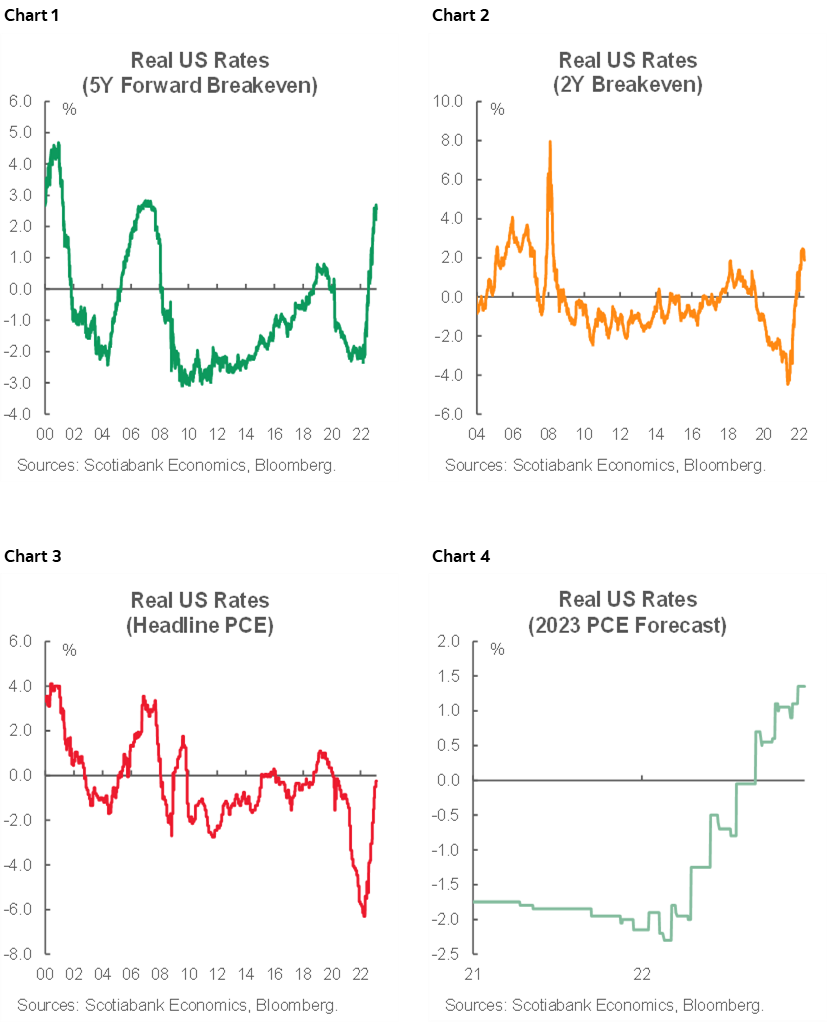
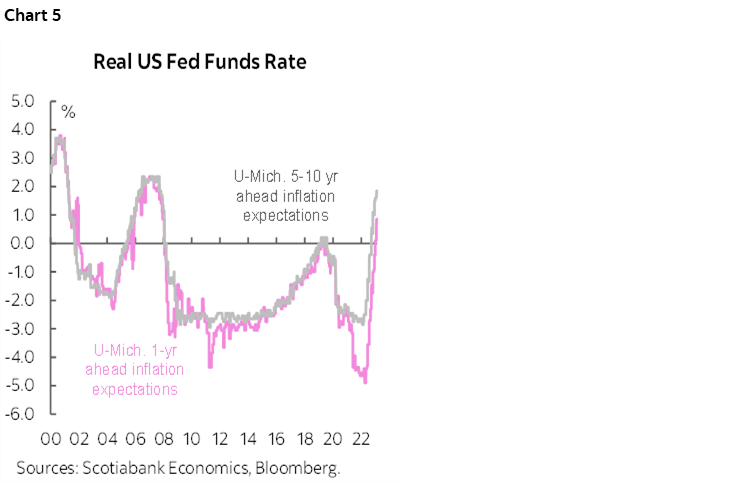
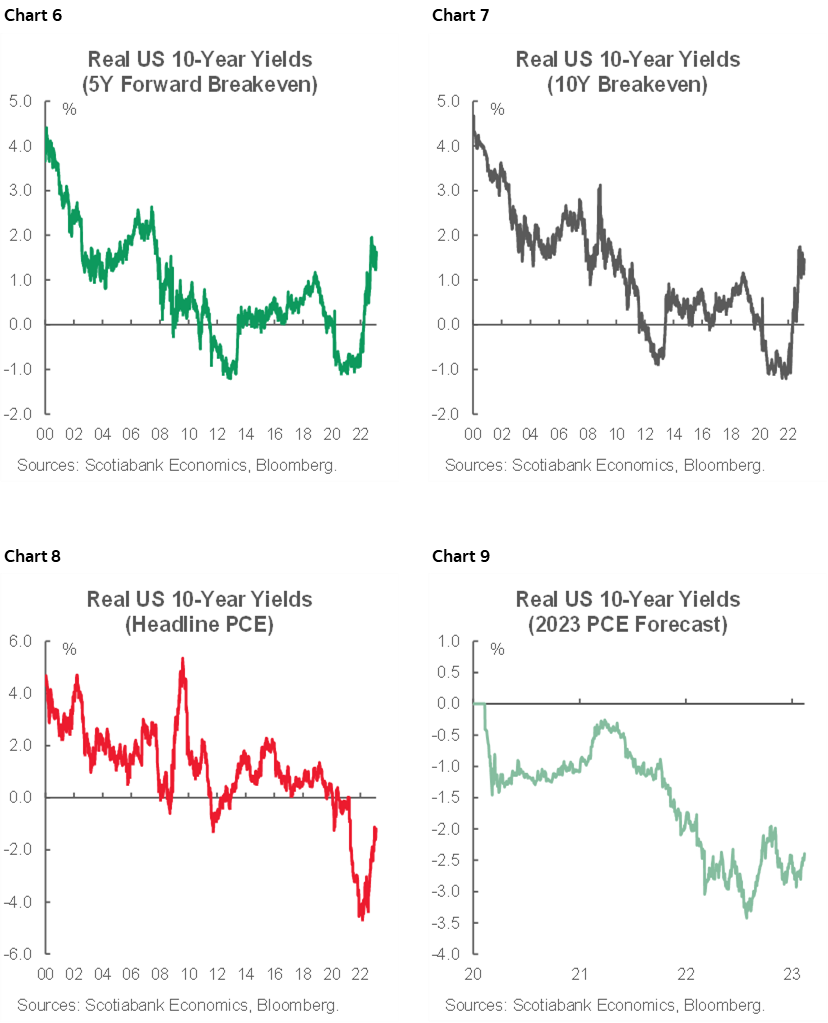
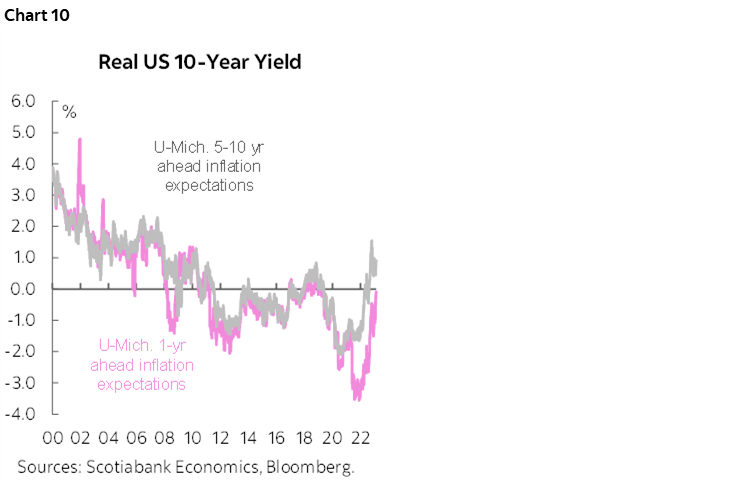
Real policy rate measures range from below to at best approaching peaks of past cycles which may be insufficient if this cycle has unique supports. Real 10-year yields are even lower than that as the real slope of the term structure of borrowing costs is flatter than historically. In my view, that has quite a lot to do with distortions like Fed ownership of the bond market, albeit dwindling, and like last October’s buyback trial balloon that has since been replaced by a possible premium driven by uncertainty around the US debt ceiling.
CANADIAN INFLATION—CORE IS ABOUT TO GET HOTTER
Canada updates inflation figures for January on Tuesday. I’ll explain why market participants should be even more careful than normal into this report and why average core inflation is likely to accelerate.
First up is the attempt at estimates. I’ve estimated a headline increase of 0.7% m/m NSA that translates into about a 0.3% m/m SA rise and a 6.1% y/y gain from 6.3% the prior month.
Drivers are expected to include higher gasoline prices that should add 0.2% to m/m inflation in weighted seasonally unadjusted terms. Food price inflation is assumed to add a touch more. Vehicle prices are assumed to have had a negligible impact.
House prices are also having a negligible impact upon Canadian inflation. Canada captures housing within shelter costs through homeowners’ replacement costs. That category has only a 6.4% weight in the CPI basket and is driven by the house-only part of Statistics Canada’s new house price index, and hence builder prices. While builder price changes are dragging this category lower, replacement cost is only adding 0.3 ppts to CPI in year-over-year terms and the direct disinflationary pressures are likely to be minimal.
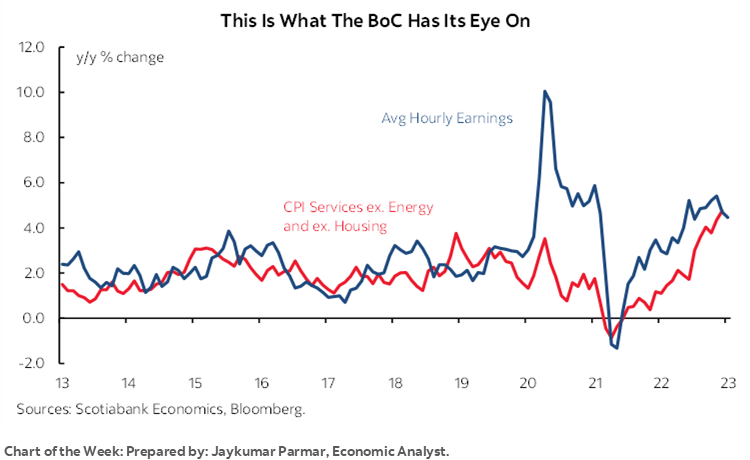
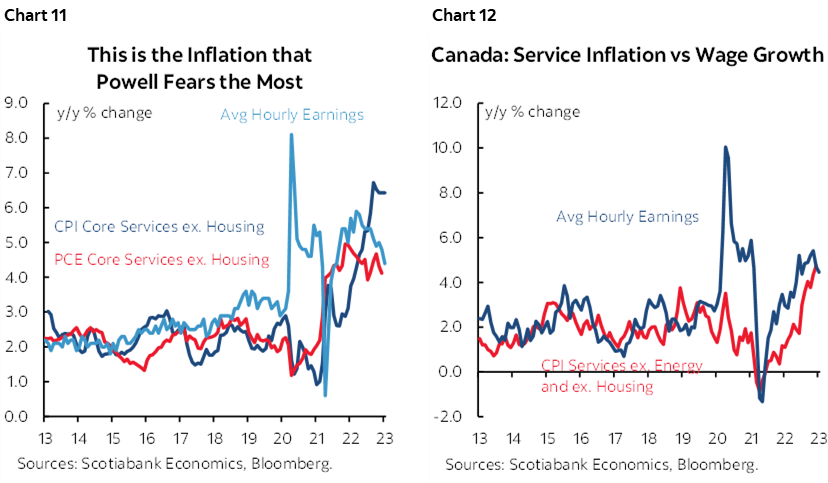
More of the focus in Canada—like the US—is upon service price inflation that is guesstimated to remain firm as it was in the recent US figures. As charts 11–12 demonstrate, there is a similar loose connection between wage growth and services inflation in Canada as in the US. That is why Governor Macklem sounds almost exactly like Fed Chair Powell when he says “We will be watching productivity, labour costs and services price inflation closely.”
Traditional core CPI is very roughly estimated to be up by slightly less than headline CPI in m/m seasonally adjusted terms.
Herein lies the rub—be very careful insofar as measures of core inflation are concerned this time around for the following reasons.
The Seven Year Itch
With due apologies to the late Marilyn Monroe. Statcan has advised that this report will revise CPI-trimmed mean and CPI-weighted median measures back 7 years in time. This is part of normal revisions, but we have no real way of telling how the figures could change in direction, magnitude and timing.
Higher Frequency ‘Core’ Gauges
Secondly, Statcan will begin publishing index levels for CPI-trimmed mean and CPI-weighted median back to December 2016. While their unpublished tabulation of 55 CPI components that is available immediately after release has made it possible for us to do our own calculations, the publication of the index levels will now add some transparency to understanding of m/m inflationary pressures in these core readings.
This should have been done a long time ago—when the measures were first introduced by former Governor Poloz, or when inflation was on an upswing, and not when the pressures at the margin are off their peaks! Doing so now will nevertheless help BoC watchers evaluate pressures at the margin instead of just having the year-over-year readings even though those year-over-year readings are not spot calculations because they weight compounded monthly changes over the full year.
A caution, however, is that, assuming Statcan publishes the seasonally adjusted index levels on a spot monthly basis and not a weighted compounded index that evolves slowly over time, it is likely to be highly volatile and require smoothing. For example, the 40% of the CPI basket that gets excluded in one month’s calculation for trimmed mean could easily be a different 40% of the basket the next month and result in wild gyrations.
Seasonally Adjusting Prices That Change Infrequently—Not This Again!
Third, Statcan will be reopening a can of worms it opened and quickly shut some time ago. It will be revisiting seasonal adjustments for prices that change infrequently, like property taxes, transit prices, health care services, education and other regulated prices. This is a sizeable issue in an economy like Canada’s and it affects 15 series in the basket. When Statcan published revised CPI estimates using changes to its approach to estimate seasonal adjustments for such series a few years ago it prompted pushback including from the Bank of Canada and Statcan announced soon after that it would revert back to its prior treatment until fuller consultation. That took a while I guess and now we’ll get the results.
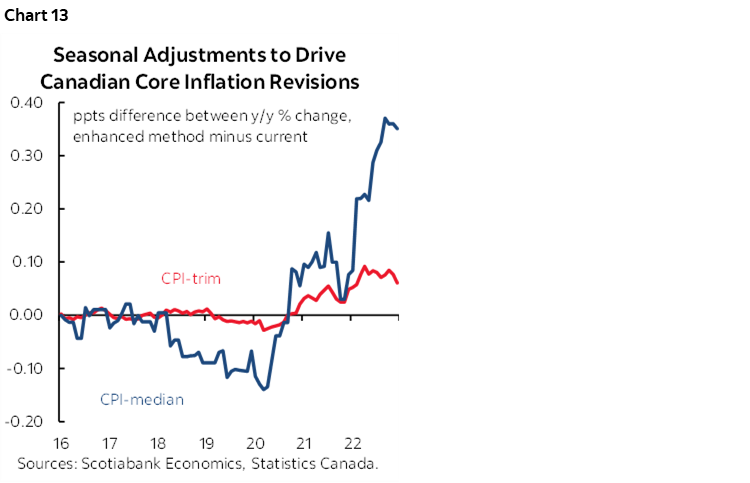
This effect could be somewhat meaningful especially on the weighted median measure. Statcan has already guided that the effects over the past seven years have altered monthly readings of trimmed mean CPI by between -0.028 and +0.092 ppts and altered monthly readings of weighted median CPI by between -0.14 and +0.37 ppts. As chart 13 shows, most of the upward revision to weighted median CPI will impact readings since last Spring. Taking into account these revisions to CPI-trimmed mean and CPI-weighted median will likely mean that their average of 5.15% y/y in December will probably be revised up a couple of tenths and then we’ll assess January’s fresh readings.
BoC Implications
What will all of this mean to the BoC? Not much, for now, but possibly more in subsequent meetings. The script is set into the March 8th statement that is likely to be short and sweet sans forecasts or presser until the next day’s standard speech after non-MPR statements this time to be delivered by SDG Rogers as she takes her turn. The statement is likely to reiterate some form of guidance that was in the final paragraph of the January statement and what Governor Macklem said in his recent Parliamentary testimony:
“This is a conditional pause—it is conditional on economic developments evolving broadly in line with our forecast. If economic developments are broadly in line with our forecast and inflation comes down as predicted, then we shouldn’t need to raise rates further. But if evidence begins to accumulate to show that inflation is not declining in line with our forecast, we are prepared to raise our policy rate further."
The BoC has nevertheless been surprised to the upside by developments since its decisions on January 25th. Canada generated another 150k jobs in January after a gain of about 70k the month before. Hours worked were up by 0.8% m/m SA in January and are tentatively tracking a gain of 2.9% q/q SAAR in Q1. If this holds, then since GDP is an identity defined as hours worked times labour productivity could grow significantly faster than the BoC’s 0.5% forecast. Key will be whether Canada is in another temporary soft patch for wage growth or whether the peak is past plus how productivity performs against the backdrop of terrible performance to date in the pandemic.
Very robust US macro indicators may also suggest that the BoC’s forecasts for the US economy face upside risk if this pattern continues. They include 517k jobs created in January plus an upward revision of 311k to cumulative job growth in 2022. Also add in a strong ISM-services report, very robust retail sales gain, strength in manufacturing output and persistent pressures on core CPI and core PPI price pressures. If this pattern persists then the BoC may need to revise up its US GDP forecast of just 0.5% y/y this year and back that into a more upbeat outlook for Canada given the trade connections.
This is a partial explanation of why the forecast bias remains skewed toward the possibility of further rate hikes and probably more than what markets are pricing. That said, my potato chip model conflicts with market pricing for the BoC. If the BoC deems it to be worthwhile to come back with additional tightening, then it’s unlikely to deliver only a quarter point and would either add more and/or lean toward an extended pause stretching into next year. This is on the theory that upon opening the bag, it’s practically an impossible feat to have just one chip and so before you know it you’re up 50–75 points and punching another hole in your belt.
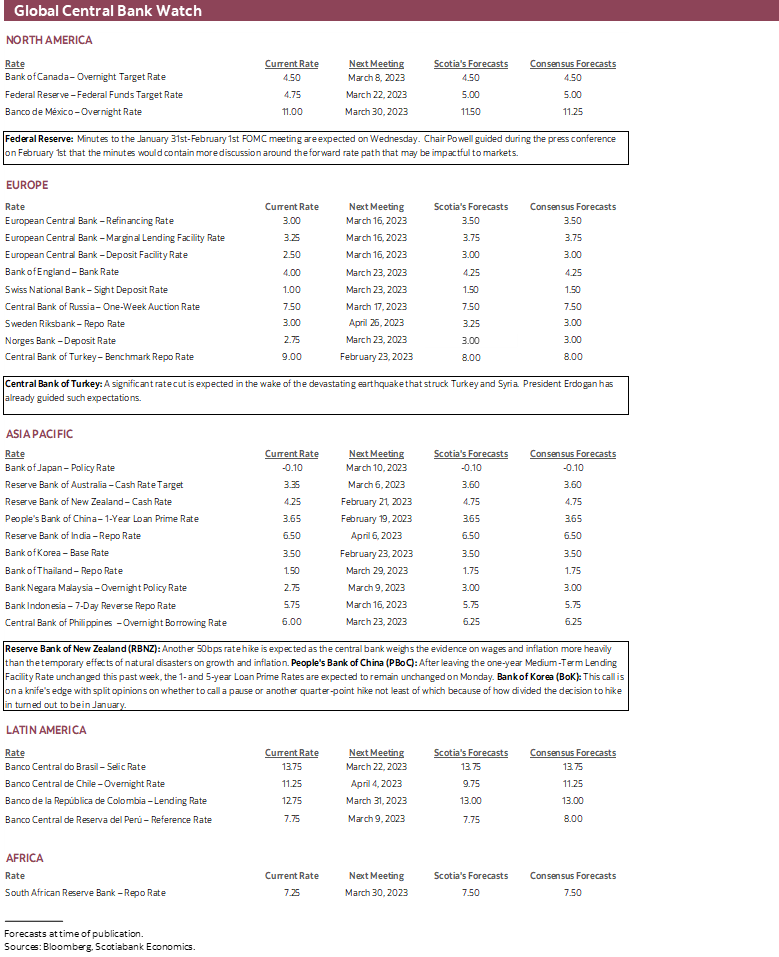
CENTRAL BANKS—THE FED’S PATH FORWARD
Fed meeting minutes will combine with a pair of Asia-Pacific central bank decisions.
FOMC Minutes—Path Guidance
Minutes to the FOMC meeting on January 31st – February 1st will be released on Wednesday at 2pmET. A recap of the communications that were offered on that day is available here. Frankly this round of minutes will rank up there as among the staler assessments in quite a while excluding minutes to meetings that were followed by major shocks. Since the meeting, we’ve learned that the job market is much tighter than previously understood and also received a round of more upbeat macroeconomic readings from ISM-services to vehicle sales and retail sales plus manufacturing output.
Nevertheless, a key sensitivity may be around what kind of discussion there was around the future policy bias. When asked about this during the press conference, Powell said “Wait for the minutes. The sense of the discussion was talking quite a bit about the path forward.” This could be a set up into the March meeting’s Summary of Economic Projections including the updated dot plot.
Mind you, with markets already priced for between 50–75bps of additional rate hikes topping out at 5 ¼% to 5 ½% it would take significantly greater hawkishness to impact pricing. If instead there is more emphasis upon setting up a future pause, then data since the meeting could declare the discussion to be less valid now.
RBNZ—A Rates Cyclone
Markets are priced for a 50bps hike on Tuesday evening (eastern time as always). At its last decision way back in November, the RBNZ hiked by 75bps to 4.25%, said it had considered a 100bps hike as an alternative, and indicated that further tightening was required.
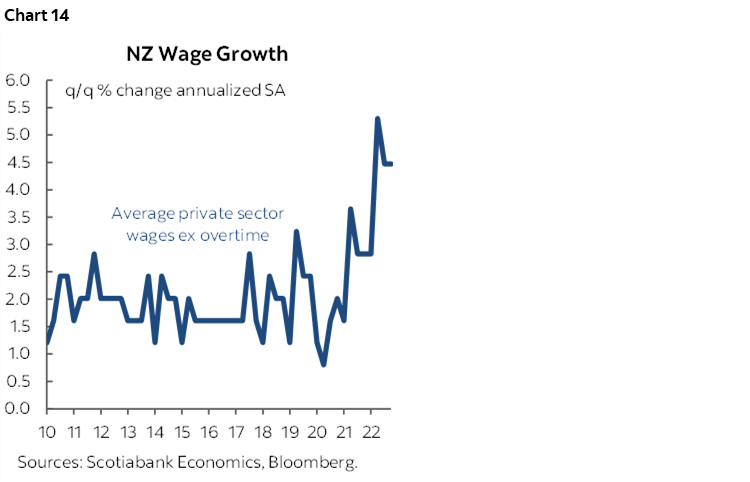
Since then, Q4 inflation surprised a little higher than expected at 1.4% q/q non-annualized (1.3% consensus) which kept the year-over-year rate at 7.2%. Q4 job growth fell a little shy of expectations at 0.2% q/q non-annualized but remained solid, while wage growth remains fairly high (chart 14). The fly in the ointment is whether Cyclone Gabrielle could dial back the size of the hike or suspend hikes. That might appear to be unlikely given that central banks tend to look through natural disasters because their negative effects on growth and positive effects on inflation are typically transitory.
Bank of Korea—Done Yet?
There is a split opinion in markets toward whether the BoK could offer another quarter-point hike or take a pass into Thursday. Part of the reason for the uncertainty stems from how tight the prior meeting’s vote was on January 13th when two Board members voted for a pause and half of the Board felt that the January hike should be the last one. Since then, however, core inflation moved higher to 5% y/y with headline inflation up to 5.2% y/y and hence further away from the BoK’s 2% target.
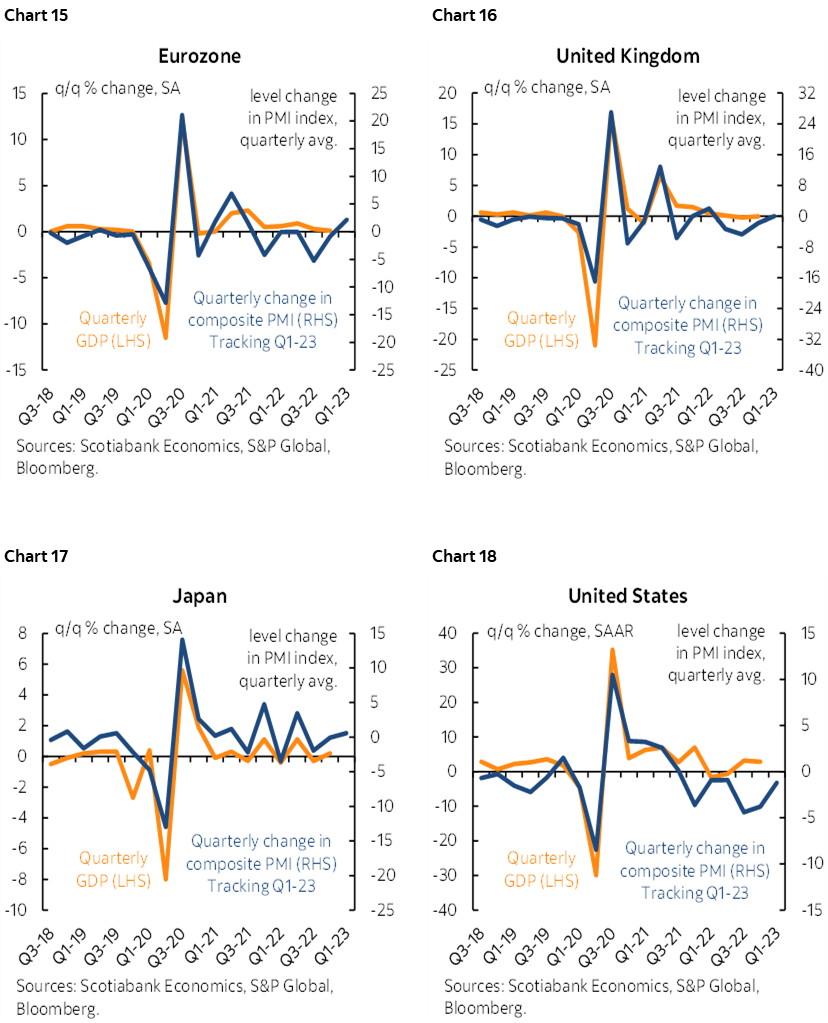
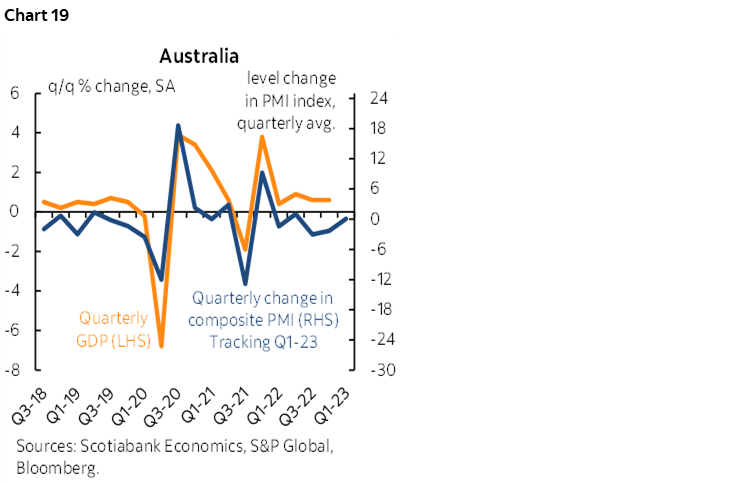
GLOBAL MACRO—PMIs TO INFORM WORLD GROWTH
The week’s marquee global releases will be a set of purchasing managers’ indices that get updated for February. Their correlations with GDP growth are shown in charts 15–19 which helps to understand why they serve as a guide to in-quarter growth expectations when tracking the world economy. Australia and Japan will kick it all off first on Monday, followed by the Eurozone and UK on Tuesday and then the US S&P PMIs (not the Fed’s preferred ISM-gauges) later that morning. Other sentiment gauges like Eurozone ZEW investor expectations (Tuesday), German IFO business confidence (Wednesday) and UK consumer confidence (Thursday) will play similar roles.
Canadian markets will start the week shut for Family Day on Monday and go straight into the next day’s CPI readings. A previously guided increase in retail sales during December will get buried behind CPI at the same time on Tuesday, but watch for details like how much of the ½% m/m rise was driven by higher prices versus higher volumes. CIBC kicks off the fiscal Q1 bank earnings season on Friday ahead of the deluge of bank earnings that arrive the following week.
There will be a series of potentially impactful US macro reports:
- The Fed’s preferred PCE inflation gauges arrive on Friday for January. Headline PCE inflation is likely to rise at a slightly slower pace than headline CPI’s 0.5% m/m gain and ditto for core PCE inflation ex-food and energy that should rise a little more softly than the 0.4% m/m core CPI gain.
- US consumption probably grew by around 1½% m/m in January (Friday) given the strong gain in retail sales and after tacking on services spending that is underrepresented in retail sales. That could mean that nominal spending is tracking a Q1 gain of over 5% q/q at a seasonally adjusted and annualized rate. After subtracting inflation, consumption could be tracking well over 3% growth in Q1. That, in turn, could make this yet another quarter in which consensus went in with expectations set too low and chased GDP higher.
- US personal income growth probably grew toward 1% m/m in January on a combination of higher wages and salaries and higher social security payments (Friday).
- US Q4 GDP will be revised on Thursday after the initial estimate of 2.9%. A reading around 3% is likely.
- US housing data will include an expected gain in existing home sales during January (Tuesday) given a slight up-tick in pending home sales, plus another possible gain in new home sales given a another pick-up in model home foot traffic.
Eurozone CPI revisions and details will help ECB watchers better understand drivers of inflationary pressures on Thursday.
Peru’s economy probably paid somewhat of a price for protests and disruptions that will be informed by Q4 GDP estimates on Thursday.
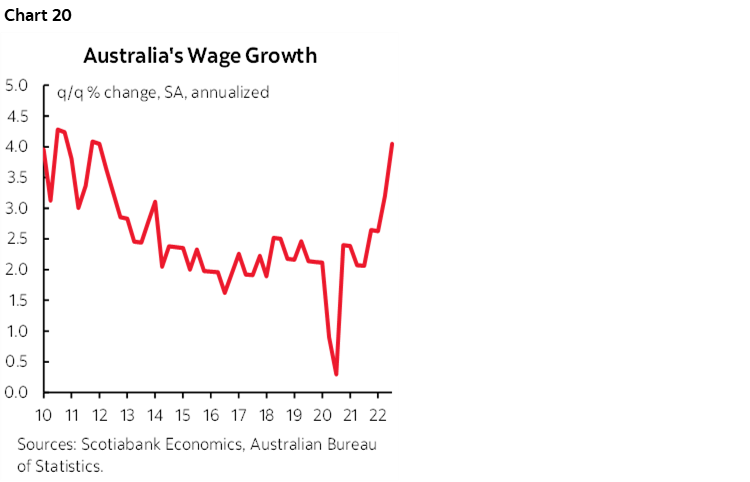
Australian Q4 wage growth will be key to RBA watchers on Tuesday and after RBA minutes the day before (chart 20).
Other global readings will include CPI updates from Japan (Thursday), Sweden (Monday) and Malaysia (Thursday). Mexico reports retail sales for December on Tuesday.
DISCLAIMER
This report has been prepared by Scotiabank Economics as a resource for the clients of Scotiabank. Opinions, estimates and projections contained herein are our own as of the date hereof and are subject to change without notice. The information and opinions contained herein have been compiled or arrived at from sources believed reliable but no representation or warranty, express or implied, is made as to their accuracy or completeness. Neither Scotiabank nor any of its officers, directors, partners, employees or affiliates accepts any liability whatsoever for any direct or consequential loss arising from any use of this report or its contents.
These reports are provided to you for informational purposes only. This report is not, and is not constructed as, an offer to sell or solicitation of any offer to buy any financial instrument, nor shall this report be construed as an opinion as to whether you should enter into any swap or trading strategy involving a swap or any other transaction. The information contained in this report is not intended to be, and does not constitute, a recommendation of a swap or trading strategy involving a swap within the meaning of U.S. Commodity Futures Trading Commission Regulation 23.434 and Appendix A thereto. This material is not intended to be individually tailored to your needs or characteristics and should not be viewed as a “call to action” or suggestion that you enter into a swap or trading strategy involving a swap or any other transaction. Scotiabank may engage in transactions in a manner inconsistent with the views discussed this report and may have positions, or be in the process of acquiring or disposing of positions, referred to in this report.
Scotiabank, its affiliates and any of their respective officers, directors and employees may from time to time take positions in currencies, act as managers, co-managers or underwriters of a public offering or act as principals or agents, deal in, own or act as market makers or advisors, brokers or commercial and/or investment bankers in relation to securities or related derivatives. As a result of these actions, Scotiabank may receive remuneration. All Scotiabank products and services are subject to the terms of applicable agreements and local regulations. Officers, directors and employees of Scotiabank and its affiliates may serve as directors of corporations.
Any securities discussed in this report may not be suitable for all investors. Scotiabank recommends that investors independently evaluate any issuer and security discussed in this report, and consult with any advisors they deem necessary prior to making any investment.
This report and all information, opinions and conclusions contained in it are protected by copyright. This information may not be reproduced without the prior express written consent of Scotiabank.
™ Trademark of The Bank of Nova Scotia. Used under license, where applicable.
Scotiabank, together with “Global Banking and Markets”, is a marketing name for the global corporate and investment banking and capital markets businesses of The Bank of Nova Scotia and certain of its affiliates in the countries where they operate, including; Scotiabank Europe plc; Scotiabank (Ireland) Designated Activity Company; Scotiabank Inverlat S.A., Institución de Banca Múltiple, Grupo Financiero Scotiabank Inverlat, Scotia Inverlat Casa de Bolsa, S.A. de C.V., Grupo Financiero Scotiabank Inverlat, Scotia Inverlat Derivados S.A. de C.V. – all members of the Scotiabank group and authorized users of the Scotiabank mark. The Bank of Nova Scotia is incorporated in Canada with limited liability and is authorised and regulated by the Office of the Superintendent of Financial Institutions Canada. The Bank of Nova Scotia is authorized by the UK Prudential Regulation Authority and is subject to regulation by the UK Financial Conduct Authority and limited regulation by the UK Prudential Regulation Authority. Details about the extent of The Bank of Nova Scotia's regulation by the UK Prudential Regulation Authority are available from us on request. Scotiabank Europe plc is authorized by the UK Prudential Regulation Authority and regulated by the UK Financial Conduct Authority and the UK Prudential Regulation Authority.
Scotiabank Inverlat, S.A., Scotia Inverlat Casa de Bolsa, S.A. de C.V, Grupo Financiero Scotiabank Inverlat, and Scotia Inverlat Derivados, S.A. de C.V., are each authorized and regulated by the Mexican financial authorities.
Not all products and services are offered in all jurisdictions. Services described are available in jurisdictions where permitted by law.