Next Week's Risk Dashboard
• Russia-Ukraine tensions loom over markets
• FOMC minutes: Stale, but still useful guidance?
• Canadian inflation: a record overshoot
• UK jobs, CPI to inform risk of 50bps
• Aussie jobs and the RBA
• Want low inflation? Move to China
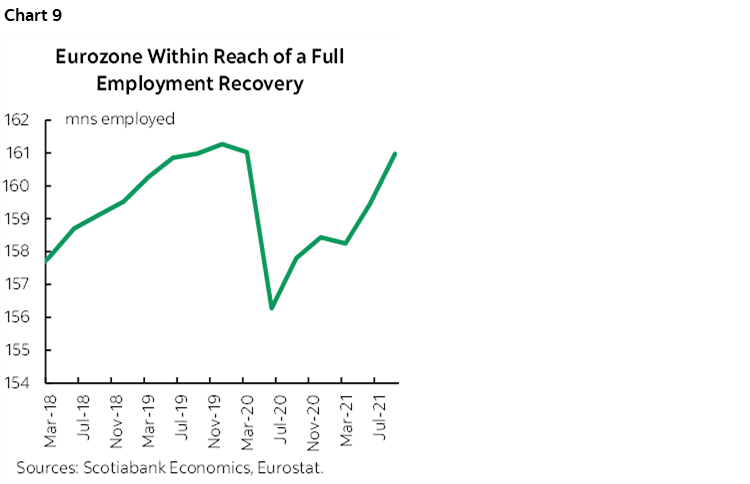
• A full jobs recovery in the Eurozone?
• Consumers rebounding in the US, UK and maybe Canada?
• Indian inflation could break the RBI’s bands
• Japan’s rebound
• CBs: Turkey, Philippines to hold
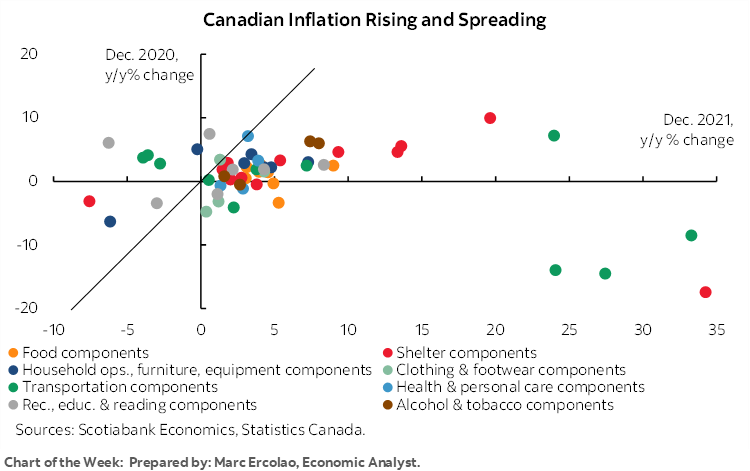
Chart of the Week
GEOPOLITICAL RISK—LESSONS FROM 2014
As this publication is going to press there has been an escalation of warnings that President Putin may have given the orders to his military to invade Ukraine as soon as this coming week. President Biden will be speaking with Putin on Saturday.
Of course, any sensible person likely prefers peace as the first order of focus, but the immediate focus is upon potential implications for markets and also central bank policy stances including the Fed’s. In keeping with the line that history has a tendency of repeating itself, we could look to lessons drawn from when Russia invaded the Crimean Peninsula in 2014 with the obvious lack of any assurances that this time will necessarily repeat that experience.
Recall that tensions intensified over February through March in 2014. The buildup of tensions and the ensuing invasion drove a brief rally in the US 10-year Treasury note from a peak of 3.03% at the end of 2013 to about 2.58% by early February before stabilising in a 2.45%–2.6% range until June. The Federal Reserve had commenced tapering bond purchases at the December 2013 meeting and was unwavering in its commitment toward continued tapering over 2014 until net purchases concluded toward the end of the year. Lower Treasury yields may have incited this policy stance given they were deemed unsuitable to the conditions of the domestic economy at the time.
There was a similarly mild and short-lived response in stocks and at a time of many other developments. The S&P500 sold-off by under 6% from late January through early February 2014 and then went on to rally for the remainder of the year with its share of ups and downs along the way.
These market moves weren’t even all about Russia-Ukraine tensions. They may have only been minimally driven by such circumstances. Recall that oil prices collapsed later in the year as the Saudis sought to drive US shale producers out of business. Emerging markets were in some turmoil. Chair Yellen dropped her “six months” guidance for how soon the Fed could commence hiking the policy rate after ending bond purchases. ISIS invaded Iraq in June of 2014.
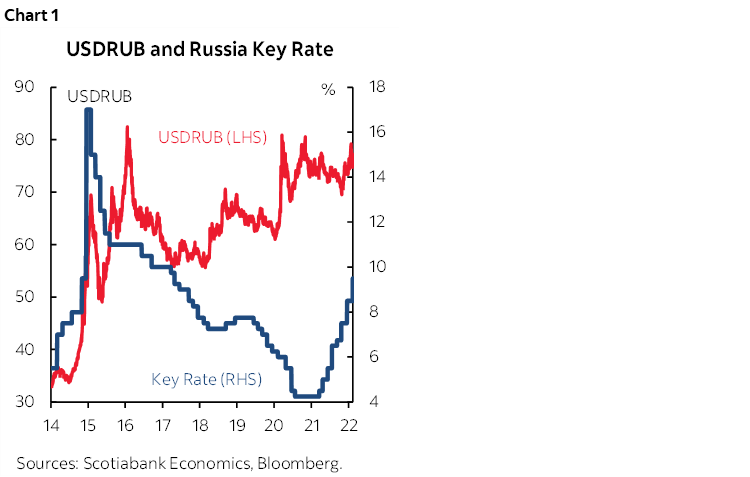
But the possible takeaway is that the potential return of this geopolitical risk could be a tactical and relatively short-lived trade that fails to knock the Federal Reserve off course while it remains wedded to achieving its dual mandate. Today’s very different circumstances including much higher inflation are likely to solidify that focus barring much worse outcomes this time. There are clear limits to this thinking that could turn out worse. I’d rather not at this point entertain risk of a fuller conflict that draws in a NATO-led confrontation! Until we have greater information, it may be better to assume a near replay of 2014 in which case Russia gets heavily sanctioned and the ruble eventually collapses and subsequently drives imported inflation much higher. That scenario in 2014–15 drove the Russian central bank to hike its key rate from 5.5% at the start of 2014 to a peak of 17% by the end of 2014 (chart 1). The Russian economy achieved no growth in 2014 and shrank by 2% in 2015.
The overall conclusion based on the 2014 experience is that Russia may only shoot itself in the foot in destroying its own economy, global market effects could be brief and outweighed by other considerations, at least the Fed may not be blown off course although the ECB may be a different matter, and tactical trades may rule, like Russian versus Canadian wheat futures or cross currency bets.
Nevertheless, differences to 2014 include the facts that Russia’s military build-up appears to be much larger this time than in 2014 and both Europe and the US appear to be much more supportive militarily. Whether the net effect raises risk, or lowers it given a stronger counter presence is highly uncertain.
CENTRAL BANKS—CLUES IN THE FOMC MINUTES?
Markets may get further insights into the Federal Reserve’s potential policy decisions at the March 15th – 16th FOMC meeting when minutes to the January 25th–26th meeting arrive on Wednesday. A recap of that meeting is here. There are three main considerations to monitor and in each case by noting the central tendency of beliefs across the committee that is typically conveyed with the Fed’s use of language that connotes frequency of opinions expressed (one, a couple, a few, some, several, many, most, generally, almost all, all, etc.).
1. Size and pace
A decent shot at a 50bps hike in March is significantly priced. When Chair Powell was asked during his last press conference whether hikes larger than 25bps at a time and front-loading lift-off are possibilities, he mostly ducked the questions and that was one reason why there was a bond sell-off that day. An experienced central banker seeking to manage markets and tamp down such speculation if he had the conviction to do so would have probably leaned against such fears or sounded circumspect with two-sided guidance. The fact that he did not do so and instead sounded wishy-washy didn’t go over so well.
That might have been because a) he simply didn’t know, or b) he wanted to preserve optionality around such decisions, or c) the FOMC as a group did not grant the Fed Chair authorization to pre-commit one way or the other. What leaned toward the latter scenario was Powell’s remark that “We have not made these decisions on the size of hikes. We fully appreciate that this is a different situation” than back in 2015–18 when the Fed used the slow-drip pace of hikes. The minutes may shed further light on this issue in a way that informs the magnitude of a likely rate hike in March and how a quicker pace of tightening may be reflected in the upcoming dot plot given Powell’s guidance on “additional increases that we will reconsider at the March meeting.”
2. Forecast bias
Powell indicated at the January press conference that “I’d be inclined to raise my core PCE forecast by a few tenths today” compared to his contribution to the FOMC’s December Summary of Economic Projections. Watch for a further discussion across all FOMC officials that intimates the consensus bias.
3. Roll-off assumptions
Chair Powell had said during his confirmation testimony in January that maturing securities on the Fed’s balance sheet could be allowed to roll-off “later” this year. The March communications stated that roll-off “will commence after the process of increasing the target range for the federal funds rate has begun.” This could be just semantics, but does the shift from ‘later’ to ‘after’ imply a sooner move toward allowing partial roll-off of maturing securities as soon as Q2 following the planned end of net Treasury and MBS purchases in March?
In any event, there is a limit to which any policy inferences drawn from the January meeting’s minutes may be relevant to formulating expectations for the March meeting. The minutes will be significantly stale on arrival since we’ve since had a blow-out jobs report (+467k in January with +709k of revisions to the prior two months) and a stronger-than-expected CPI inflation report (7.5% y/y).
Because of this, markets will also be looking for clues in the form of other Fed-speak. This will include two appearances by the hawkish and voting St. Louis Fed President Bullard (Monday, Thursday), Cleveland’s voting President Mester (Thursday), Governor Waller (always voting, Friday), NY Fed President Williams (always voting, Friday), Chicago’s Evans (nonvoting, Friday), and Minneapolis President Kashkari (nonvoting Wednesday).
Given implications not only for the ECB but also the global carry trade, comments from ECB officials will be closely followed including President Lagarde (Monday), and six other speakers during the week.
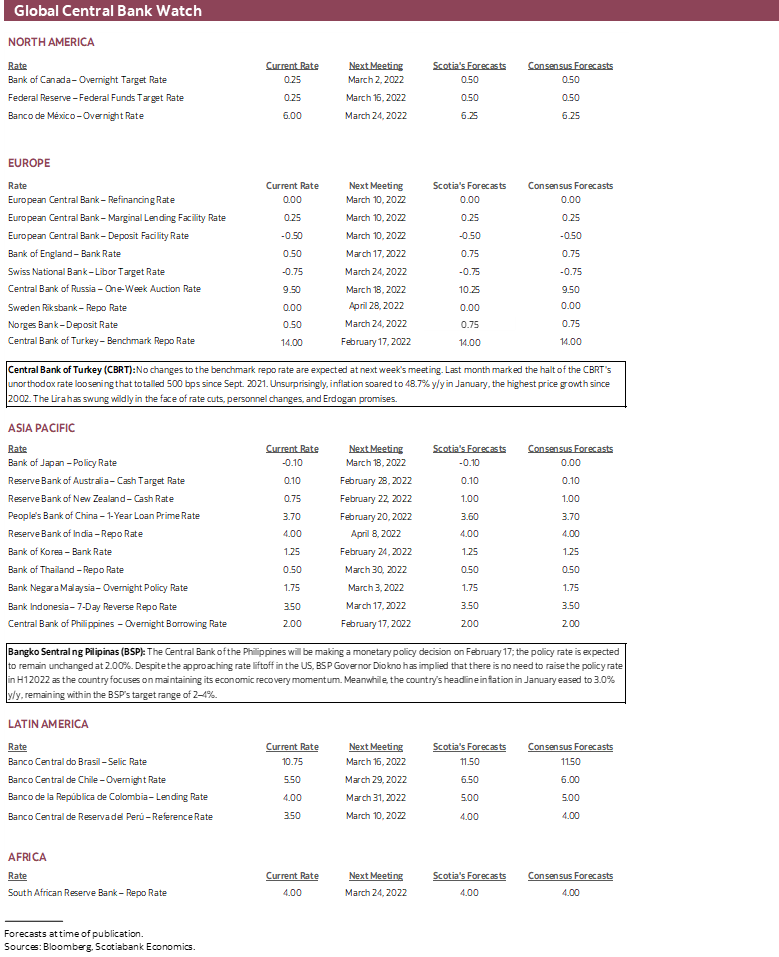
Norges Bank watchers will follow Governor Oystein Olsen’s remarks on Thursday. Central banks in Turkey and the Philippines are expected to remain on hold on Thursday.
CANADIAN INFLATION—A RECORD OVERSHOOT OF THE 2% TARGET
Canada updates CPI inflation for January on Wednesday. My estimate is 0.7% m/m NSA and 5.0% y/y. That would be the biggest overshoot of the Bank of Canada’s 2% inflation target since the BoC’s earliest days of inflation targeting.
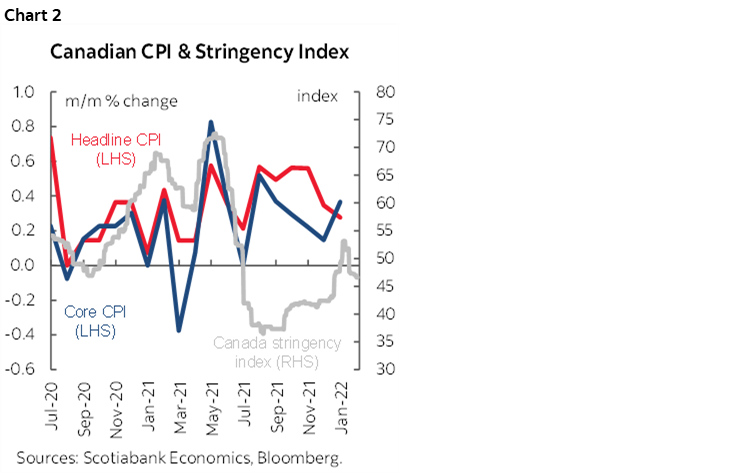
One consideration is how the tighter COVID-19 restrictions may impact inflation. As chart 2 demonstrates, Canada has tended to see inflation accelerate when COVID-19 restrictions intensify as measured by stringency indices. I’ve therefore factored in a premium that is consistent with prior experiences.
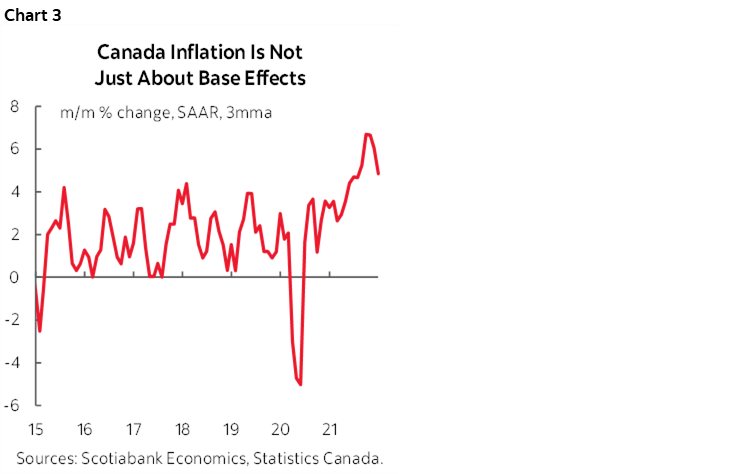
Otherwise, January tends to be a significant up-month for seasonal price pressures given considerations such as rolling out new lines of merchandise. That’s important because the Canadian consensus measures m/m seasonally unadjusted inflation. Year-ago base effects should knock the year-over-year inflation rate somewhat lower, but the focus should remain upon hot annualized m/m inflation rates (chart 3). Gasoline prices edged somewhat higher as well.
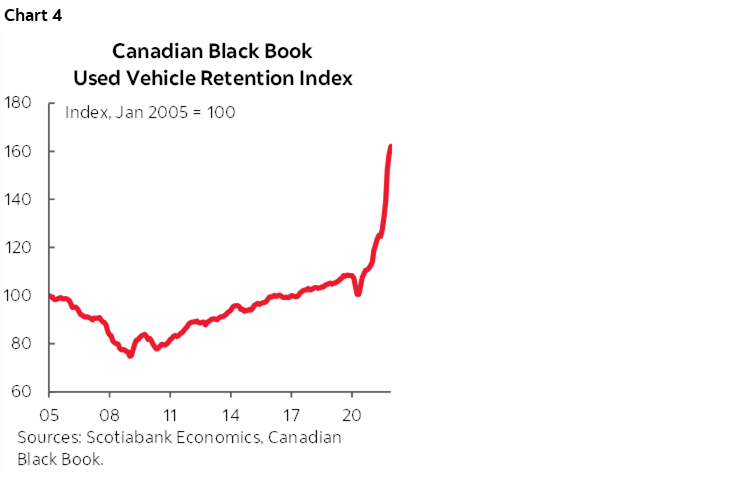
Also recall that the temptation to compare Canadian to US CPI inflation needs to control for notable methodological differences. For one thing, Canadian CPI excludes used vehicle prices. They were up by another 2.3% m/m using the Black Book measure and 44% y/y which would add 1.8 percentage points to Canadian headline CPI if we used a similar weight to how used vehicles are included in US CPI (chart 4). The exact weight that should be used in the Canadian context is uncertain and so is the exact measure of used vehicle prices but no others are available on a monthly basis. The general point is that inflation including used vehicle prices would probably be at least in the 6–7% y/y range in Canada if we captured used vehicles. Then there are the other more customary debates over the big differences between how Canada captures housing compared to US CPI.
The Bank of Canada probably wouldn’t be surprised by such a move higher given that the January MPR indicated they expect inflation “to remain close to 5% over the first half of 2022.” The debate that will then ensue is the degree to which year-over-year inflation may begin to ebb and whether that’s the appropriate yardstick in any event versus month-over-month annualized inflation over the fuller cycle ahead.
GLOBAL INDICATORS TO INFORM RISKS TO MONETARY POLICY
Key macro reports on tap for the coming week will inform debates on topics such as the potential magnitude of the Bank of England’s next probable rate hike, the PBOC’s appetite for further easing measures, the RBA’s continued progress on maximum employment and potential wage pressures, whether the ECB faces accelerating wage pressures in a full employment recovery, and whether the RBI is further behind inflation risk.
Want low inflation? Move to China. It’s pretty much about the only place on the planet that is not experiencing a surge of inflationary pressures. The latest estimates will land on Tuesday evening (eastern time as always here) and the headline rate is expected to decelerate again toward 1% y/y. If base effects mattered, then they would be pushing the year-over-year reading higher given how depressed inflation was at the start of last year. Another deceleration may further fan calls for additional monetary policy stimulus. Producer price inflation will also be updated that day and since it follows oil and other commodity prices it may soon face renewed upward pressure given the rally in oil prices since late last year.
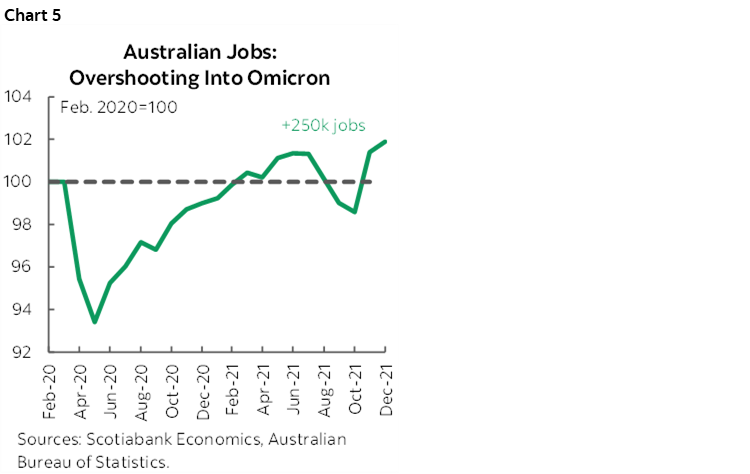
Australia updates jobs for the month of January on Wednesday. Australia’s labour market is among the leaders of the employment recovery across developed economies and is sitting about 250k jobs above its pre-pandemic peak (chart 5). Any further job gain in January would be a sign of excess labour market strength as a flat reading is expected. The hit from the omicron wave should show up more clearly as a temporary decline in hours worked. As is the case with many global economies, we may see Australia’s labour market enter a phase of temporary volatility, as virus infections peaked in mid-January.
A few top-shelf macro releases land in the UK next week, with employment figures leading on Tuesday, CPI on Wednesday, and retail sales on Friday. Readings should help to inform policy decisions at the BoE’s next meeting in March. The BoE signalled at its last meeting that interest rates could rise again next month, with the biggest surprise being the 5–4 vote that almost tipped the MPC to deliver a 50bps hike. An additional round of releases could tip this balance including:
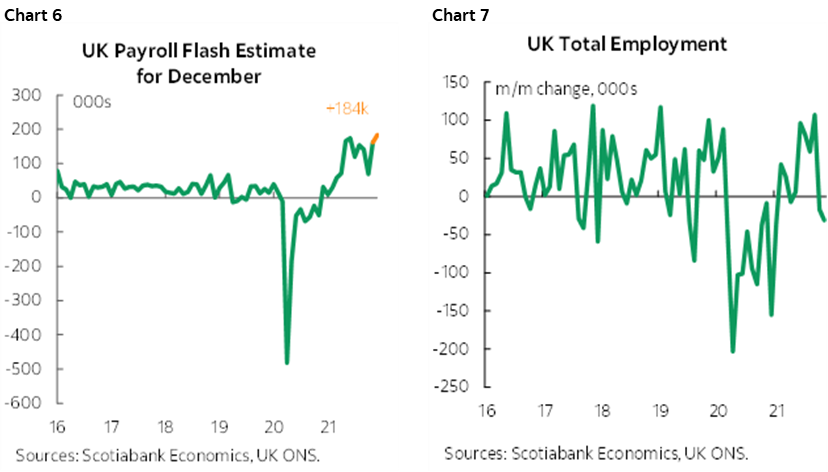
- The ILO unemployment rate for the three months ending December is expected to remain steady at 4.1%. Flash payroll data published by the ONS in advance of LFS data pointed to a reading of +184k jobs for the month of December (chart 6), subject to revision upon the January payrolls released on Tuesday. While the m/m change in total employment has slowed a touch in recent months (chart 7), the labour market is still showing signs of tightness with job vacancies remaining heightened.
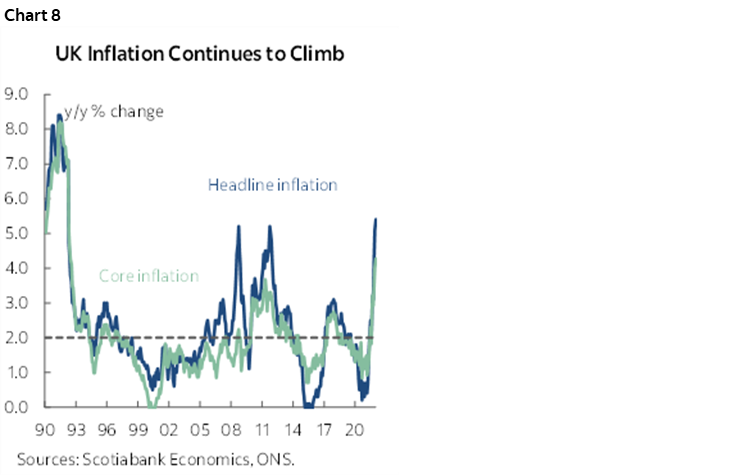
- The main indicator to watch is CPI landing on Wednesday as the UK comes off fresh 20-year highs (chart 8). December headline and core inflation came in at 5.4% and 4.3% y/y, respectively. The expectation is for January inflation to hold steady or slightly dip (5.3–5.4% y/y) before accelerating until April which should mark the peak of price pressures.
Other European releases will be pretty light. The opening round of monthly sentiment surveys that can collectively inform GDP tracking commences with the ZEW investor expectations measure for February (Tuesday) ahead of the following week’s IFO confidence and PMI readings. Q4 employment growth (Tuesday) may fully recapture jobs lost due to the pandemic with even just a modest further gain (chart 9).
Global consumers may have vaulted back onto the scene to start the new year off at least in the US, UK and Canada. Because of a large gain in vehicle sales during January, US retail sales probably posted a very strong gain last month (Friday); I’ve estimated it at +3.5% m/m with a 21% rise in new vehicle sales potentially adding about three-percentage points to overall growth in retail sales on its own. Canadian retail sales have already been guided to have declined by 2.1% m/m in December and the final estimate may land lower, but watch January’s flash guidance (Friday). UK retail sales are expected to rebound in January after the 3.7% m/m drop in December.
Canada’s other calendar-based risks will otherwise be quite low over the coming week. That will likely maintain the focus upon evolving assessments of the pandemic protests, the responses by the authorities and rolling evaluations of the economic effects. Housing releases will inform momentum at the margin as the main focal point. Housing starts (Tuesday) may have risen during January on the back of prior increases in the volume of building permits and after the prior month’s release was distorted by a big drop in volatile multiples. Existing home sales during January will try to make it five in a row in terms of sales increases, though the start of the year is typically skewed toward masochists moving in -30C weather. Manufacturing shipments during December (Wednesday) should end the year on another bright note given advance guidance from Statistics Canada that points toward a mild gain.
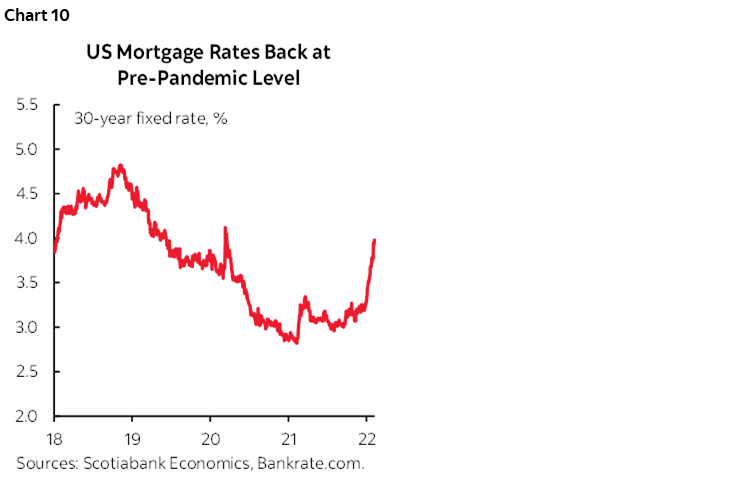
Other US developments will principally focus upon the housing and industrial complexes. Housing starts should rise in January’s estimate given strong gains in permits (Thursday). Existing home sales, however, could follow the decline in pending home sales given that they turn up as completed resales generally within 30–90 days. Economy watchers should be braced for future weakness in home sales given the speed with which mortgage rates have risen and particularly the bellwether 30-year rate that has suddenly fully normalized toward pre-pandemic levels (chart 10). Industrial output during January (Wednesday) may post mild growth but with downside risk given the weakening in the ISM-manufacturing-production subindex. The start of another round of regional manufacturing reports on the path to the next ISM-manufacturing gauge will commence on Tuesday with the Empire measure, followed by the Philly Fed’s gauge on Thursday.
Indian inflation during January is on tap for Monday. CPI is expected to climb by 6% y/y (5.6% prior) for a seven-month high which would put it at or above the upper limit of the RBI’s 2–6% inflation target range. A further upside surprise could amplify the debate over whether the RBI is correct in emphasizing growth over inflation risk.
Japan’s economy probably rebounded in Q4 by posting annualized growth of ~6% compared to the prior quarter’s contraction of 3.6% (Monday). Accelerating consumption should figure fairly prominently. Fear not, Japanese inflation is still going nowhere fast as should be evident in the January figures later in the week.
DISCLAIMER
This report has been prepared by Scotiabank Economics as a resource for the clients of Scotiabank. Opinions, estimates and projections contained herein are our own as of the date hereof and are subject to change without notice. The information and opinions contained herein have been compiled or arrived at from sources believed reliable but no representation or warranty, express or implied, is made as to their accuracy or completeness. Neither Scotiabank nor any of its officers, directors, partners, employees or affiliates accepts any liability whatsoever for any direct or consequential loss arising from any use of this report or its contents.
These reports are provided to you for informational purposes only. This report is not, and is not constructed as, an offer to sell or solicitation of any offer to buy any financial instrument, nor shall this report be construed as an opinion as to whether you should enter into any swap or trading strategy involving a swap or any other transaction. The information contained in this report is not intended to be, and does not constitute, a recommendation of a swap or trading strategy involving a swap within the meaning of U.S. Commodity Futures Trading Commission Regulation 23.434 and Appendix A thereto. This material is not intended to be individually tailored to your needs or characteristics and should not be viewed as a “call to action” or suggestion that you enter into a swap or trading strategy involving a swap or any other transaction. Scotiabank may engage in transactions in a manner inconsistent with the views discussed this report and may have positions, or be in the process of acquiring or disposing of positions, referred to in this report.
Scotiabank, its affiliates and any of their respective officers, directors and employees may from time to time take positions in currencies, act as managers, co-managers or underwriters of a public offering or act as principals or agents, deal in, own or act as market makers or advisors, brokers or commercial and/or investment bankers in relation to securities or related derivatives. As a result of these actions, Scotiabank may receive remuneration. All Scotiabank products and services are subject to the terms of applicable agreements and local regulations. Officers, directors and employees of Scotiabank and its affiliates may serve as directors of corporations.
Any securities discussed in this report may not be suitable for all investors. Scotiabank recommends that investors independently evaluate any issuer and security discussed in this report, and consult with any advisors they deem necessary prior to making any investment.
This report and all information, opinions and conclusions contained in it are protected by copyright. This information may not be reproduced without the prior express written consent of Scotiabank.
™ Trademark of The Bank of Nova Scotia. Used under license, where applicable.
Scotiabank, together with “Global Banking and Markets”, is a marketing name for the global corporate and investment banking and capital markets businesses of The Bank of Nova Scotia and certain of its affiliates in the countries where they operate, including; Scotiabank Europe plc; Scotiabank (Ireland) Designated Activity Company; Scotiabank Inverlat S.A., Institución de Banca Múltiple, Grupo Financiero Scotiabank Inverlat, Scotia Inverlat Casa de Bolsa, S.A. de C.V., Grupo Financiero Scotiabank Inverlat, Scotia Inverlat Derivados S.A. de C.V. – all members of the Scotiabank group and authorized users of the Scotiabank mark. The Bank of Nova Scotia is incorporated in Canada with limited liability and is authorised and regulated by the Office of the Superintendent of Financial Institutions Canada. The Bank of Nova Scotia is authorized by the UK Prudential Regulation Authority and is subject to regulation by the UK Financial Conduct Authority and limited regulation by the UK Prudential Regulation Authority. Details about the extent of The Bank of Nova Scotia's regulation by the UK Prudential Regulation Authority are available from us on request. Scotiabank Europe plc is authorized by the UK Prudential Regulation Authority and regulated by the UK Financial Conduct Authority and the UK Prudential Regulation Authority.
Scotiabank Inverlat, S.A., Scotia Inverlat Casa de Bolsa, S.A. de C.V, Grupo Financiero Scotiabank Inverlat, and Scotia Inverlat Derivados, S.A. de C.V., are each authorized and regulated by the Mexican financial authorities.
Not all products and services are offered in all jurisdictions. Services described are available in jurisdictions where permitted by law.