Next Week's Risk Dashboard
- Fun with holidaynomics
- Fed chair appointment could come at any moment
- So could the SCOTUS IEEPA tariff decision
- Key events on the 2026 calendar
- Stumbling US job market, the Fed, fiscal policy and recession risk in 2026
- Canada’s economy: down and up?
- US data catch-up includes GDP
- FOMC minutes likely to be stale on arrival
- Japan’s Christmas Day data dump
- China PMIs to inform slowing
- Global indicators
Chart of the Week
Merry Christmas, happy holidays and here’s to wishing the best of the new year to our clients, staff, friends and families!
Barring totally unexpected developments, this holiday period should be calmer than last year’s, although fingers are crossed. Recall that at this time last year we were dealing with the coming reimposition of the US debt ceiling, the likelihood of a government shutdown over the holidays that was narrowly avoided by a temporary funding deal on December 21st, and turmoil in the Canadian government after Finance Minister Freeland resigned and speculation mounted PM Trudeau would resign, which he did on January 6th. That pretty much set the tone for what was to come in a tumultuous 2025!
It should be quieter this time. This two-week edition of the Global Week Ahead addresses expected developments.
But before we get to all of that, let’s have a bit of fun with some holidaynomics including a semi-serious point or two along the way.
A Santa Rally?
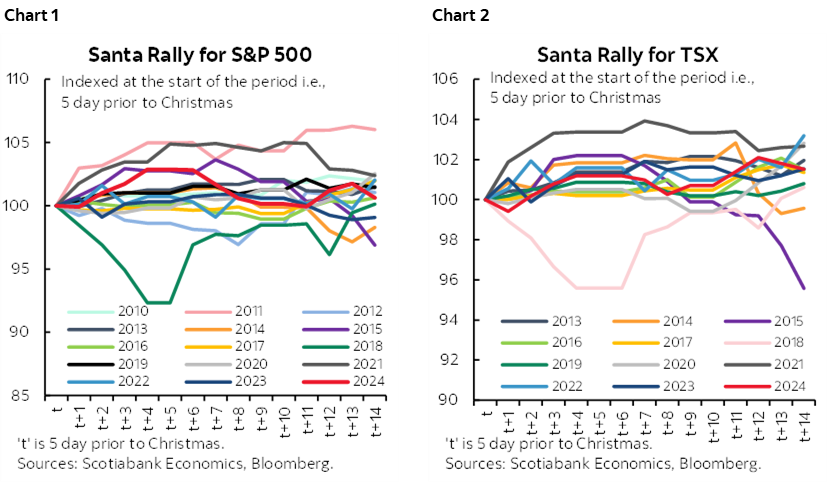
Wondering what to do as an investor over this period? You’re not alone. Staying invested is the usual advice in light of the moderate evidence of a Santa Rally effect on stocks. Then be nimble into the risks that 2026 may bring. There are plenty of academic pieces on the topic with conflicting evidence. Charts 1 and 2 are simpler, but without controlling for various other effects and without measuring whether stocks materially outperform at this time of year compared to other times of the year. All it shows is that stocks are more likely to go up than down over this period despite lower volumes, fewer trading catalysts and with more market participants away from work.
Affordability Hits Christmas!
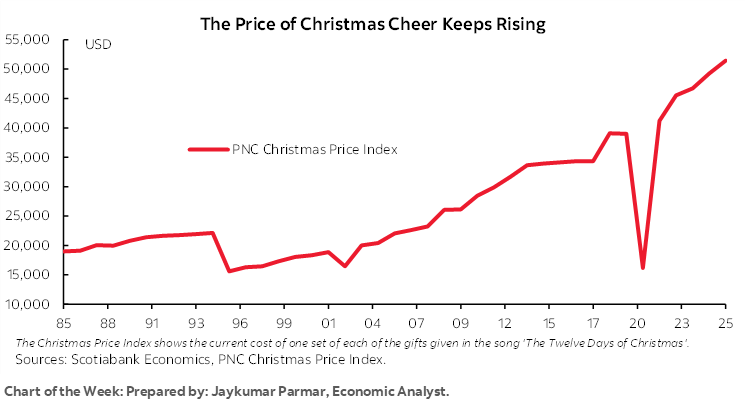
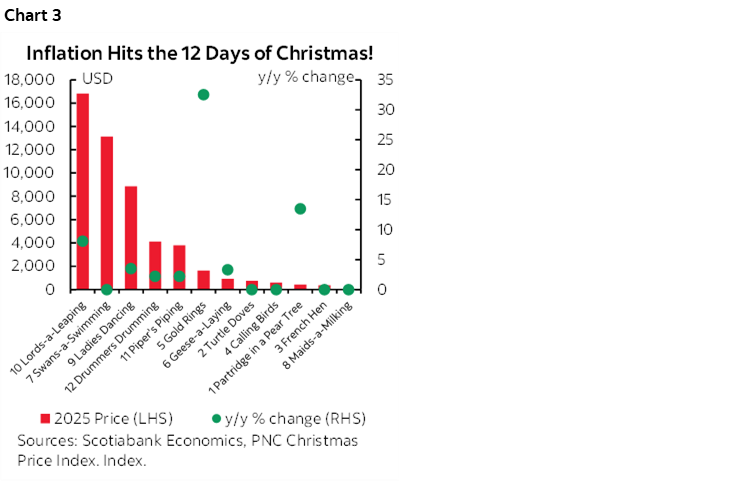
No inflation in the US? The humorous folks behind chart 3 beg to differ. Each year, they price out the cost of the twelve days of Christmas. Christmas will cost about 4½% more this year than last especially for folks with unusual tastes. Apparently five gold rings shot up 33% this year which is consistent with what happened with gold prices in general. Second place was the partridge in a pear tree, up 14%.
Stay Home
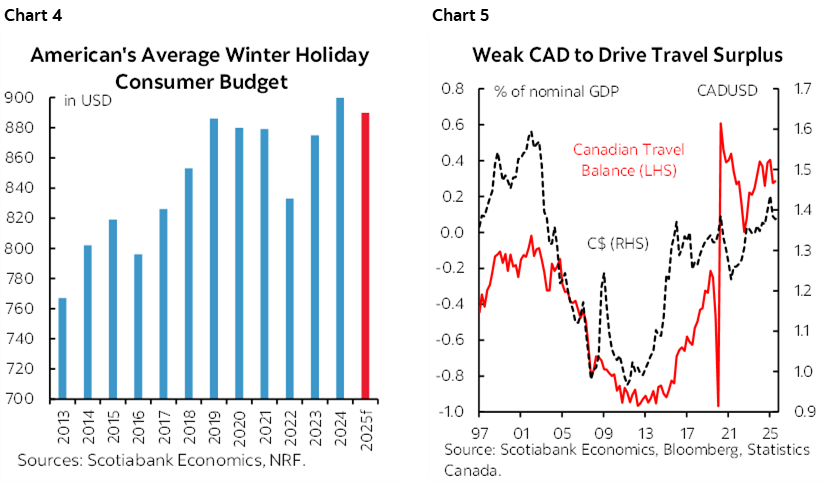
Thinking of travelling internationally? Maybe you want to see friends and at least some of the relatives abroad? Great, if you have USD as indicated by American travel budgets although they are slightly lower this year (chart 4). Not so great otherwise and that’s true for many currencies and countries given the broadly based strength of the USD. Chart 5 is one example in that it shows how the weak Canadian dollar is driving an increasingly positive surplus in the international travel account. In other words, it entices more people abroad—in this case particularly the US—to travel to Canada and discourages Canadians from travelling abroad and particularly to the US. Canada is a price-sensitive travel destination. Trump may think Canada is ripping off the US, but mainly it’s the lagging effects of strong dollar policies of successive US administrations that explains much of this plus an extra something from the ticked off factor.
Less Expensive Headaches
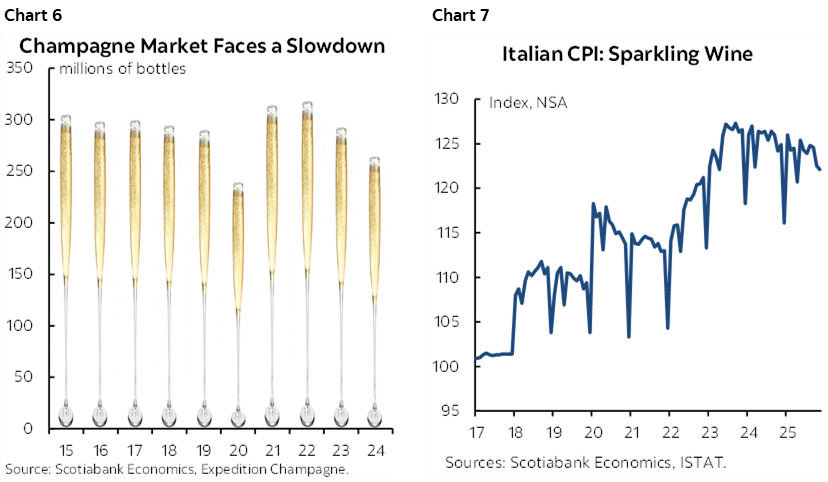
Like to imbibe in the bubblies over the holidays? Well, you’re an increasingly rare breed of person judging by the statistics, at least if you like the ‘authentic’ stuff. Champagne sales volumes (real champagne, according to France) have been falling in recent years measured by millions of bottles (chart 6). Part of the reason for this is that other bubblies, like prosecco, have risen to compete against the authentic stuff over the years. Nevertheless, bubblies in general—even the stuff that’s not allowed to be called champagne—are shaking off the post-pandemic price surge with chart 7 showing the example of sparkling wine in Italian CPI.
Demand Driving Prices for Candy — and Dentists
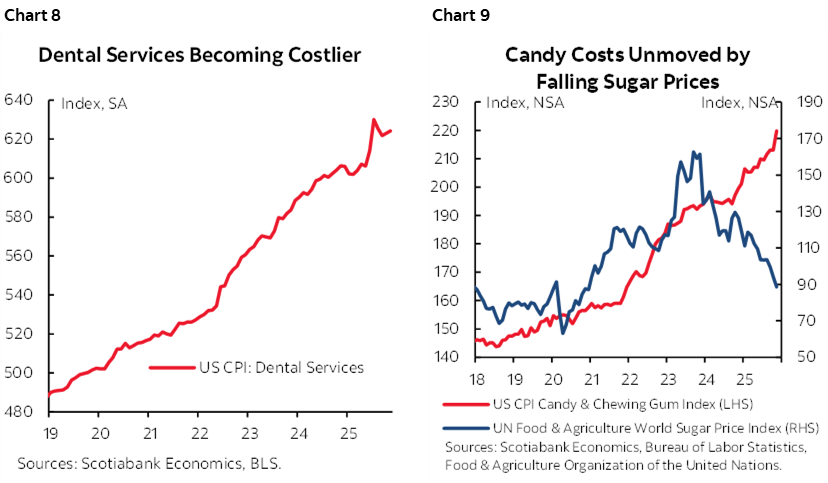
Like to eat a lot of candy over the holidays? I won’t tell your dentist, don’t worry, it’s our little secret, although they can’t be complaining (chart 8)! But a dirty little secret lies in the fact that candy prices are, well, kinda sticky! Chart 9 shows that despite the drop in world sugar prices, candy prices are still elevated. Why? Dunno really, but hypotheses could include margin retention by producers (ie: prices go up faster than down if at all) and the rising cost of other inputs like wages and transportation costs. Or maybe we’re still more like homebodies than before the pandemic and snack more.
How Are You Going to Pay for All of That?
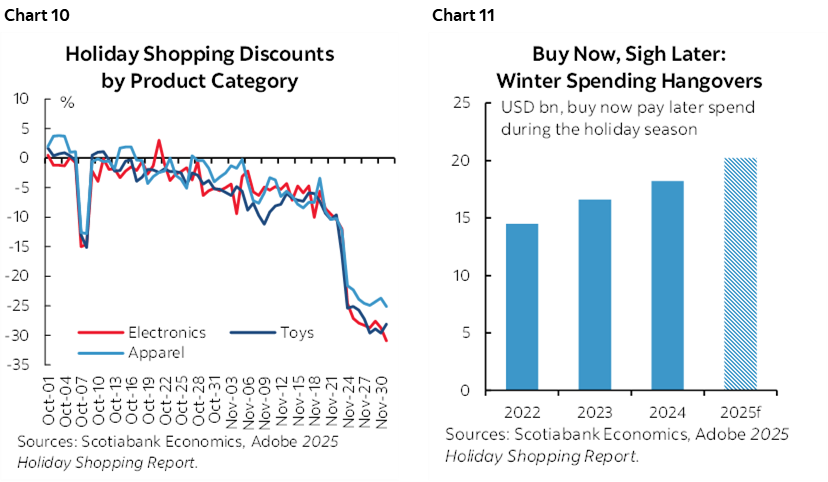
January’s bills tend to follow December’s festivities, except less so this time? Typical seasonal discounting is significant in several categories (chart 10) and buy-now-pay-later programs are even more prevalent this year (chart 11).
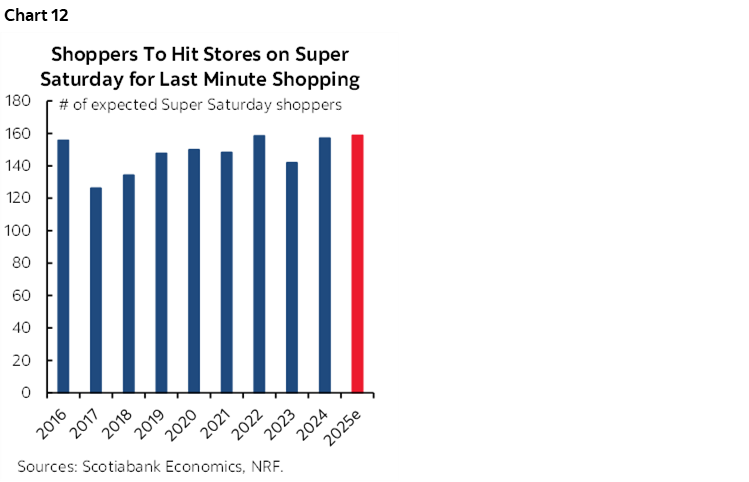
Ode to the Last-Minute Larry and Sally
All done your shopping yet? No, huh. Me neither. Apparently, we’re not alone (chart 12)! Wait to assess the retail season until we’re all finished.
Now onto the serious stuff I suppose. Enjoy the holiday season whatever and however you celebrate it.
AN EVENTFUL GLOBAL CALENDAR IN 2026…
Hoping for a less active year in 2026? Good luck. Wishing for as much action as this past one? You might be in luck. There will be some fun mixed in, like the Winter Olympics in February and the World Cup for soccer/football in the summer. On top of the usual line-up of global central bank decisions, budgets, and key data releases there will be a wealth of other calendar-based risks. And then there will be the unknown unknowns as a former US politician once put it. Here’s a list.
- US Affordable Care Act health subsidies expire Dec 31st.
- Fed Chair appointment, guidance points to early January.
- Supreme Court Decision on IEEPA tariffs any time by January
- US partial government shutdown risk as funding expires January 30th
- Thai general election February 8th
- China's 15th Five-Year Plan (2026-2030) by March.
- Peruvian general election April
- Colombian presidential election May 31st
- CUSMA/USMCA negotiate or renew deadline July 1st
- Swedish general election September
- Quebec Election by October 5th
- Brazilian general election October
- US Midterm Election on November 7th
- NZ general election by December 19th
- BoC’s 5-year review of inflation agreement with the government, late year
…WILL AMPLIFY US POLICY DEVELOPMENTS
What is not on this list because we don’t have dates is the prospect for additional fiscal stimulus in the US as part of what may be a full-on pivot by the Trump administration and how this interacts with the Federal Reserve’s outlook.
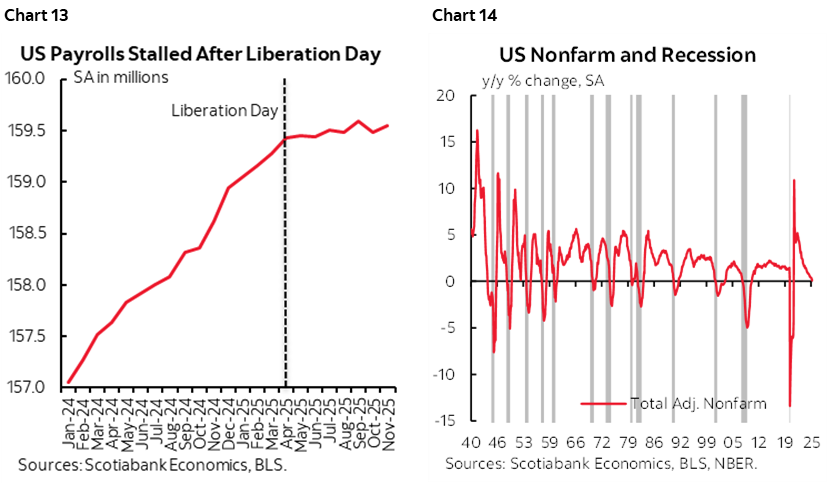
As argued here, the US job market is flashing orange on recession risk after growth stopped following ‘Liberation Day’ (chart 13). I won’t repeat the arguments, but chart 14 adjusts the measure of payrolls for revisions to show that year-over-year payroll growth is weakening even more than official readings. The stalling job market is getting closer to recessionary conditions with recessions shown as grey bars since the 1940s. That is a time-honoured recession flag. It is avoidable, but the warning sign is clear.
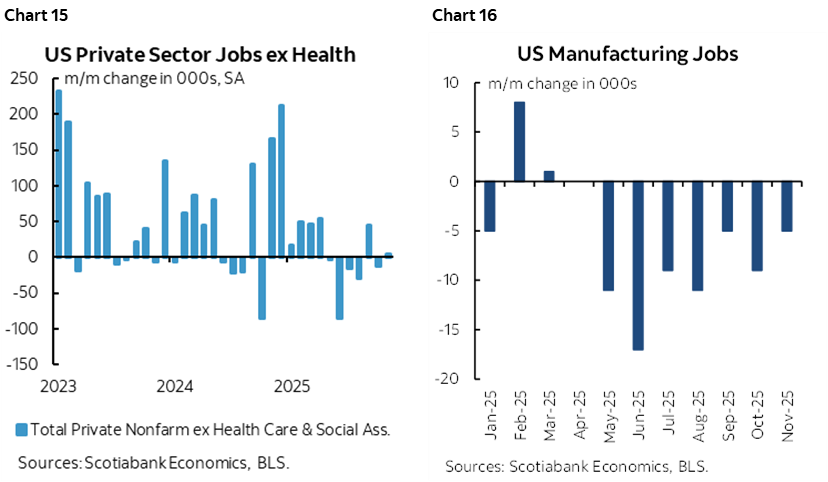
It is untrue that the weakness in payrolls is just because of government firings under DOGE actions. Chart 15 shows private sector hiring ex-health. Further adjustments would also be required. Private payrolls are also likely contracting after taking account of the revisions argument and distorted seasonal adjustments. It’s also untrue that manufacturing jobs are being brought back to the US (chart 16).
I believe the Fed will pivot more dovishly toward the job market in 2026. Their revealed preference in the pandemic was in that direction. The top of the house is fading inflation risk with their comments, flagging it's down, and that any upside from tariffs is likely to be transitory (yes that word again...), and that AI is broadly disinflationary (contestable btw).
A risk to this view that the Fed will ease significantly is that Trump pivots on trade policy and uses another budget reconciliation bill to apply further stimulus to what are estimated to be only small effects from the Big Beautiful Bill Act in 2026. He may encounter more opposition this time given fiscal deterioration. It may take the form of stimulus cheques as Trump has emphasized. That would be classic pump priming ahead of midterms as Trump is plunging in the polls within just 11 months in office. Significant fiscal pump priming could limit the Fed’s flexibility.
In short, Americans are right to have affordability and job security concerns. They've been telling us that all along and we've been using the wrong data to assess it. We should've paid greater heed to soft data like the jobs plentiful reading in consumer confidence that's approaching pandemic lows (chart 17), as payroll revisions and understanding of dents to payroll data quality have lagged well behind and tell us something's going off the rails wayyyyyy tooo late. Americans were promised a bill of goods that this would all improve and it's going the other way.
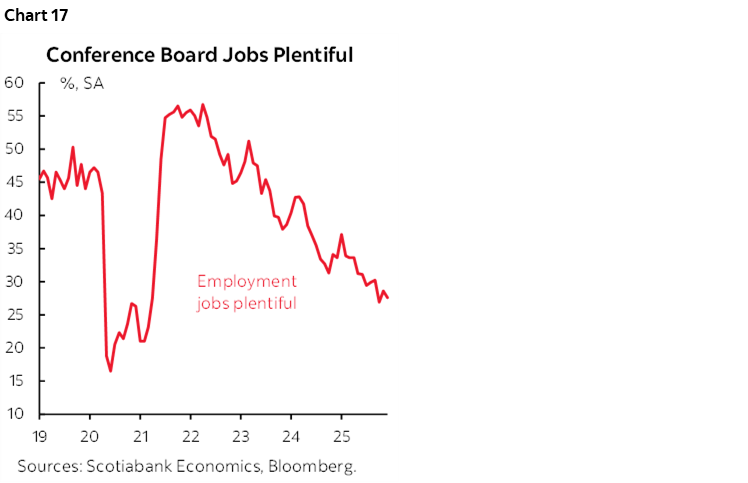
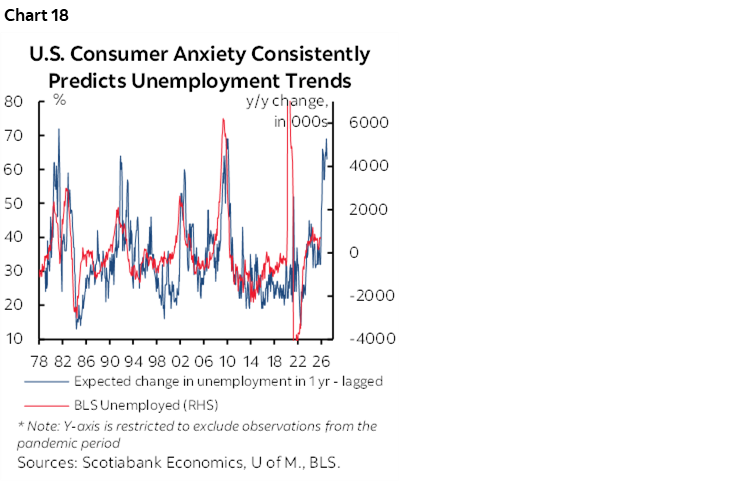
Chart 18 is also telling us something and is one of the favourite ones I’ve been using for a while. The UMich sentiment survey includes consumers’ expectations for the unemployment rate a year from now. It is highly correlated with what ultimately happens to the unemployment rate a year out. Yes it’s soft data, and no consumers are not seers, but neither are economists. There is value in aggregating up what consumers see and hear, whether internally on calls, or at the proverbial water coolers. They may lead the understanding of economists and markets in general.
CANADA’S ECONOMY—STRRRRRIKE!
Canada updates GDP for October with flash guidance for November on Tuesday December 23rd.
A drop of about -0.2% m/m is expected for October with caveats. One of those caveats is that strikes took down hours worked by 0.2% m/m SA in each of September and October across employers like Canada Post and Alberta’s education sector and carried spillover effects upon others. Since GDP is hours times labour productivity, a drop in hours put GDP behind the eight ball.
November GDP could post a rebound. We know that readings like hours worked (+0.4%) surged forward partly as the strikes ended. In general, job growth has been very strong with about 187k added in just the past three months. Measures like housing starts (+9.4% m/m SA) and retail sales (+1.2%) posted solid gains that could spillover into value-added GDP. A simple regression model suggests November GDP could expand by two or three tenths.
US ECONOMY—THE CHRISTMAS RUSH
Several US indicators will be dropped over both weeks with the main ones arriving before Christmas.
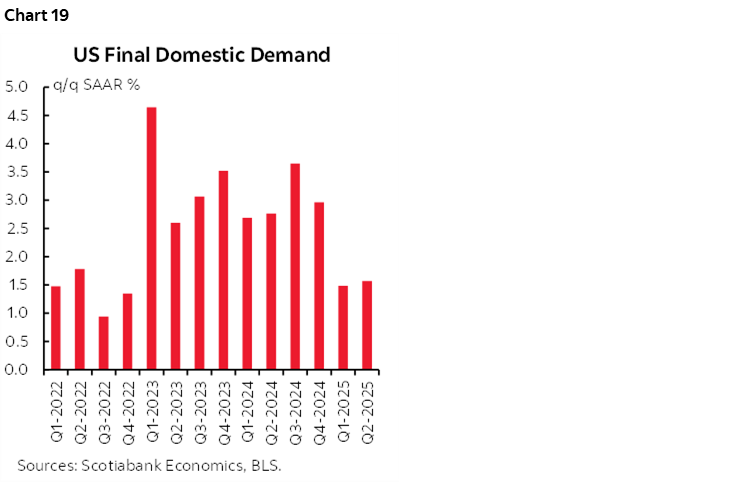
- Q3 GDP (Dec 23 Tuesday): Most forecasters expect a reading between about 3.0% q/q SAAR and 3¾%. The Atlanta Fed’s nowcast is running at about 3½%. It will be important to focus upon final domestic demand that adds consumption, investment and government spending and hence removes trade and inventory distortions and tries to get at underlying momentum in the domestic economy. FDD growth has slowed in the prior two quarters (chart 19). Imports added a whopping five percentage points to Q2 GDP growth when they plunged (ie: less of a GDP leakage effect) and then in Q3 imports fell by much less which implies a large reversal of the leakage effect on GDP growth. Consumption probably grew by around 2¾% q/q SAAR in Q3. Based on October’s retail sales control group’s gain of 0.8%, momentum may be very tentatively tracking another 2-handled or better expansion in Q4. Key is whether this holds up in 2026 as the job market wavers.
- Core PCE (Q3 Dec 23 Tuesday): Based on monthly readings, the Fed’s preferred inflation reading could register a gain of 2.8% q/q SAAR with core PCE performing similarly. Revisions are always a risk.
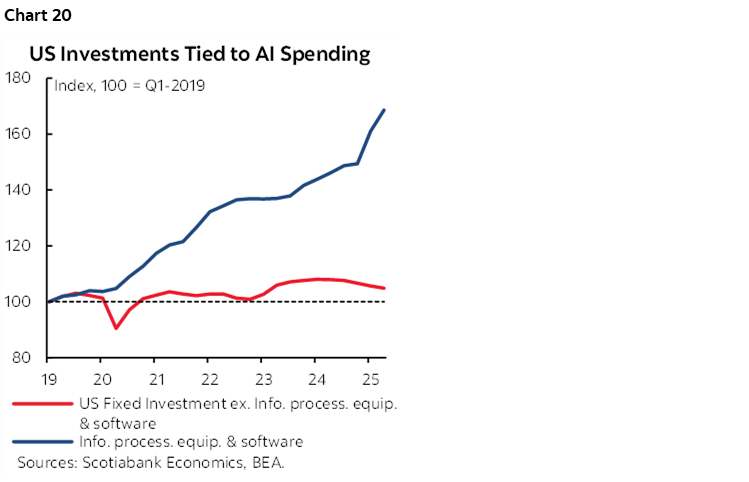
- Durable goods orders (Dec 23rd Tuesday): October’s reading is expected to be weighed down by weaker orders for planes. Core durable goods orders (ex-air and defence) are a better proxy of business equipment spending and have risen for three straight months and remain on a solid upward trend with AI and data centres helping. Having said that, take the tech sector out, and investment in the US economy is basically going nowhere and is in fact marginally softening over recent quarters (chart 20). This is a bit unusual given that the US economy has been in excess demand with a positive output gap for some time. The investment picture of the US economy and the capital it is pulling in is a highly fortuitous development in that it has been driven by tech innovation, not the administration’s policies that may have been otherwise harmful on confidence to invest.
- Industrial production (Dec 23rd Tuesday): October and November readings are due out with expectations pointing to a continued trend of modest gains.
- Consumer confidence (Dec 23 Tuesday): December’s reading may register some improvement from recent softening but watch readings like jobs plentiful and one-year ahead inflation expectations.
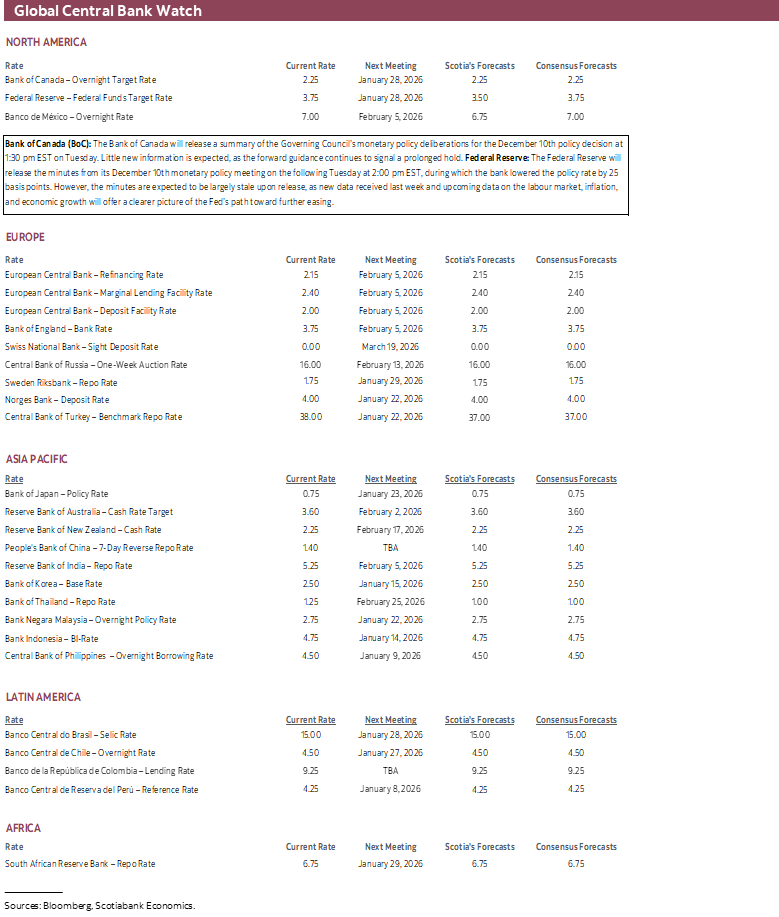
- FOMC minutes (December 30th Tuesday): Minutes to the meeting (recap here) may be stale in light of readings on jobs and inflation since then with markets awaiting new information at the start of the year. They could further expand upon discussions surrounding ample reserves, views on whether the Fed did enough with its liquidity injections, and the range of opinions around the timing and magnitude of further easing. Recall that opinions in the minutes are not weighted toward voting FOMC members, the voting regional Presidents rotate in January, and the language used employs frequency of opinions cited.
Other less impactful readings in the second week of the holiday period could include retail sales in November, new home sales in November, pending home sales, repeat sale home prices, construction spending, plus weekly claims.
CHINA’S ECONOMY—PMIS TO INFORM DETERIORATION
China updates the state’s purchasing managers indices for December on Tuesday December 30th. They are already marginally in sub-50 contraction territory across the composite, manufacturing and non-manufacturing sectors.
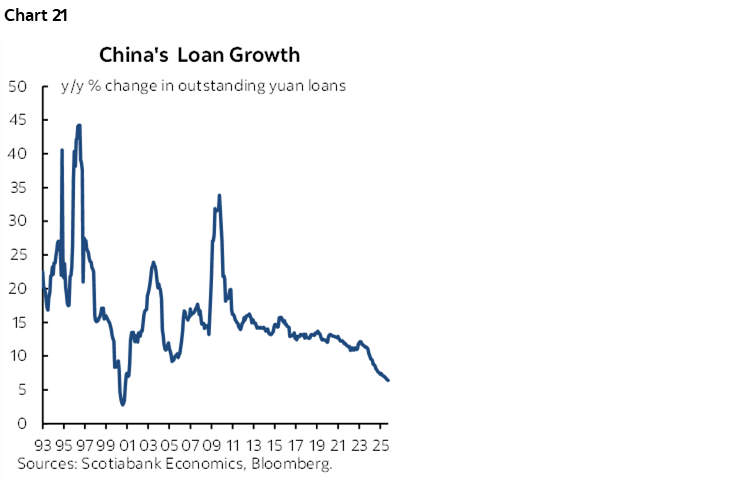
Other readings on China’s economy have been mixed. Retail sales have stumbled. House prices continue to fall. Credit growth is very weak by China’s standards (chart 21). Inelastic demand for money reflects reticence to borrow as rates have come down over time because of expected capital losses in property markets.
On the flip side, exports have been fairly resilient to date. China may be finding workarounds to tariffs, pursuing growth into other markets, and there are long lags in adjusting to trade shocks. Imports have been mixed but also generally resilient.
GLOBAL MACRO
Japan refreshes November readings for housing starts, the jobless rate, retail sales and industrial output and December’s Tokyo CPI gauge on Christmas Day. Effects are likely to be minimal once global markets are back online with the script set by the Bank of Japan having just hiked and unlikely to be in a rush to move again in the nearer term.
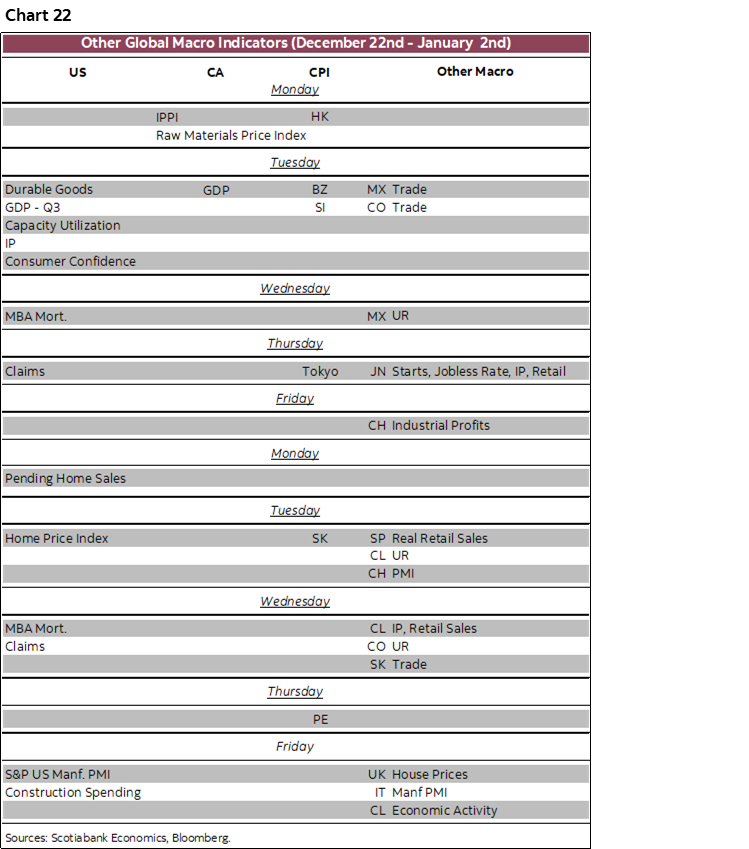
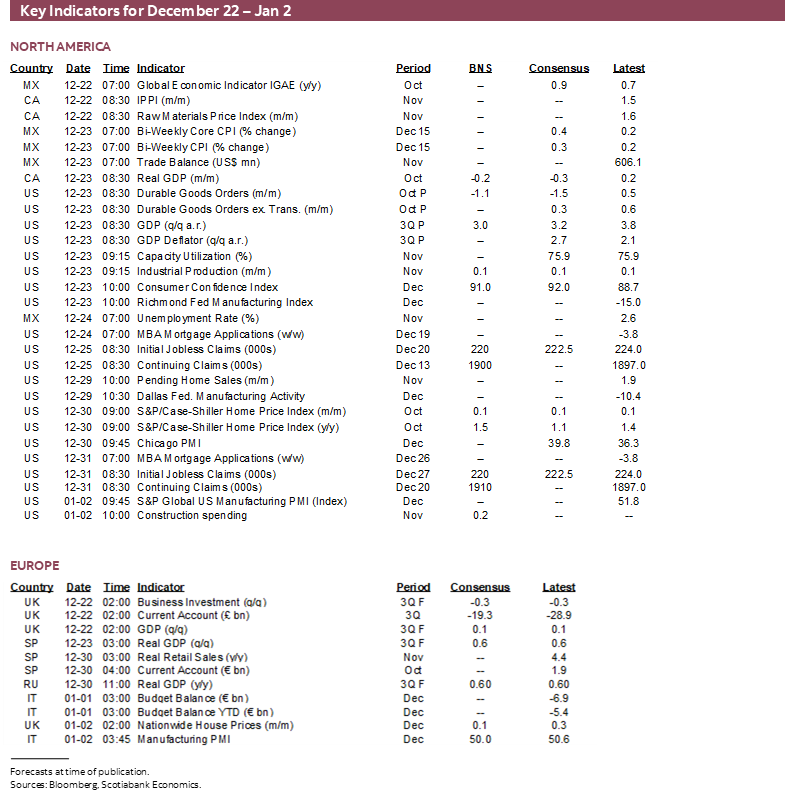
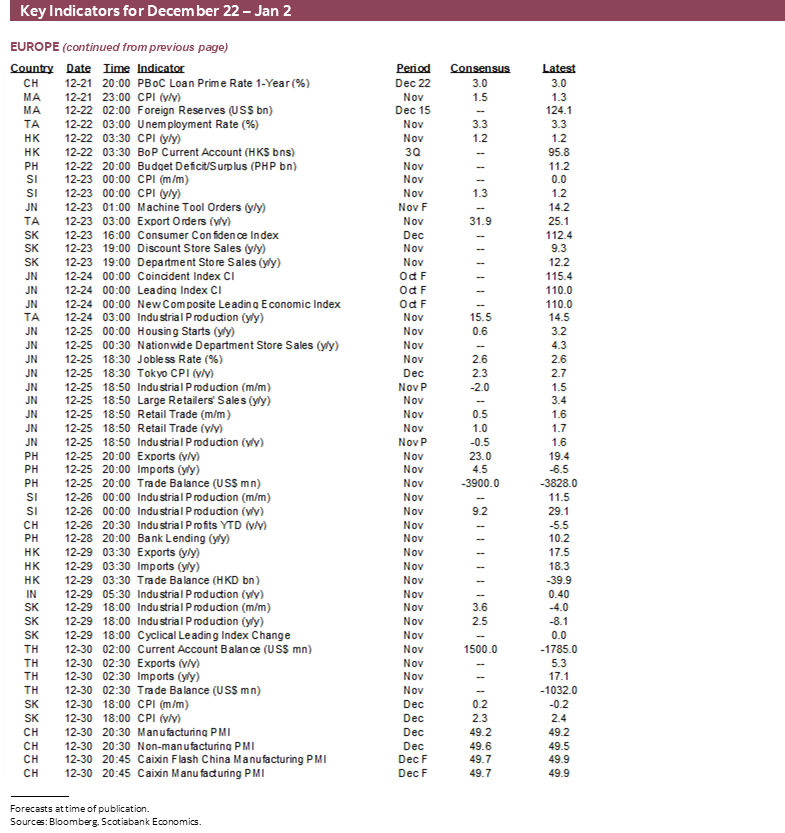
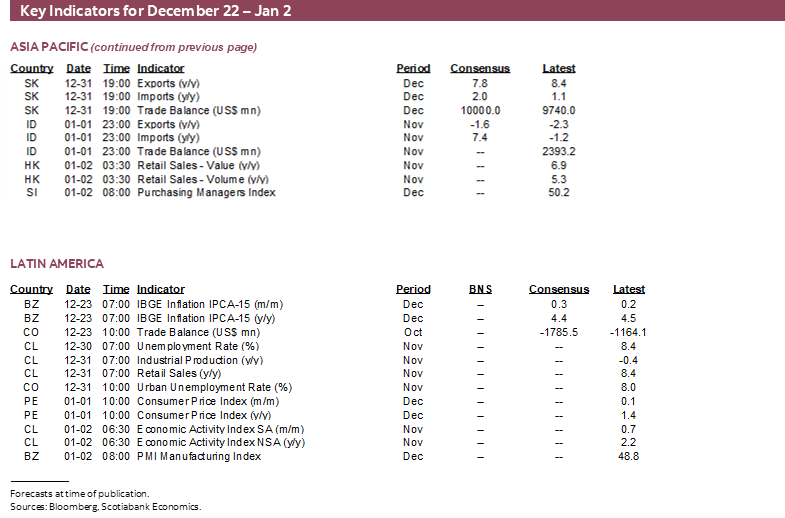
Other localized readings over the next two weeks are summarized in chart 22. Nothing is due out of Europe or Latin America in the week of Christmas and only light readings are due in the second week. The main readings out of the rest of the regions have already been noted.
DISCLAIMER
This report has been prepared by Scotiabank Economics as a resource for the clients of Scotiabank. Opinions, estimates and projections contained herein are our own as of the date hereof and are subject to change without notice. The information and opinions contained herein have been compiled or arrived at from sources believed reliable but no representation or warranty, express or implied, is made as to their accuracy or completeness. Neither Scotiabank nor any of its officers, directors, partners, employees or affiliates accepts any liability whatsoever for any direct or consequential loss arising from any use of this report or its contents.
These reports are provided to you for informational purposes only. This report is not, and is not constructed as, an offer to sell or solicitation of any offer to buy any financial instrument, nor shall this report be construed as an opinion as to whether you should enter into any swap or trading strategy involving a swap or any other transaction. The information contained in this report is not intended to be, and does not constitute, a recommendation of a swap or trading strategy involving a swap within the meaning of U.S. Commodity Futures Trading Commission Regulation 23.434 and Appendix A thereto. This material is not intended to be individually tailored to your needs or characteristics and should not be viewed as a “call to action” or suggestion that you enter into a swap or trading strategy involving a swap or any other transaction. Scotiabank may engage in transactions in a manner inconsistent with the views discussed this report and may have positions, or be in the process of acquiring or disposing of positions, referred to in this report.
Scotiabank, its affiliates and any of their respective officers, directors and employees may from time to time take positions in currencies, act as managers, co-managers or underwriters of a public offering or act as principals or agents, deal in, own or act as market makers or advisors, brokers or commercial and/or investment bankers in relation to securities or related derivatives. As a result of these actions, Scotiabank may receive remuneration. All Scotiabank products and services are subject to the terms of applicable agreements and local regulations. Officers, directors and employees of Scotiabank and its affiliates may serve as directors of corporations.
Any securities discussed in this report may not be suitable for all investors. Scotiabank recommends that investors independently evaluate any issuer and security discussed in this report, and consult with any advisors they deem necessary prior to making any investment.
This report and all information, opinions and conclusions contained in it are protected by copyright. This information may not be reproduced without the prior express written consent of Scotiabank.
™ Trademark of The Bank of Nova Scotia. Used under license, where applicable.
Scotiabank, together with “Global Banking and Markets”, is a marketing name for the global corporate and investment banking and capital markets businesses of The Bank of Nova Scotia and certain of its affiliates in the countries where they operate, including; Scotiabank Europe plc; Scotiabank (Ireland) Designated Activity Company; Scotiabank Inverlat S.A., Institución de Banca Múltiple, Grupo Financiero Scotiabank Inverlat, Scotia Inverlat Casa de Bolsa, S.A. de C.V., Grupo Financiero Scotiabank Inverlat, Scotia Inverlat Derivados S.A. de C.V. – all members of the Scotiabank group and authorized users of the Scotiabank mark. The Bank of Nova Scotia is incorporated in Canada with limited liability and is authorised and regulated by the Office of the Superintendent of Financial Institutions Canada. The Bank of Nova Scotia is authorized by the UK Prudential Regulation Authority and is subject to regulation by the UK Financial Conduct Authority and limited regulation by the UK Prudential Regulation Authority. Details about the extent of The Bank of Nova Scotia's regulation by the UK Prudential Regulation Authority are available from us on request. Scotiabank Europe plc is authorized by the UK Prudential Regulation Authority and regulated by the UK Financial Conduct Authority and the UK Prudential Regulation Authority.
Scotiabank Inverlat, S.A., Scotia Inverlat Casa de Bolsa, S.A. de C.V, Grupo Financiero Scotiabank Inverlat, and Scotia Inverlat Derivados, S.A. de C.V., are each authorized and regulated by the Mexican financial authorities.
Not all products and services are offered in all jurisdictions. Services described are available in jurisdictions where permitted by law.