Next Week's Risk Dashboard
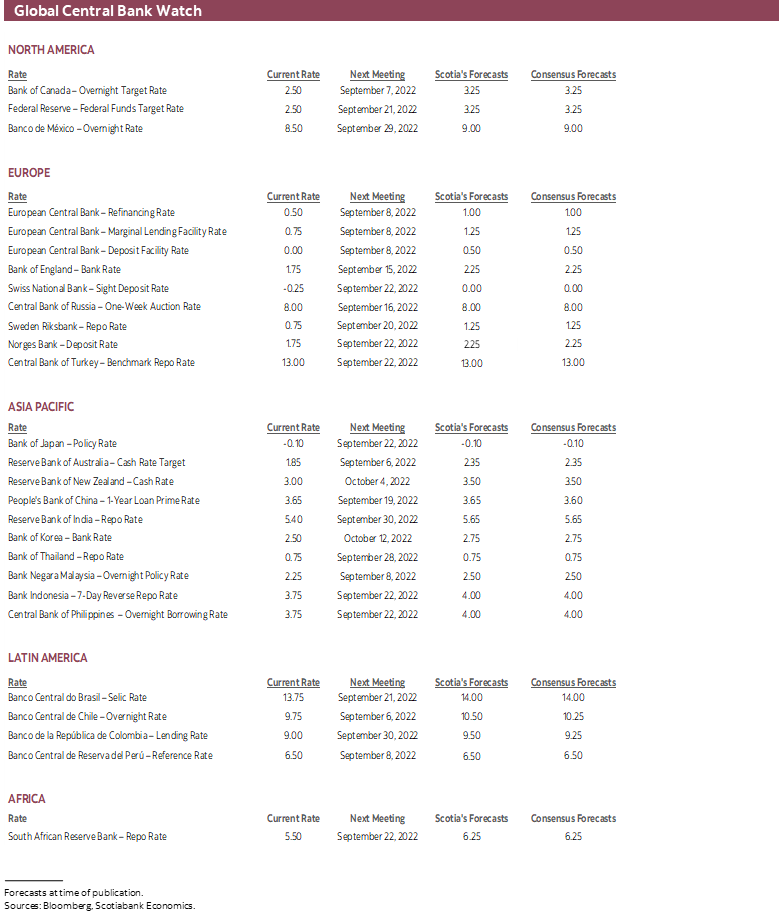
- No central banks!
- US nonfarm & wages to inform the Fed’s next move
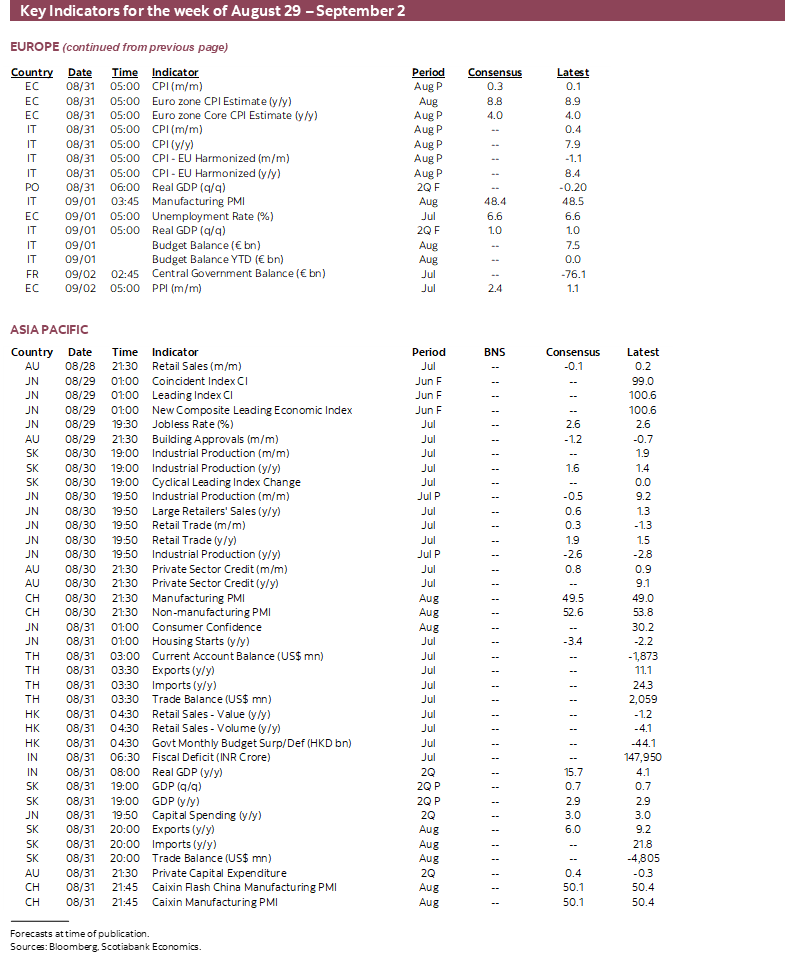
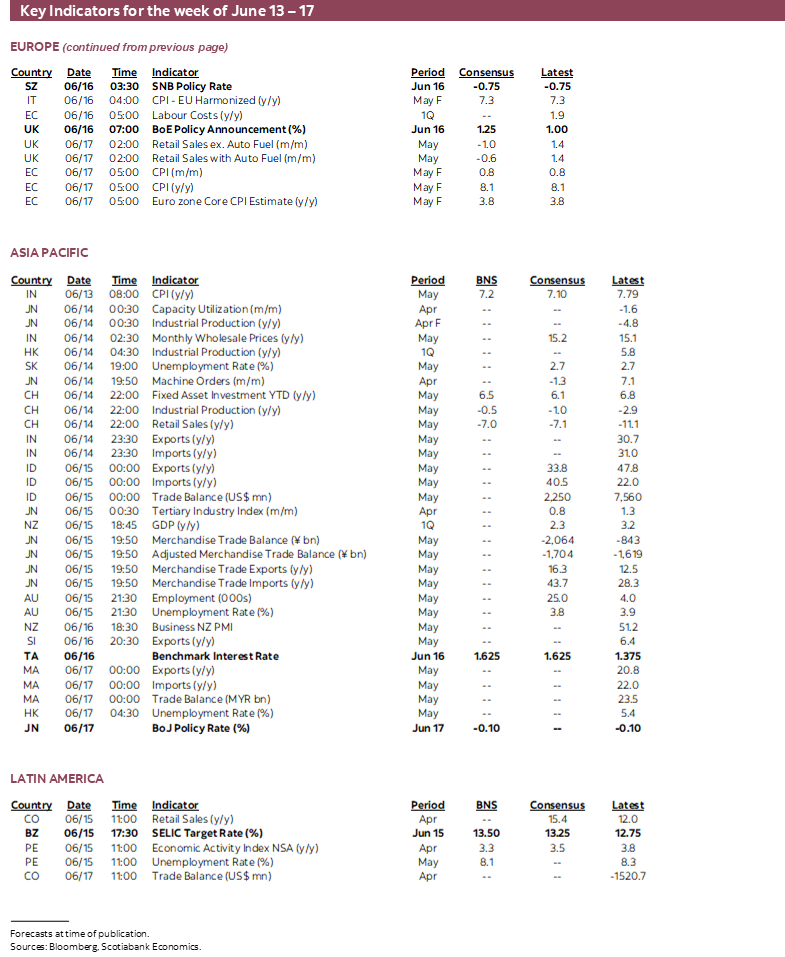
- Eurozone CPI could reinforce recent ECB hawkishness
- Canada’s growth is softening
- PMIs: US, China
- Other global macro
Chart of the Week

Expect a relatively quiet week at least in terms of calendar-based developments with Jackson Hole out of the way, no central bank decisions on tap and ahead of the last wave of late-summer holidays in the Northern Hemisphere. UK markets will be shut at the start of the week for a bank holiday and then the following weekend transitions toward Labour Day in the US and Canada after which many households will be grappling with sending the kids back to school. The week’s focus in the markets will be upon the aftermath of the Federal Reserve’s annual Jackson Hole retreat and a handful of top-shelf data risks that could inform next moves and forecasts by the Fed, ECB and Bank of Canada.
US JOBS AND WAGES—STILL RESILIENT?
It’s spin the wheel time again! US job growth, wages and other labour market metrics will be updated on Friday for the month of July. This will be an important reading for Fed watchers given that Fed Chair Powell and other FOMC officials have explicitly conditioned the size of the rate hike on September 21st upon data and events between now and then. That reminds me of when as a kid I was walking down a street with my sisters and looking over my shoulder only to walk into a lamp post. Not a shining moment. Who knew that decades later monetary policy would be conducted in the same fashion.
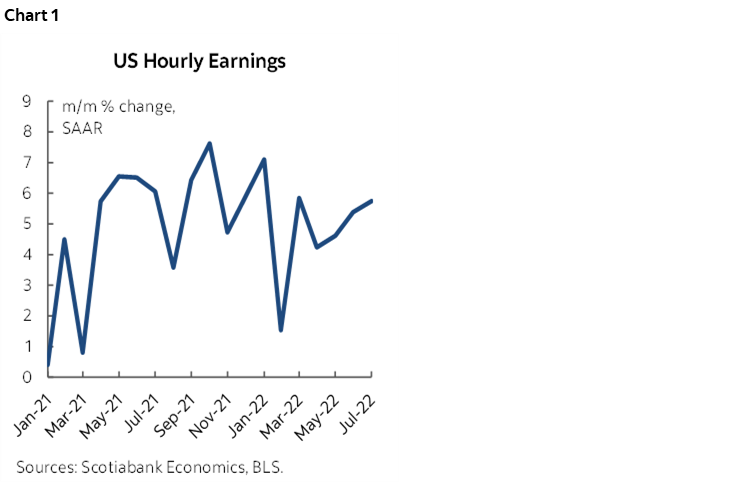
I’ve gone with a guesstimate of +350k for nonfarm payrolls and a ½% m/m non-annualized rise in average hourly earnings that would drive a slight acceleration in the year-over-year nominal rate of growth in wages to 5.4%. The month-over-month annualized rate of wage growth is holding in the 5–6% range (chart 1). That would still leave real wage gains in negative territory in year-over-year terms, but with the month-over-month changes becoming more balanced.
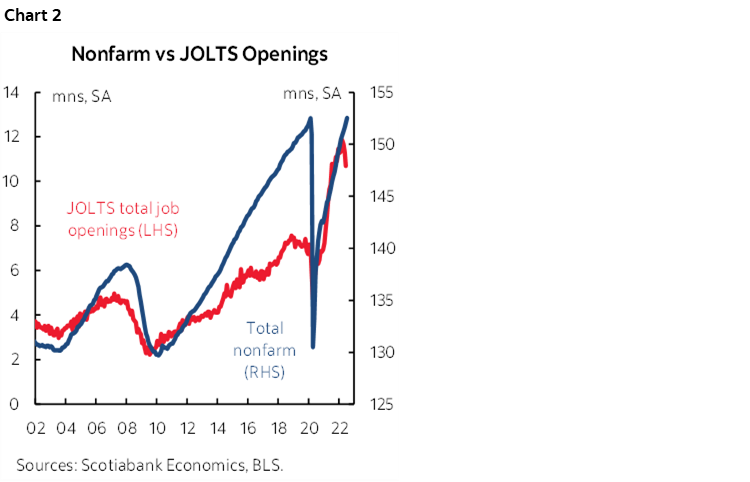
There are fewer advance indications to go by than normal this time, although that may not matter much since they’ve generally been indicating greater softening in the US job market than indicated by nonfarm payrolls for a few months now! ADP will resurrect its estimate of the change in private payrolls on Wednesday but it may be treated skeptically by markets because of its track record and because it will take time for its revamped methodology to be assessed for accuracy in tracking nonfarm payrolls. JOLTS job openings only get updated for the prior month of July on Tuesday and they matter because the recent declines have generally presaged future job losses when they’ve occurred in the past (chart 2). The August readings for NFIB small business hiring plans arrive the week after nonfarm. The Conference Board’s consumer confidence gauges including jobs plentiful will be updated Tuesday. ISM-manufacturing’s employment subindex arrives on Thursday and we won’t get the more relevant ISM-services employment gauge until the week after.
It’s not that economists’ expectations have been flat out wrong so far in 2022, but it is the case that job growth has substantially exceeded their collective expectations. And by a lot. Nonfarm payrolls have risen by 3.3 million jobs in 2022 which has exceeded the cumulative consensus expectation for 2.25 million jobs (Scotia 1.85 million) for a net beat of about one million or nearly 50% more jobs created than forecast. I’ve been particularly surprised by the strength of the US job market and partly because advance leading indicators have tended to be soft going into the payrolls report. That hasn’t worked out so well as payrolls have done their own thing for some time now.
It’s not clear why. The companion household survey has registered 2.3 million jobs created so far this year. Oddly enough, half of that was due to the 1.2 million jobs it registered as having been created in the single month of January. In fact, the household survey registered all of its gain in Q1 (2.5 million) and then lost jobs on net in Q2 which seemed to be more in alignment with the weakening across other job market measures. There are wider statistical bounds of confidence around the household survey than the payrolls report, but probably not enough to dismiss the full divergence between nonfarm payrolls and the household survey over recent months. This keeps alive the debate over which measure of job growth may be the more accurate reading. Over time, the two measures track each other closely and differences tend to converge upon one another. See an explanation for the possible differences in the two measures here.
CANADA’S ECONOMY—DOWNSIDE RISK INTO Q3
Canada reports GDP figures for June and Q2 plus preliminary guidance for the month of July on Wednesday. The figures are likely to reinforce softening momentum to previously strong outperformance of the Canadian economy relative to the US economy.
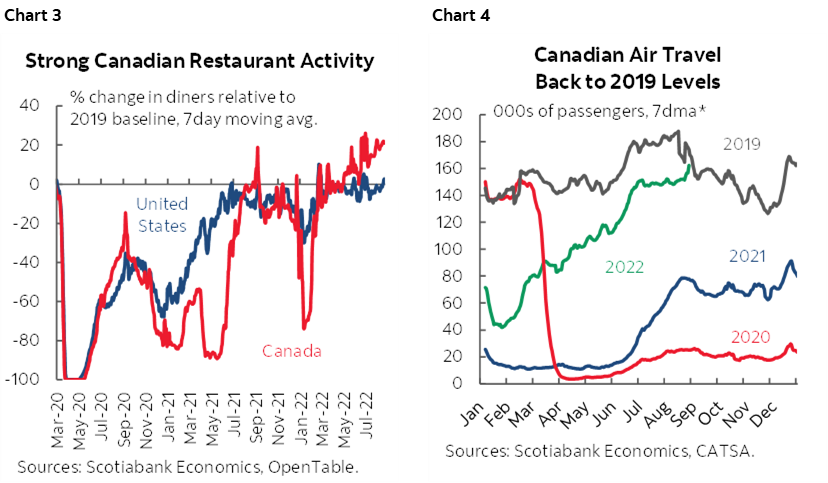
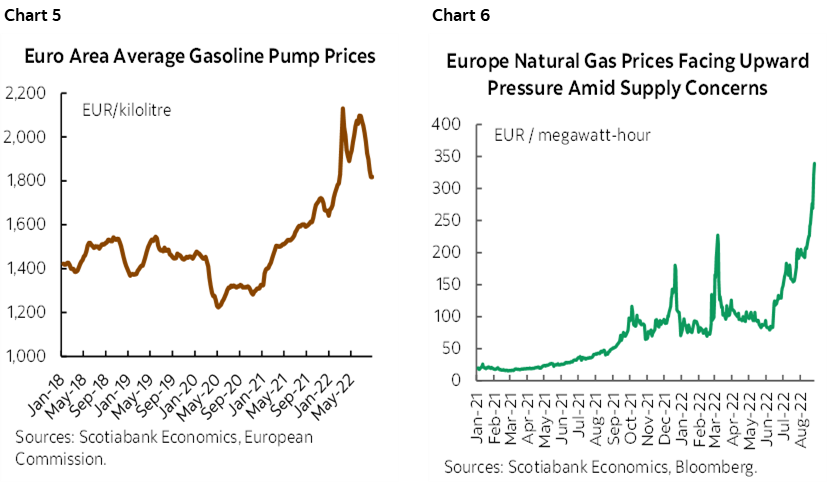
StatCan had tentatively guided on July 29th that June GDP was tracking a 0.1% m/m gain. A simple linear regression model estimates 0.3% m/m. We know that hours worked grew by 1% m/m and that should help since GDP is an identity defined as hours times labour productivity itself defined as output per hour worked. The rub lies in the fact that available activity readings were on the softer side. While they don’t speak directly to value-added GDP accounting, volume growth was soft in retail sales (+0.2%), manufacturing sales (+0.1%) and housing starts that fell by 3.2%. The ability to track services activity is more limited but measures like restaurant attendance (chart 3) and flights (chart 4) suggest that it was a relative bright spot.
How Q2 ends matters to Q3 as previously argued (here). There was no growth in the economy during May and so if June comes in soft then expectations for Q3 may be subdued. Further informing this view is that the economy looks to have lost further momentum in July. Hours worked fell by 0.5% m/m. Guidance has suggested that the value of retail sales declined by 2% m/m despite higher prices which means volumes probably fell by even more. The values of manufacturing shipments and wholesale sales also fell.
In all, the likely loss of economic momentum from May through July means that after the economy grew by 3.7% q/q SAAR in Q1 and probably over 4% in Q2, it may be poised to either grow more slowly or shrink a little in Q3.
That, in turn, could mean that if the US economy transitions from back-to-back contractions in GDP in Q1 and Q2 this year toward mild growth over H2, then it’s entirely possible that Canada’s economy will go in the other direction, from strong H1 growth to a weaker economy as growth was pulled forward.
All of this matters relatively little to the outlook for relative central banks. Tighter monetary policy that tightens financial conditions and damages the demand side of the economy will be necessary to cool inflationary pressures that will remain the dominant focus.
EUROZONE INFLATION MAY REINFORCE THE ECB’S MORE HAWKISH RHETORIC
Eurozone CPI on Wednesday may set the stage for the ECB’s next move on September 8th. Germany and Spain release Tuesday followed by France and Italy on Wednesday. A recent Reuters report indicated that some anonymous ECB officials wish to consider a 75bps hike. That was followed by explicit openness to a 75bps hike by Governing Council members Knot and Holzmann that followed earlier hawkish remarks by Schnabel. There has also been reference to openness by some Governing Council members toward triggering quantitative tightening this year. A strong CPI print would further invigorate such expectations. At present, markets are priced for between a 50bps and 75bps hike at the meeting.
A fair number within consensus expect mild further upward pressure in line with the soaring upward trend in headline and core CPI. Headline CPI inflation may hit a nine-handle with this one and with ongoing upside risk into what may be energy market strains into winter alongside higher food prices due to widespread drought. A downside risk is that gasoline prices have been ebbing in only somewhat seasonal fashion (chart 5), but Russia’s games have been driving natural gas prices skyward with worse probably ahead (chart 6).
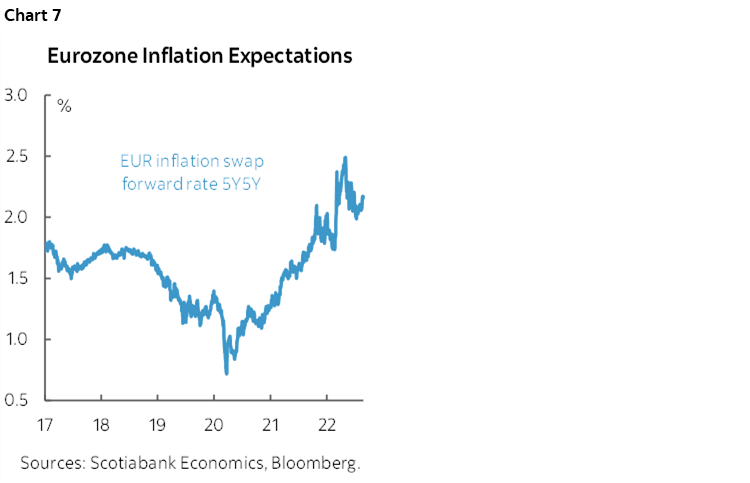
Core inflation will be more important as gasoline prices come off at least temporarily. Longer-run inflation expectations that are slightly above target counsel policy normalization from a deposit rate that is present still at 0% (chart 7).
OTHER MACRO
The rest of the global line-up will focus upon a handful of readings.
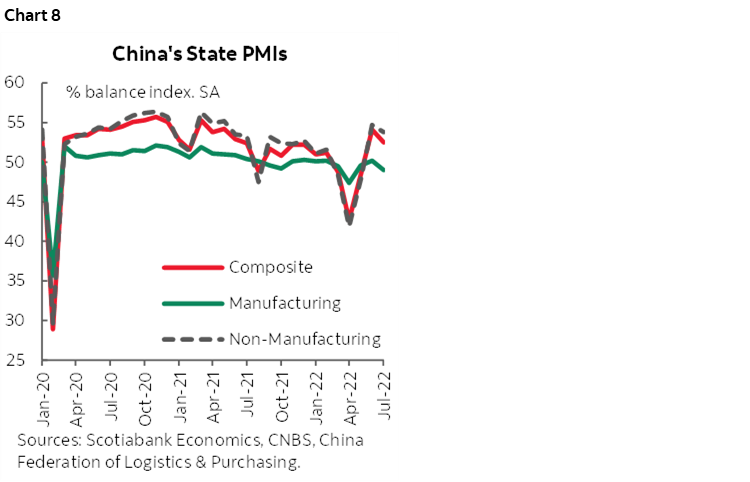
China will update the state’s purchasing managers’ indices for August on Tuesday. After popping higher in June due to reopening effects (chart 8), the composite PMI slipped again in July and faces a tough ride going forward as China’s economy faces ongoing downside risks.
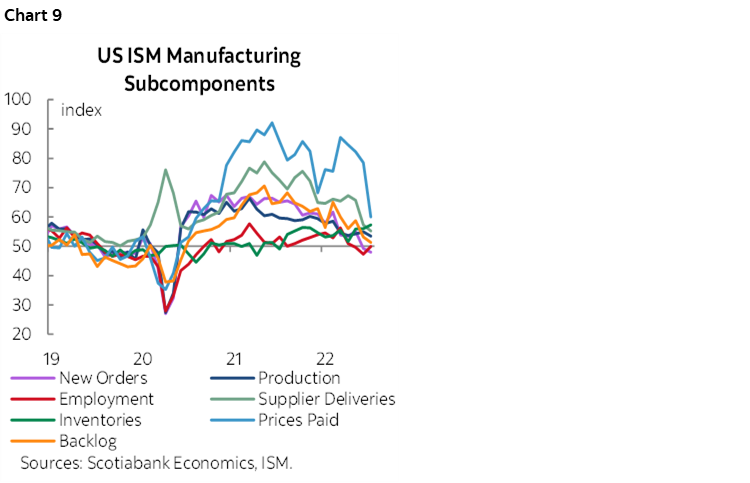
Beyond jobs and the related readings that have already been noted, the US calendar will focus upon Fed-speak and other light releases. Vice Chair Brainard delivers pre-recorded remarks on Monday with no Q&A or presser. Several regional Presidents will speak throughout the week including Barkin, Williams, Mester, newly minted Dallas President Logan, and Bostic, but none of them appear on the calendar post-payrolls. The previously noted ISM gauge’s individual components will inform any further near-term progress toward repairing supply chains (chart 9).
Other than GDP, Canada updates labour productivity growth, or lack thereof, with Q2 figures on Friday ahead of an early 1pmET close for bond markets. Labour productivity has fallen for seven consecutive quarters with Canada performing pathetically in absolute terms and in relation to the US which raises serious competitiveness challenges. BMO (consensus EPS C$3.14) and Laurentian Bank (consensus EPS C$1.25) will close out the bank earnings season on Tuesday and Wednesday respectively.
Other releases across Asia-Pacific markets will include Indian Q2 GDP on Wednesday that is expected to see strong double-digit year-over-year growth because of weak year-ago base effects. South Korea and Indonesia update CPI for August on Thursday and Japan’s monthly data dump will unfold over the course of the week.
Beyond Eurozone CPI, much of the focus will be upon the latest evidence on consumer spending. German retail sales volumes will be updated Thursday and are expected to remain soft after the prior month’s decline. French nominal consumer spending (Wednesday) is expected to slip a touch but partly due to lower gasoline prices. Spain tees up retail sales on Tuesday with Sweden due out on Monday. Germany also updates exports and unemployment over the week.
Latin American markets will take down generally light data. Peru’s inflation rate (Thursday) may ebb a touch and further inform the central bank’s guidance that it may be near the end of its tightening cycle after raising the reference rate by 625bps since last year.


DISCLAIMER
This report has been prepared by Scotiabank Economics as a resource for the clients of Scotiabank. Opinions, estimates and projections contained herein are our own as of the date hereof and are subject to change without notice. The information and opinions contained herein have been compiled or arrived at from sources believed reliable but no representation or warranty, express or implied, is made as to their accuracy or completeness. Neither Scotiabank nor any of its officers, directors, partners, employees or affiliates accepts any liability whatsoever for any direct or consequential loss arising from any use of this report or its contents.
These reports are provided to you for informational purposes only. This report is not, and is not constructed as, an offer to sell or solicitation of any offer to buy any financial instrument, nor shall this report be construed as an opinion as to whether you should enter into any swap or trading strategy involving a swap or any other transaction. The information contained in this report is not intended to be, and does not constitute, a recommendation of a swap or trading strategy involving a swap within the meaning of U.S. Commodity Futures Trading Commission Regulation 23.434 and Appendix A thereto. This material is not intended to be individually tailored to your needs or characteristics and should not be viewed as a “call to action” or suggestion that you enter into a swap or trading strategy involving a swap or any other transaction. Scotiabank may engage in transactions in a manner inconsistent with the views discussed this report and may have positions, or be in the process of acquiring or disposing of positions, referred to in this report.
Scotiabank, its affiliates and any of their respective officers, directors and employees may from time to time take positions in currencies, act as managers, co-managers or underwriters of a public offering or act as principals or agents, deal in, own or act as market makers or advisors, brokers or commercial and/or investment bankers in relation to securities or related derivatives. As a result of these actions, Scotiabank may receive remuneration. All Scotiabank products and services are subject to the terms of applicable agreements and local regulations. Officers, directors and employees of Scotiabank and its affiliates may serve as directors of corporations.
Any securities discussed in this report may not be suitable for all investors. Scotiabank recommends that investors independently evaluate any issuer and security discussed in this report, and consult with any advisors they deem necessary prior to making any investment.
This report and all information, opinions and conclusions contained in it are protected by copyright. This information may not be reproduced without the prior express written consent of Scotiabank.
™ Trademark of The Bank of Nova Scotia. Used under license, where applicable.
Scotiabank, together with “Global Banking and Markets”, is a marketing name for the global corporate and investment banking and capital markets businesses of The Bank of Nova Scotia and certain of its affiliates in the countries where they operate, including; Scotiabank Europe plc; Scotiabank (Ireland) Designated Activity Company; Scotiabank Inverlat S.A., Institución de Banca Múltiple, Grupo Financiero Scotiabank Inverlat, Scotia Inverlat Casa de Bolsa, S.A. de C.V., Grupo Financiero Scotiabank Inverlat, Scotia Inverlat Derivados S.A. de C.V. – all members of the Scotiabank group and authorized users of the Scotiabank mark. The Bank of Nova Scotia is incorporated in Canada with limited liability and is authorised and regulated by the Office of the Superintendent of Financial Institutions Canada. The Bank of Nova Scotia is authorized by the UK Prudential Regulation Authority and is subject to regulation by the UK Financial Conduct Authority and limited regulation by the UK Prudential Regulation Authority. Details about the extent of The Bank of Nova Scotia's regulation by the UK Prudential Regulation Authority are available from us on request. Scotiabank Europe plc is authorized by the UK Prudential Regulation Authority and regulated by the UK Financial Conduct Authority and the UK Prudential Regulation Authority.
Scotiabank Inverlat, S.A., Scotia Inverlat Casa de Bolsa, S.A. de C.V, Grupo Financiero Scotiabank Inverlat, and Scotia Inverlat Derivados, S.A. de C.V., are each authorized and regulated by the Mexican financial authorities.
Not all products and services are offered in all jurisdictions. Services described are available in jurisdictions where permitted by law.