Next Week's Risk Dashboard
- Opportunities — and risks — to procyclical US policies…
- …amid excess demand, full employment and rich valuations
- Powell’s sudden pivot drives Fed forecast changes
- Why Powell pivoted — and why he really did…
- …as Trump moves to stack the deck at the Fed
- Jackson Hole’s aftermath could extend into Monday’s open
- Cautious optimism in Canada-US trade talks…
- …as Canada’s bilateral trade shocks are small
- Back-to-school shopping highlights persistent inflation
- Will Canada’s bank earnings season validate summertime rallies?
- Canadian GDP: Soft headline, firmer domestic economy?
- Inflation watch: US, Eurozone, Japan, Australia
- BoK may cut
- BSP very likely to cut
Chart of the Week
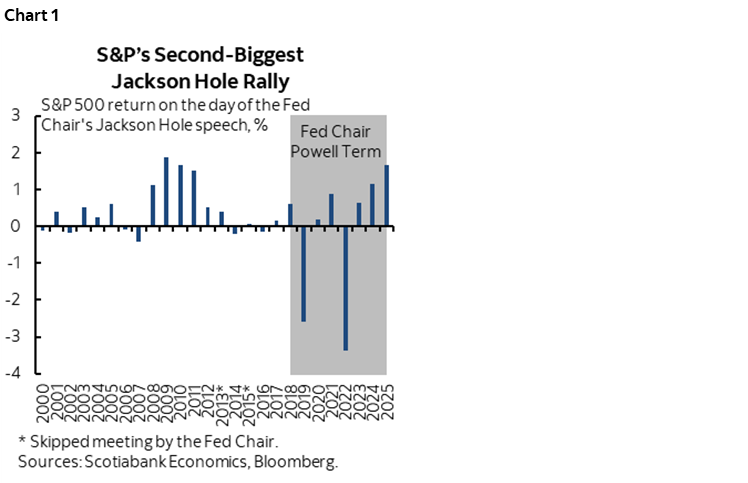
Markets ended this past week enjoying the second biggest stock market gain on day one of any Jackson Hole gathering on record (chart 1). New information in the Fed’s suddenly changed reaction function motivates forecast changes toward more rate cuts sooner than previously.
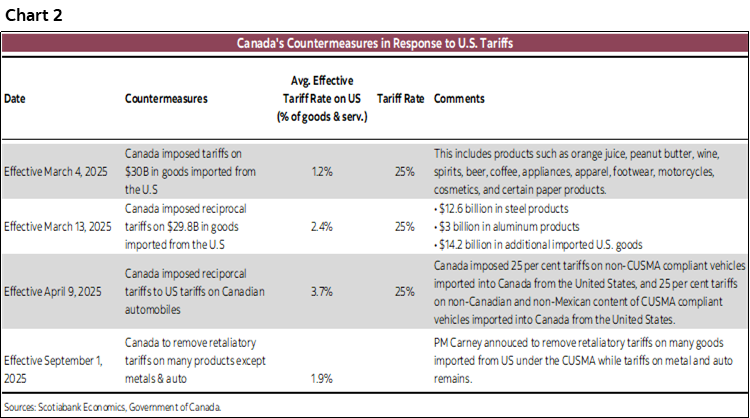
There was also a favourable development on Canada-US trade policy that carries significant weight across N.A. supply chains. Canada dropped some of its retaliatory tariffs, lowering the effective tariff rate on its own imports to a mere 1.9% from about double that at the peak (chart 2). The effective tariff rate on US imports from Canada is about 5½% and if the most directly affected sectors are removed (eg. metals and autos), then the tariff hit on Canada is de minimis which is a point I’ve been emphasizing for a while.
Perhaps Canada’s firm stance worked relative to capitulation by other countries. I would maintain that this bilateral terms of trade shock to Canada is a livable one and the lowest trade hit on any of America’s relevant trade partners. It doesn’t help the macro outlook—but it would be the tail wagging the dog to make it dominate the balance of risks and opportunities in the outlook. Further, movement is afoot to engage in early negotiations ahead of next summer’s review of teh CUSMA trade deal that could reveal a cautiously optimistic outcome before the more heated environment of the midterm elections. Still, what remains most important to Canada from a trade standpoint is resilience of the US economy and the pull effect of US income growth on Canadian imports.
But we’re not out the woods as new opportunities and fresh risks arise that will be the focus of this issue.
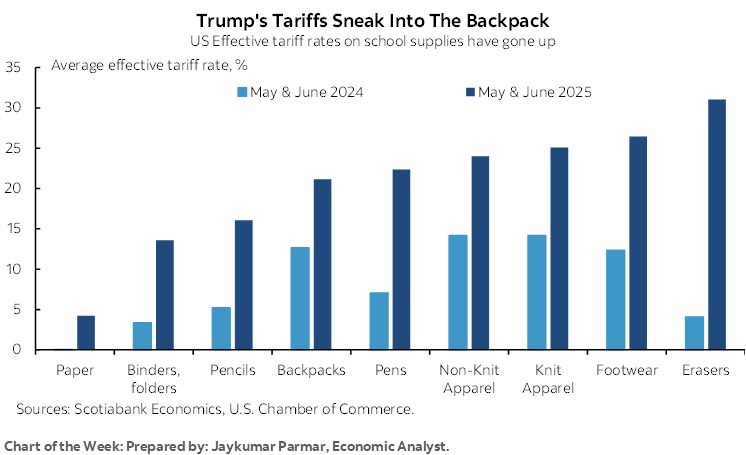
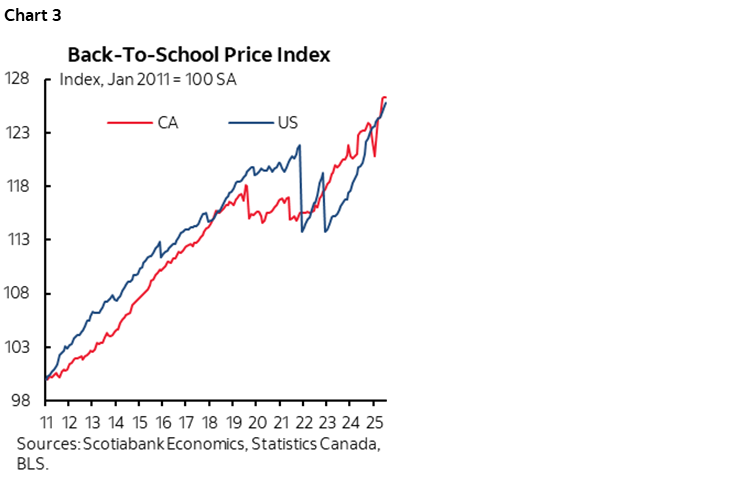
A lighter example to start off with is that back to school shoppers are getting a rude lesson on inflation’s lagging effects. It’s true in both the US and Canada (chart 3, and see Jay Parmar’s chart of the week on the cover). We’ve constructed the series shown in this chart using CPI weights applied to typical back to school spending categories like tuition, children’s clothing, books, and cafeteria “food” as they call it. I remember liver and onion Fridays when the local pizza joint typically had its best day of the week!
Since it’s an annual affair, the start of the school year serves as one example of how long it can take for higher prices and the realization of higher prices to sink in. There are other important examples as well, like the holiday retail shopping season, or new model years in auto land. There are forms of inflation risk related to tariffs, but also forms of inflation risk that are still passing through lagging cost pressures throughout supply seasonal chains which could remain with us for a long time yet. Global supply chains remain at a highly nascent stage of upheaval with new costs and adjustments being borne.
That serves as a segue into this week’s focus on several inflation readings out of the Eurozone, US, Japan and Australia. The US figures may be an immediate reminder that the debate over inflation risk remains alive in the wake of Chair Powell’s pivot at Jackson Hole that raises opportunity and risk as we adjust our forecast stance (more below).
It will also be an important week for Canada watchers. For one, we’ll get a rich array of updated figures on how the economy is performing. For another, to the extent that bank earnings may be a barometer of underlying economic activity, this week’s focus on Q3 earnings will inform next steps in what has been a 26% rally in the TSX banks subindex since April’s low.
I’ll explain why there may be Jackson Hole aftermath into the start of the week and flag other data and developments such as a pair of regional central banks that may deliver rate cuts. But first, the implications of Chair Powell’s pivot.
POWELL’S PIVOT — FORECAST IMPLICATIONS, OPPORTUNITIES AND RISKS
Federal Reserve Chair Jay Powell did a total one-hundred-and-eighty degree turn at Jackson Hole (speech here). Trading floors got out their rally monkeys, driving yields sharply lower and stocks sharply higher while punting currency strength onto other countries in the aftermath. Alongside strengthening evidence of direct political interference by the administration, this merits a fundamental change in our outlook for Federal Reserve policy—alongside a few warnings. Why warnings? As economists, we’re neither salespeople, nor risk managers—we’re mandated to wear both hats.
This sudden turn left a strong sense of capitulation oriented toward shifting the stance to avert the nasty optics of an all-out rebellion on a soon-to-be stacked Board. We’re now in totally uncharted territory on the Fed in my view.
Fifty points of easing by year-end is a minimum expectation and I’d lean toward expecting 75bps of cuts in a trio of back-to-back moves into year-end and another cut in early 2026 after which we’ll see as data and developments are digested along the way. His speech did not sound like one with policy interruptions on the way until some meaningful amount of easing has been delivered. That would take policy into relatively easy territory and there could well be more after that. That’s music to the ears of financial markets and adds some lagging upsides to growth. With new information, we change our minds, and we’re getting a lot of new information about the Fed’s reaction function.
The messaging in Powell’s speech, however, offered strong shades of a tilt back toward de-emphasizing concerns about inflation risk in favour of maximum employment which was Powell’s bias for too long coming out of the pandemic.
Here’s the proof in several snippets of what he said. The money quote was this one:
"Putting the pieces together, what are the implications for monetary policy? In the near term, risks to inflation are tilted to the upside, and risks to employment to the downside—a challenging situation. When our goals are in tension like this, our framework calls for us to balance both sides of our dual mandate. Our policy rate is now 100 basis points closer to neutral than it was a year ago, and the stability of the unemployment rate and other labor market measures allows us to proceed carefully as we consider changes to our policy stance. Nonetheless, with policy in restrictive territory, the baseline outlook and the shifting balance of risks may warrant adjusting our policy stance."
On labour markets, Powell flagged revisions but more importantly a bias toward erring on the side of ensuring the recent softness does not have further and deeper legs to it and in favour of acting pre-emptively which places the emphasis on the concluding part of this quote:
"This slowdown is much larger than assessed just a month ago, as the earlier figures for May and June were revised down substantially. But it does not appear that the slowdown in job growth has opened up a large margin of slack in the labor market—an outcome we want to avoid."
and
"Overall, while the labor market appears to be in balance, it is a curious kind of balance that results from a marked slowing in both the supply of and demand for workers. This unusual situation suggests that downside risks to employment are rising. And if those risks materialize, they can do so quickly in the form of sharply higher layoffs and rising unemployment."
On inflation risk, he was relatively more sanguine including tariff effects and generally dismissive toward a sustained bout of inflation risk:
"A reasonable base case is that the effects will be relatively short lived—a one-time shift in the price level. Of course, "one-time" does not mean "all at once." It will continue to take time for tariff increases to work their way through supply chains and distribution networks. Moreover, tariff rates continue to evolve, potentially prolonging the adjustment process. It is also possible, however, that the upward pressure on prices from tariffs could spur a more lasting inflation dynamic, and that is a risk to be assessed and managed. One possibility is that workers, who see their real incomes decline because of higher prices, demand and get higher wages from employers, setting off adverse wage–price dynamics. Given that the labor market is not particularly tight and faces increasing downside risks, that outcome does not seem likely."
In short, everything Powell spoke about through the summer seemed like a total waste of time. One set of nonfarm revisions did it, despite saying all along that conflicting effects of other macroeconomic policies like tariffs and immigration on the dual mandate make it uncertain whether the downside risks to employment or the upside risks to inflation would dominate the decision over the appropriate policy stance. We’re getting recent evidence of rising pressure on inflation and a weaker job market but instead of waiting to see which one may dominate, Powell went back to the future by emphasizing jobs.
In other words, the Fed is passively looking through inflation risk. Again. It’s transitory. Again, without the explicit use of the maligned term. We'll see how that works out for them. Again. In my view, there will be a political cloud hanging over this speech.
Beyond the implied use of the transitory perspective on inflation there is the added warning of overt political meddling in the Federal Reserve where the Board of Governors faces a fundamental restructuring in favour of Trump-appointees. Five out of the seven Board spots will be planted by President Trump. That already includes two (Waller, Bowman, both dovish), another one waiting in the wings for his Senate confirmation (Miran, the most dovish), plus whomever replaces Powell (likely dovish) and whomever fills Governor Cook’s spot if she is indeed fired by Trump for cause which seems to be a significant probability unless she can very quickly prove that the allegations are false or hold things up with uncertain legal outcomes should she sue. Powell saw the writing on the wall with massive internal rebellion by political appointees in motion.
Which arrives at the following three-pronged conclusion. For one, I'm super concerned about the pressures on the Fed, the sudden pivot, and the wholesale change on the Committee that is underway. Such developments question whether there will be a dispassionate, steady hand on the tiller.
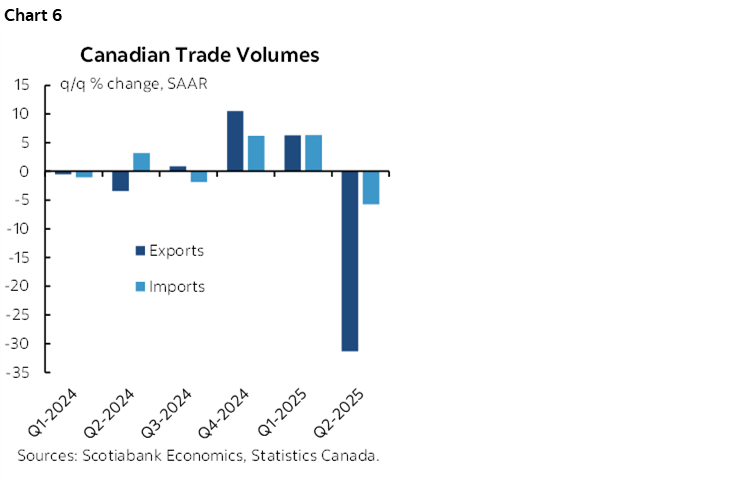
Second is that while these developments raise our optimism on nearer term growth an risk appetite, we have to be mindful that we’re watching a movie sequel that many of us have seen before. Valuations are high across equities (chart 4) and credit spreads with the leanest BBB spreads over US 10s since the pandemic and slightly leaner than into the GFC (chart 5). There may be room for earnings growth and perhaps further multiples expansion, but the starting point is rich. The US economy is presently in excess aggregate demand with a still tight labour market operating around estimates of full employment. Capital rules are being relaxed. eSLR relief to GSIBs could bring in a whole wave of buying of Treasuries that permeate much of the world’s financial markets and are at the heart of many leveraged instruments. And the Fed is turning more dovish, arguably under unprecedented political interference to do so and that is stacking the deck. There are also ongoing murmurings about using the second budget reconciliation bill available to the administration this year to offer more goodies.
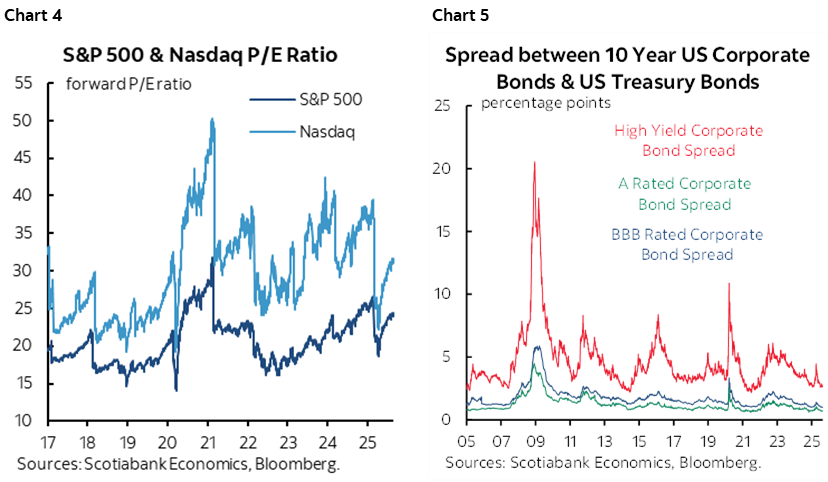
This second risk therefore flags the risk that US macroeconomic policy is pro-cyclical in nature once more which could lift spirits in the nearer-term while amplifying risks to the economy and financial system later.
Third is that with the Fed rushing to the rescue, how will the administration’s policies adapt? The risk of emboldening additional flawed macroeconomic policies such as on tariffs and overcorrecting on immigration policy or driving further fiscal imbalances may have risen with Powell as the enabler. He should be careful. After blowing the pandemic’s inflation experience, he might be going out on a riskier note.
CANADA’S ECONOMY—GDP Versus the Domestic Economy
Friday brings out a fresh impression of the health of the Canadian economy when GDP for Q2 and the individual months of June and July arrive. Combined, they will also give an early impression of momentum into Q3.
The punchline is that the economy probably stalled in Q2, but the details about how and why combined with how the quarter ended could matter more.
First the estimates. Our guesstimate is that Q2 expenditure-based GDP contracted a touch by around –¼% q/q SAAR. The Bank of Canada’s July MPR was harsher at –1½% in their ‘current tariff scenario’ at the time.
Some of this estimate is informed by tracking monthly income-based GDP. If June GDP grows by 0.2% m/m SA as per my estimate, then this measure of GDP in Q2 may be flat over Q1. A simple regression equation against higher frequency readings leans toward something stronger than 0.2%, but I tamped that down because Statcan—that operates with more internal data than we have to go by—guided on July 31st that the economy probably increased by about 0.1% m/m in June.
The uncertainty surrounding reliance on monthly GDP figures—based on product/income concepts—to estimate expenditure-based GDP is that the full effects of net trade and inventory swings on how output changed may not be fully captured.
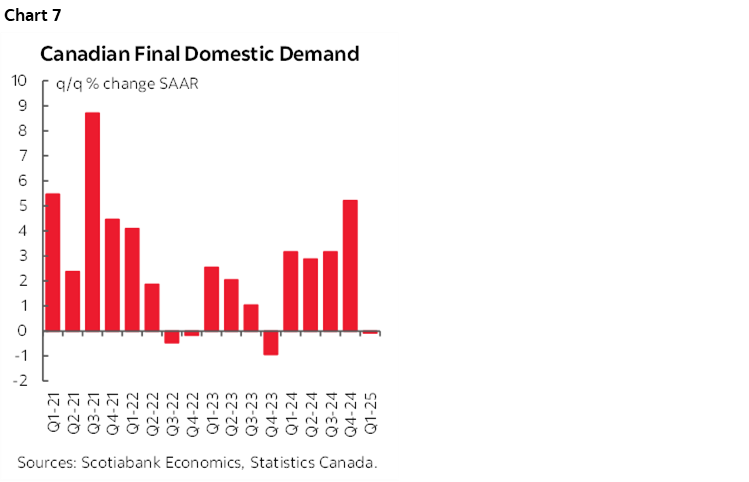
On that note, net trade was a disaster last quarter (chart 6). Export volumes fell by over 30% and import volumes also fell but by much less. Since imports are a leakage from GDP accounts, a decline in imports perhaps perversely serves as a lift to GDP. As an aside, our tracking of monthly net trade figures including revisions along the way suggests that Q1 exports in the GDP accounts and hence Q1 GDP could be revised lower.
An offset to this net trade effect could be inventory investment. We’re missing a lot of data on inventories, but the manufacturing and wholesale figures suggest that inventories added to GDP growth by expanding in Q2. This was likely a tariff front-running and stockpiling effect. A caution is that retail inventories are only available quarterly and so we don’t have them yet, and we have insufficient data on other business inventories.
Most economists, however, would argue that a better gauge of the health of the domestic economy that cuts through all the wild swings in inventories and net trade is final domestic demand (FDD). In a GDP accounting sense, this adds consumption plus investment plus government spending to arrive at a measure that may be more closely aligned with what monetary and fiscal policy can impact.
It's entirely feasible that Q2 saw a solid rebound in this measure from flatness in Q1 (chart 7). Whereas Q1 saw GDP growth of 2.2% q/q SAAR, final domestic demand was weak (-0.1%). Q2 could see a reversal of this outcome with weak headline GDP, but stronger FDD. Housing starts were up by 160% q/q SAAR in Q2 as they soared from 223k/month on average in Q1 to 283k in Q2; this should lift residential investment in the GDP accounts. Because most spending by Canadian businesses on machinery and equipment is imported, another mild gain in such import volumes in Q2 would support investment. Retail indicators of consumer spending and various service spending proxies like restaurant spending and air travel point toward resilient consumer spending. Strong showings by housing starts, existing home sales, and auto sales suggest that the most rate sensitive areas of the economy are beginning to see the fruits of 225bps of monetary easing from July of last year to March of this year and in keeping with lagging effects over a 12–24 month period.
In all, the devil will very much lie in the details to this GDP report.
All of this complicates things for the Bank of Canada. Technically, soft GDP could raise the amount of slack in the economy that the output gap measure in the BoC’s July MPR estimated at -0.4%. But monetary policy has the greatest effect on the domestic economy and can’t chase inventory swings. For other views on slack and how the BoC should respond see this morning note from earlier in the week that also notes the pass through effects of monetary policy into interest sensitives and how Canada’s labour market is getting ripping wage growth alongside moribund productivity that combine to raise inflation risk.
CANADIAN BANK EARNINGS SEASON
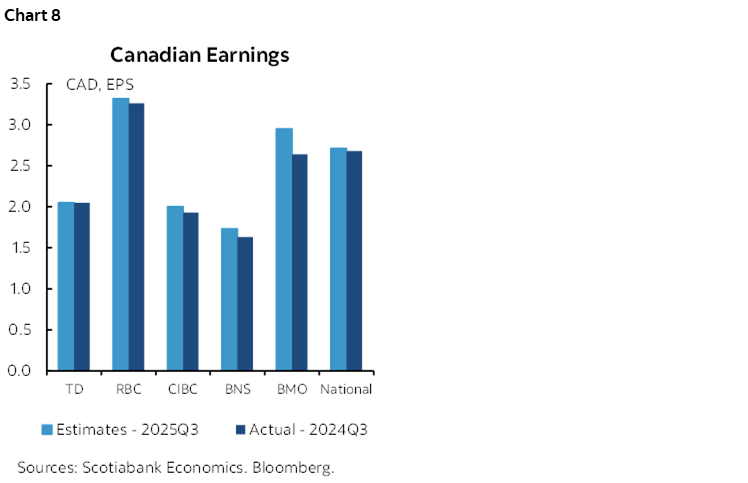
Canadian banks release Q3 earnings reports this week. BNS (my employer) and BMO kick if off on Tuesday. Followers include RBC and National Bank on Wednesday, and then TD and CIBC on Thursday.
Analysts expect mixed but generally softer results across the banks when comparing expectations for this quarter to the same quarter last year (chart 8).
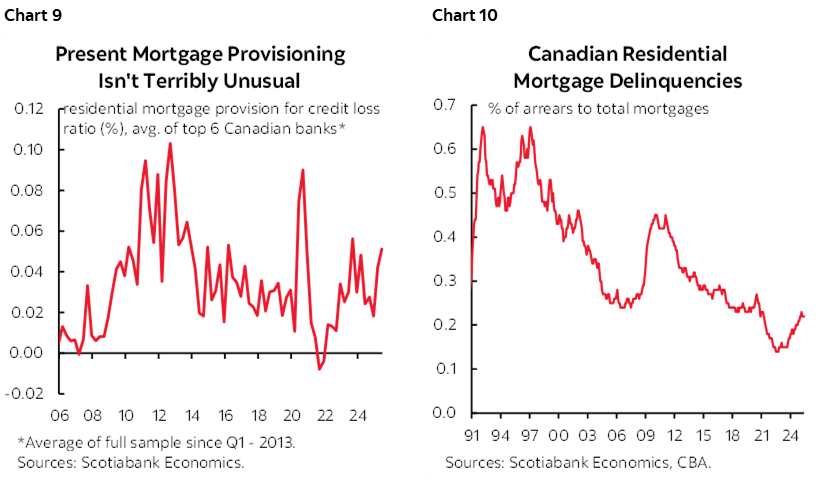
Also key may be provisioning given uncertainties surrounding the economic outlook. To date, mortgage provisioning is not historically unusual (chart 9). The chart takes the Canadian ‘big six’ banks’ provisions for mortgage loan losses as a share of outstanding mortgages over time, versus the way in which the popular press reports them strictly in dollars and cents. Mortgage delinquency rates are off the bottom—if you get out the microscope (chart 10). Canadians simply tend not to default on mortgages at stress points like Americans do for various reasons—laws, culture, lender negotiations etc.
CENTRAL BANKS—JACKSON HOLE AFTERMATH AND TWO POSSIBLE CUTS
Aftermath of the Federal Reserve’s Jackson Hole symposium could spill into the Monday Asian market open. Otherwise, only two central banks weigh in with decisions this week, both of which are in Asia, and they could be split decisions on the same day of Thursday.
Jackson Hole Aftermath
Jackson Hole could offer two types of effects at the start of the week. One is that Asian markets may face catch up to the reaction across western markets to Chair Powell’s relatively dovish speech on Friday and any second thoughts on its contents.
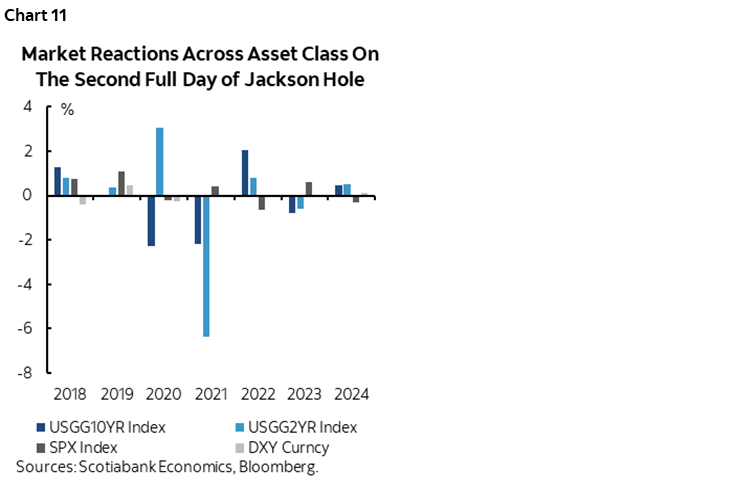
Two is reaction to broader developments at Jackson Hole including appearances by Bank of England Governor and ECB President Lagarde on the same panel on Saturday. There will also be ongoing interviews from the sidelines and appearances by other central bank officials. Chart 11 shows historical market reactions to Jackson Hole after its full conclusion.
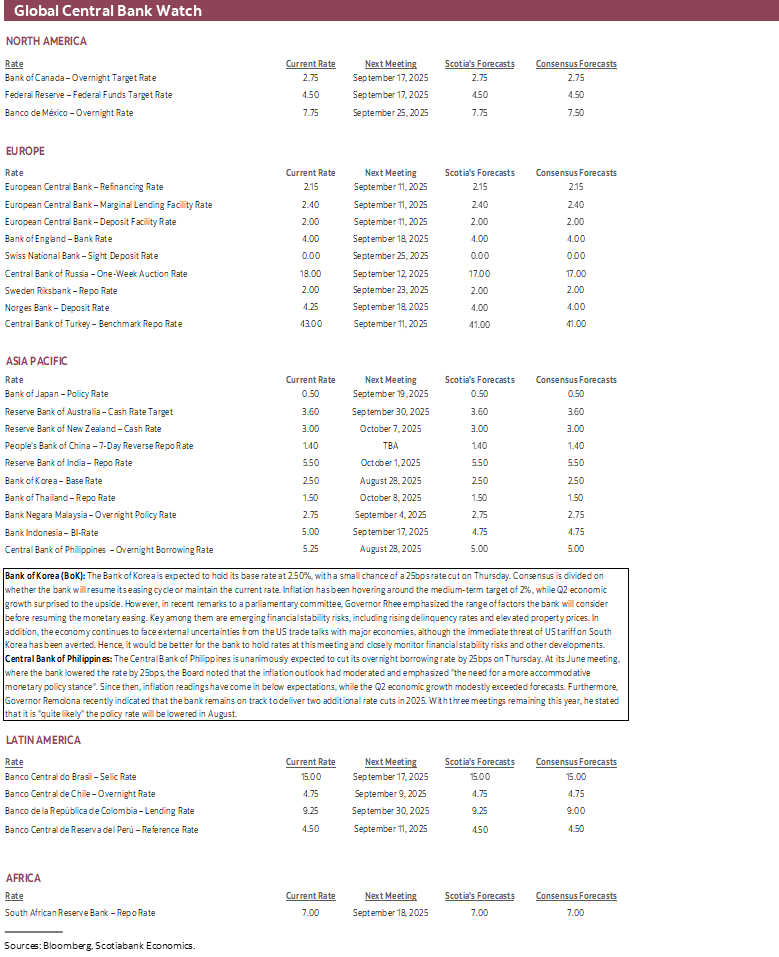
BoK Has Cover to Cut
The Bank of Korea has already cut by 100bps since last summer including this May’s 25bps reduction before pausing in July. The oscillating cut-hold-cut pattern this year might set this meeting up for a cut. Inflation at 2.1% is close to the medium-term 2% target, but plenty of mixed uncertainties lie ahead. South Korea has certainty in a bad trade deal with the US. Concern about the economic outlook, housing imbalances, and won stability overhang the decision, though the government’s recent decision to apply restrictions on foreign property purchases in Seoul could help counter some stability concerns if the BoK chooses to ease again.
BSP Very Likely to Cut
Bangko Sentral ng Pilipinas is expected to cut by 25bps to a new overnight borrowing rate of 5% on Thursday. At its last decision on June 19th when it cut by 25bps, the Board emphasized “the need for a more accommodative monetary policy stance.” Since then, headline inflation has fallen from 1.3% to under 1%, providing cover for Governor Remolona to deliver on his “quite likely” guidance for a rate cut this time and one more in 2025.
GLOBAL MACRO—INFLATION IN FOCUS
A wave of global macro readings beyond ones that have already covered will be particularly focused on the following.
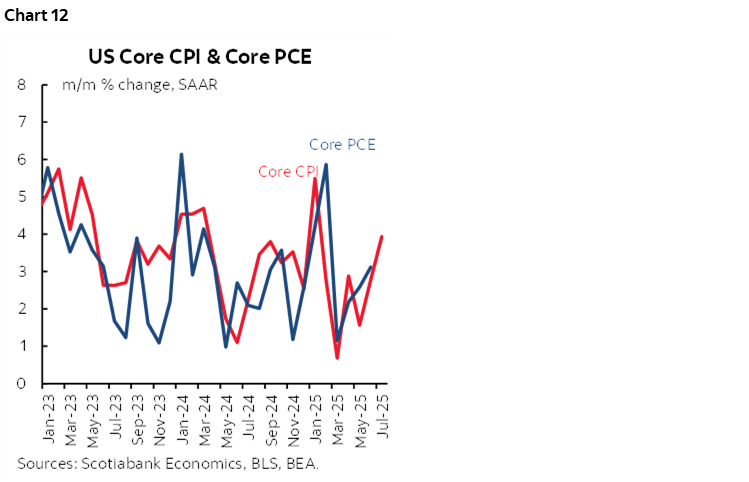
1. US PCE: The Fed’s favourite inflation gauge is due out on Friday. Powell has basically told us to look through it on the path to the September 17th decision which downplays its importance. Core PCE is expected to rise by at least 0.3% m/m SA based on connections to core CPI (chart 12), relevant components derived from the producer price index, estimated weighting differences between CPI and PCE, and potential substitution effects that PCE takes into account but CPI does not.
2. Eurozone inflation: We won’t get the add-up across the whole region until the following week, but the biggest individual countries will all report CPI by the end of the week. France, Germany, Spain and Italy all release on Friday. Most forecasters expect soft headlines except for France.
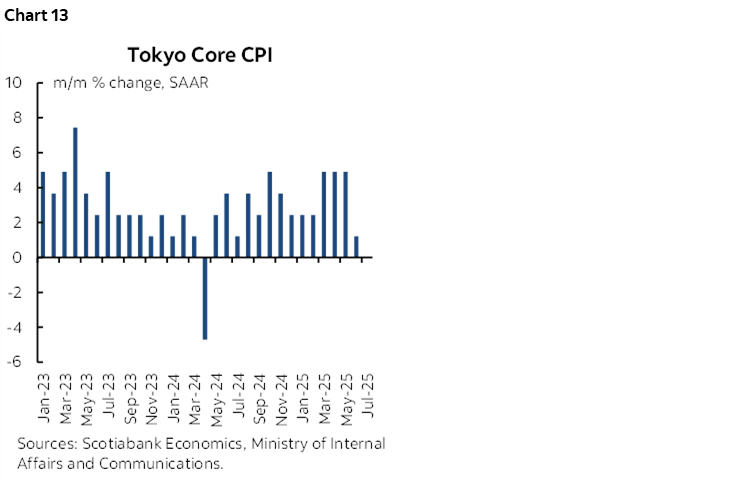
3. Japanese inflation: BoJ watchers will have a keen eye on the August reading for Tokyo core CPI. Key is whether it repeats the sudden softening the prior month, or rebounds (chart 13).
4. US consumer spending and incomes: Also on Friday will be the release of July figures for US consumer spending and incomes. Both are expected to post robust gains of about ½% m/m SA each in nominal terms and slightly less in inflation-adjusted terms. Still, Q3 real consumption growth may be tracking around 1½% q/q SAAR which would be similar to the prior quarter’s moderate pace.
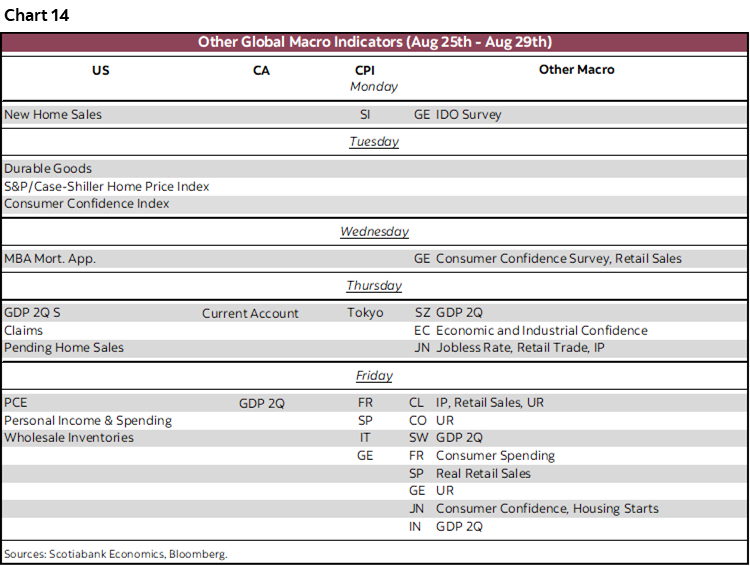
Chart 14 summarizes what else is on the global docket and coverage of the main ones and any implications will be provided in daily notes throughout the week.
DISCLAIMER
This report has been prepared by Scotiabank Economics as a resource for the clients of Scotiabank. Opinions, estimates and projections contained herein are our own as of the date hereof and are subject to change without notice. The information and opinions contained herein have been compiled or arrived at from sources believed reliable but no representation or warranty, express or implied, is made as to their accuracy or completeness. Neither Scotiabank nor any of its officers, directors, partners, employees or affiliates accepts any liability whatsoever for any direct or consequential loss arising from any use of this report or its contents.
These reports are provided to you for informational purposes only. This report is not, and is not constructed as, an offer to sell or solicitation of any offer to buy any financial instrument, nor shall this report be construed as an opinion as to whether you should enter into any swap or trading strategy involving a swap or any other transaction. The information contained in this report is not intended to be, and does not constitute, a recommendation of a swap or trading strategy involving a swap within the meaning of U.S. Commodity Futures Trading Commission Regulation 23.434 and Appendix A thereto. This material is not intended to be individually tailored to your needs or characteristics and should not be viewed as a “call to action” or suggestion that you enter into a swap or trading strategy involving a swap or any other transaction. Scotiabank may engage in transactions in a manner inconsistent with the views discussed this report and may have positions, or be in the process of acquiring or disposing of positions, referred to in this report.
Scotiabank, its affiliates and any of their respective officers, directors and employees may from time to time take positions in currencies, act as managers, co-managers or underwriters of a public offering or act as principals or agents, deal in, own or act as market makers or advisors, brokers or commercial and/or investment bankers in relation to securities or related derivatives. As a result of these actions, Scotiabank may receive remuneration. All Scotiabank products and services are subject to the terms of applicable agreements and local regulations. Officers, directors and employees of Scotiabank and its affiliates may serve as directors of corporations.
Any securities discussed in this report may not be suitable for all investors. Scotiabank recommends that investors independently evaluate any issuer and security discussed in this report, and consult with any advisors they deem necessary prior to making any investment.
This report and all information, opinions and conclusions contained in it are protected by copyright. This information may not be reproduced without the prior express written consent of Scotiabank.
™ Trademark of The Bank of Nova Scotia. Used under license, where applicable.
Scotiabank, together with “Global Banking and Markets”, is a marketing name for the global corporate and investment banking and capital markets businesses of The Bank of Nova Scotia and certain of its affiliates in the countries where they operate, including; Scotiabank Europe plc; Scotiabank (Ireland) Designated Activity Company; Scotiabank Inverlat S.A., Institución de Banca Múltiple, Grupo Financiero Scotiabank Inverlat, Scotia Inverlat Casa de Bolsa, S.A. de C.V., Grupo Financiero Scotiabank Inverlat, Scotia Inverlat Derivados S.A. de C.V. – all members of the Scotiabank group and authorized users of the Scotiabank mark. The Bank of Nova Scotia is incorporated in Canada with limited liability and is authorised and regulated by the Office of the Superintendent of Financial Institutions Canada. The Bank of Nova Scotia is authorized by the UK Prudential Regulation Authority and is subject to regulation by the UK Financial Conduct Authority and limited regulation by the UK Prudential Regulation Authority. Details about the extent of The Bank of Nova Scotia's regulation by the UK Prudential Regulation Authority are available from us on request. Scotiabank Europe plc is authorized by the UK Prudential Regulation Authority and regulated by the UK Financial Conduct Authority and the UK Prudential Regulation Authority.
Scotiabank Inverlat, S.A., Scotia Inverlat Casa de Bolsa, S.A. de C.V, Grupo Financiero Scotiabank Inverlat, and Scotia Inverlat Derivados, S.A. de C.V., are each authorized and regulated by the Mexican financial authorities.
Not all products and services are offered in all jurisdictions. Services described are available in jurisdictions where permitted by law.