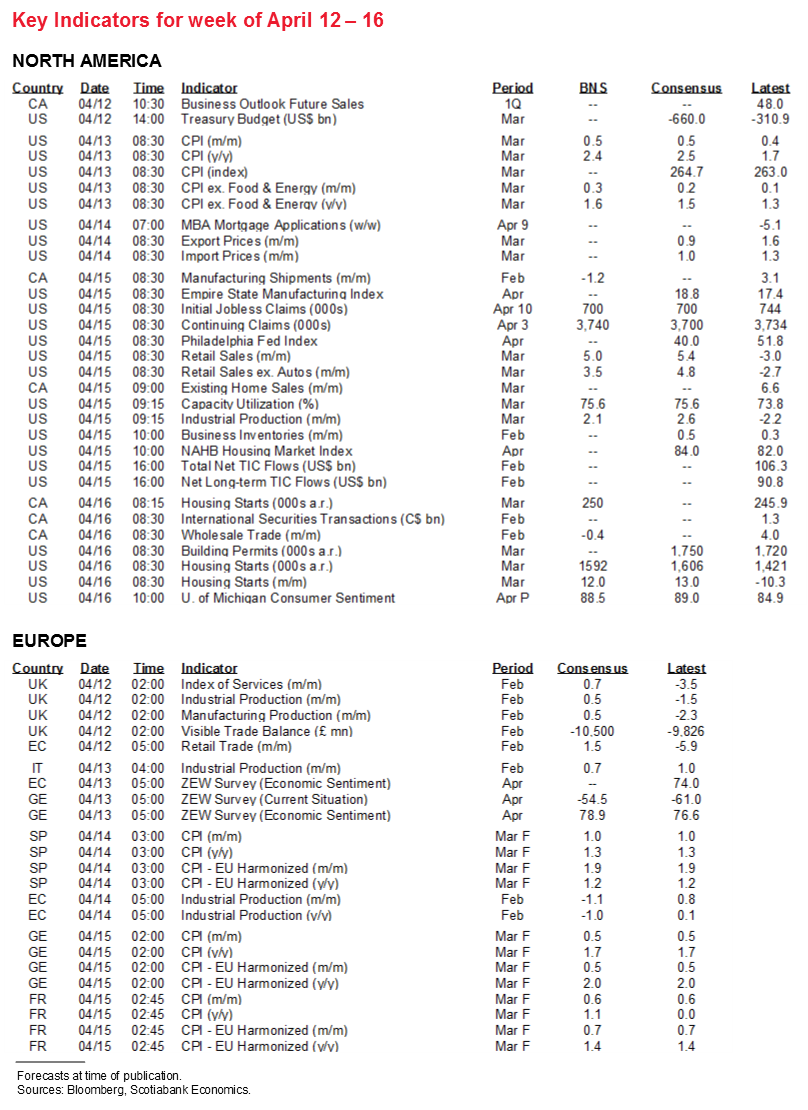
Next Week's Risk Dashboard
• US earnings season
• US inflation
• CDN inflation update
• Canadian housing
• CDN CPI
• Fed’s Powell
• China’s economy
• US retail sales, industrial output
• Australian jobs
• CBs: RBNZ, BoK
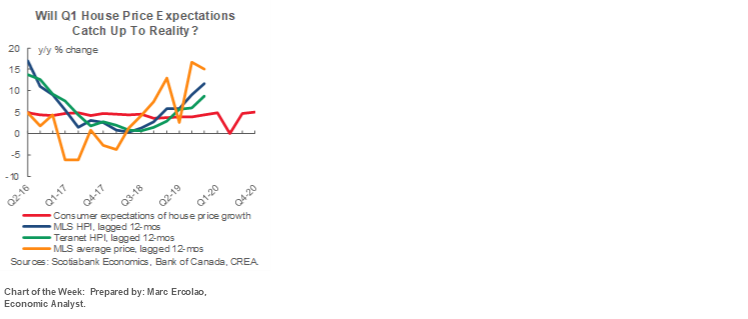
Chart of the Week
EARNINGS—It May be Rich to Say Equities are Rich!
US earnings season kicks off next week with twenty-four S&P500 firms releasing. The typical early focus is mostly on financials and this time will be no different. Key names will include firms like JP Morgan, Goldman Sachs, Morgan Stanley, Citigroup, BofA, Wells Fargo, BlackRock, BoNYM, and State Street. A sprinkling of nonfinancials will include Delta and PepsiCo.
The analyst community is rather upbeat on the forward path for earnings (chart 1). The healing is continuing from the harshest results reported in the aftermath of the first wave’s shocks. Forward guidance from companies that informs this expected future path will probably be more important than actual results for Q1. In particular, watch for discussion and possible guidance around banks’ capital management plans given the flexibility granted by the Federal Reserve on dividend payouts and buybacks by June.

If the usual pattern holds, then the season might face further upside. As chart 2 demonstrates, earnings beats have been common ever since Sarbanes-Oxley legislation after which analysts turned more conservative for fear of being pilloried, ostracized or held directly liable. The vast majority of seasons have witnessed strong beat ratios defined as the share of reporting companies beating analysts’ expectations.

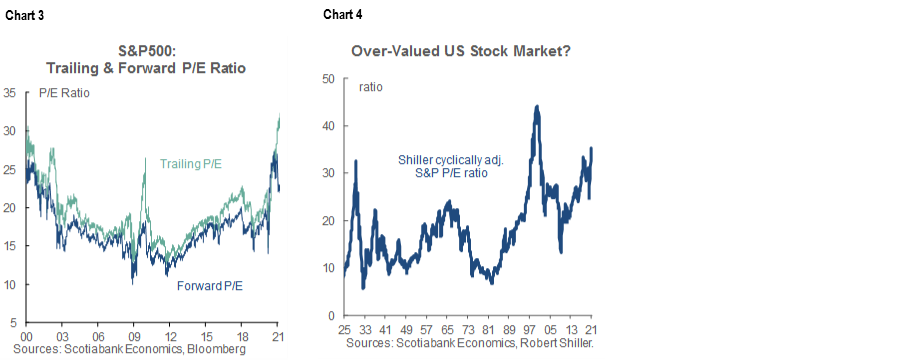
Enter the question of what’s priced and whether equities are overly rich. Judged by a conventional 12-month trailing price-to-earnings ratio, equities are looking rather rich indeed with the S&P at 33.5 times earnings (chart 3). Using Shiller’s Cyclically-Adjusted Price-to-Earnings ratio (CAPE) that compares prices to a rolling ten year earnings cycle also looks rather rich (chart 4). Obviously, the denominators in both of these ratios are distorted by the depths of the pandemic which is no longer relevant to markets that began pricing a more upbeat outlook almost instantaneously a year ago. They are also distorted by the prolonged post-GFC recovery.
Instead, current price to expected future earnings one-year forward stands at 23.7 times and two-years forward sits at 20.6 times (chart 5). Forward earnings encapsulate an attempt at measuring effects of vaccines coupled with unprecedented fiscal and monetary policy stimulus. That doesn’t strike one as particularly rich if analysts are anywhere close to the mark with their earnings calls even sans what have become fairly routine upsides to their expectations.

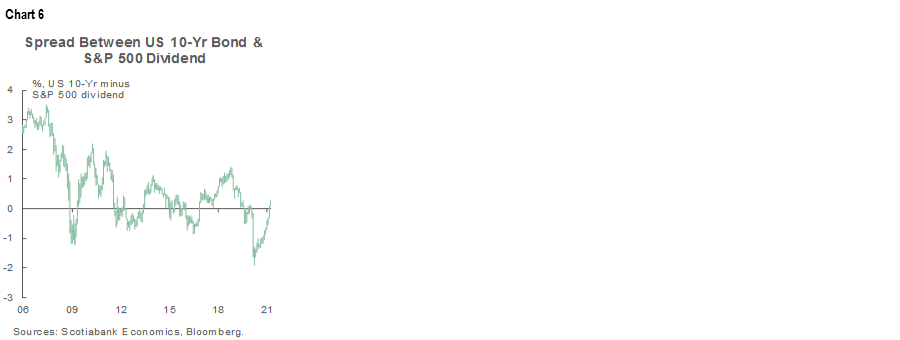
Dividend yield is another way of looking at valuations. The yield on the S&P500 sits at 1.4% which inverts the prior relationship to the US 10-year Treasury yield that now sits materially above 1.4% (chart 6). There are a lot of adjustments one would have to make to this casual relationship, but one of the more important ones would involve marrying the spot figure to expectations for payouts on expected future earnings. The analyst consensus expects dividend yields to rise going forward, but probably not as fast as we forecast the 10-year Treasury yield to increase. That means valuation measures should tilt toward capital gains expectations more so than income.
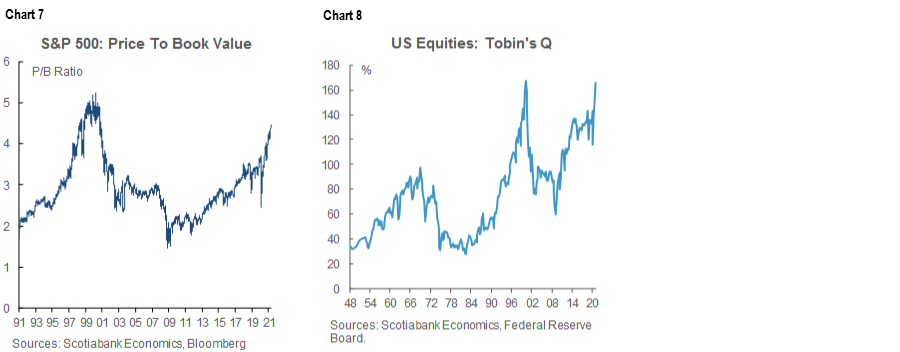
Other valuation measures also appear rich, though they tend to rely upon price measures expressed relative to historical accumulated book values (chart 7) and attempts at estimating the replacement value of assets (chart 8) rather than future earnings and book values.
Judge for yourself, but I’d rather ride out expected earnings growth through the full cycle ahead that I don’t view as fully priced, than hide out in, say, safe havens like Treasuries that are relatively more likely to incur additional capital losses. Whether it’s good policy or not is a judgement that time will take some time to tell, but in the meantime, the pedal-to-the-metal approach on both monetary and fiscal policy points to a continued reflationary environment—assuming the moderates in the Democrats can temper the aggressive tax hikes sought within President Biden’s opening salvos in the American Jobs Plan and the pending American Families Plan.
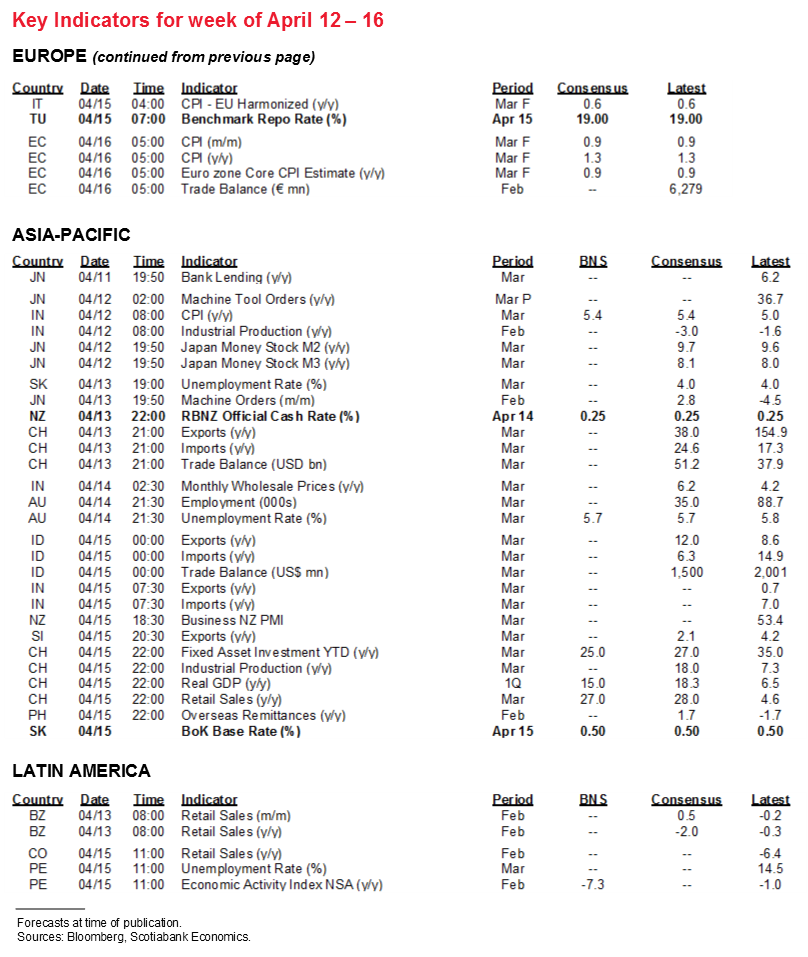
INFLATION—DOUBTING ‘TRANSITORY’
Next week is going to kickstart the debate over what’s really driving nearer term inflation readings in the US economy. We’ll get CPI on Tuesday for the month of March and it could be a doozy. While it’s not the Fed’s preferred gauge, it will also inform expectations for the Fed’s preferred PCE measures on April 30th.
We’ll get the first CPI print over 2% y/y since just before the pandemic—well over 2%. 2.5% y/y is my guessestimate and it could well be materially higher than that. It’s worth walking through the drivers and where they could go from here.
Chair Powell says inflation will be base effect driven and so ignore it as transitory, but that’s very unclear. Holding everything else constant would drive inflation from 1.7% to 1.9% on base effects alone, so rebasing to before we all began aging exponentially last March shouldn’t explain that much of the upswing.
Another component is how to judge typical seasonality in an atypical year. March is less certain by way of seasonal price swings and can be all over the map, as opposed to, say, January–February when new Spring lines start rolling out. I went with 0.2% m/m for headline CPI which takes us up to 2.1% y/y, but pre-pandemic months of March could be anywhere between 0–0.5% m/m so it can be a bit of a wild month. Also, gas prices are ripping higher this year along with greater mobility and jumped by 10% m/m in March which, at a 3% weight, adds another three-tenths to headline CPI in month-over-month terms.
Of relevance to inflation bonds (TIPS) that are based on CPI is that this translates into a CPI index level of about 264.3—or higher.
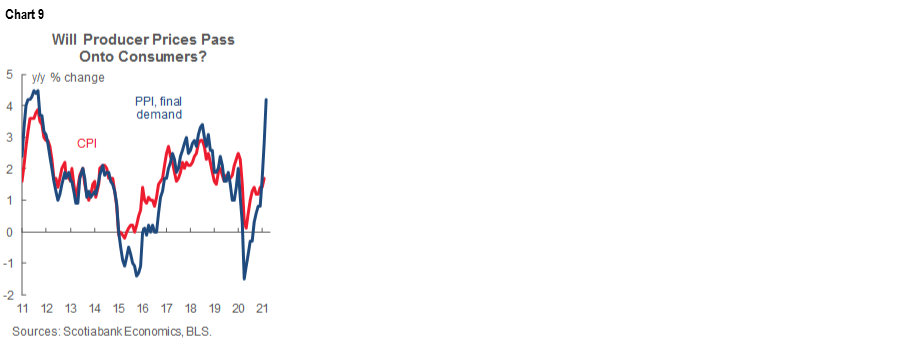
The toughest wildcard of all is the extent to which supply chain pressures on producer prices are being passed through to consumers in seasonally abnormal ways given all the bottlenecks this year. Final demand producer prices accelerated at the fastest pace since late 2011 last month (+4.2% y/y, +1% m/m) and this measure is very highly correlated with headline CPI inflation (chart 9) although CPI is somewhat less volatile at rapid turning points. This is where upside risk to 2.5% y/y could arise.
If typical passthrough occurs, then I’m not sure how transitory that factor is going to be (versus Powell’s insistence). Supply chains are damaged for the cycle by Trump’s trade wars and scarring from the pandemic plus idiosyncratic issues like semiconductor shortages that are going to take a long time to address. The life cycle hypothesis of demographic influences upon inflation is at an upward turning point compared to the past, while trade liberalization that long ago dampened inflation is a thing of the past.
Which takes us to one thing to watch as the US Q1 earnings season kicks off next week but especially in subsequent weeks as more nonfinancials report. Watch for company guidance on price pressures that may offer anecdotes to inform pass-through versus margin absorption tendencies across industries.
As for Powell’s insistence that one should look through the pressures as transitory, not everyone agrees including some folks at the Fed. This is a highly accessible and brief outline of why St. Louis Fed President Bullard sees upside risk to inflation. Theories based upon record-shattering money expansion and fiscal stimulus plus the Phillips curve relationship linked back to spare capacity have chequered histories in terms of how they performed at explaining past inflation, but Bullard rightly notes that they are all pointing in the same unified and higher direction, on top of the fact that the Fed’s reaction function to price pressures has changed.
To Bullard’s point, M2 money growth is running at record highs (+27% y/y) held back by velocity of money in circulation, but temporarily so since the ongoing recovery will boost velocity of money in circulation based on its definition as nominal GDP over money supply. As for fiscal stimulus, the US$900 billion December 2020 COVID relief bill plus the US$1.9 trillion March 2021 bill plus the proposed US$2.25 trillion American Jobs Plan plus an uncertain estimate for the pending American Families Plan could well total +/-30% of present nominal GDP. The stimulus offered within four US fiscal packages since December offers a mixture of current and longer-lived spending. It won't all pass, but it will still a) address the concerns of some Fed officials that there will be a future fiscal cliff as the effects of the December 2020 and March 2021 bills wane, and b) represent fiscal stimulus of a cumulative magnitude that few reading this are likely old enough to have lived through!
CANADIAN HOUSING—FROTH VERSUS BETTER MANAGEMENT
Canada’s housing market will continue to be a focal point.
On Monday, the Bank of Canada will update its quarterly Canadian Survey of Consumer Expectations for everything from inflation and jobs to house prices. Governor Macklem recently completely changed his tune and indicated the BoC is seeing extrapolative house price expectations that raise concern about housing imbalances, and his remarks might have tipped off expectations for stronger consumer forecasts for house price gains in the survey. Subsequently, the BoC released this staff piece that flagged increased concern toward housing imbalances over recent months. These communications contrast with a relatively sanguine if not defensive attitude by the BoC to housing strength last year that they dismissed as driven by a transitory burst of pent-up demand and something that was a welcome source of economic growth. That was an exaggerated take, but my how times have changed at the BoC.
Thursday’s national tally for existing home sales during March will shoot for a fourth consecutive gain and the ninth gain in eleven months which should not be hard to achieve given strength we’ve already seen in results from cities like Toronto, Vancouver and Calgary. Housing starts during March are due out on Friday and expected to hold around the elevated quarter-million annualized pace.
Strong numbers may further agitate debate over tightening macroprudential policies ahead of the following week’s Federal Budget (April 19th) and BoC decision (April 21st). The recent proposal by the federal bank regulator (here) to further pad the uninsured mortgage stress test by adding about ½% to the minimum rate floor that will increase from 4.79% to 5.25% could bring forward a modest amount of additional housing demand into the current Spring housing market before the rule changes that are slated to take effect by early June. Finance Minister Freeland’s announcement (here) sounds like she will hold off any potential changes affecting uninsured mortgages that are under her jurisdiction until after the OSFI consultations on the proposed uninsured changes.
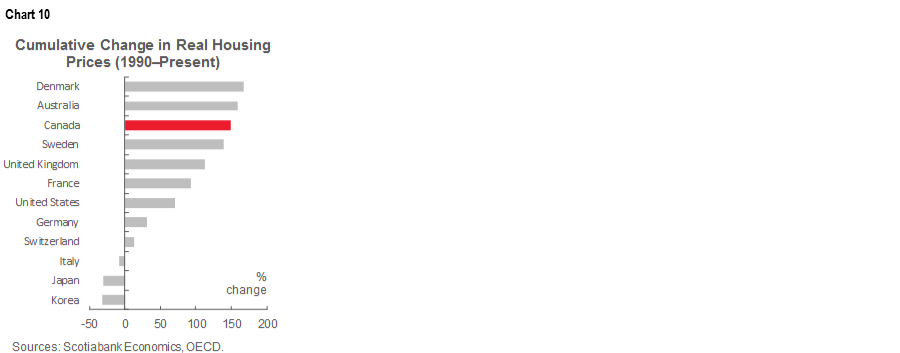
As argued here, however, it’s not just a rate argument behind housing strength—although promising indebted Canadian households that rates wouldn’t go up for years probably played a substantial role in a policy over reach by the BoC. Strong job growth, stockpiled savings and less spending on pandemic-stricken activities could well be behind strength in demand for mortgages and homes. In a longer run sense, it might even be that one of the reasons why Canada has had among the strongest cumulative house price gains over a long period of time (chart 10) owes itself to a better managed system that didn’t blow up during the Global Financial Crisis and is premised upon a sounder housing finance framework.
HONOURABLE MENTIONS
There will be several other gems on the global calendar over the coming week including a mixture of top shelf macro indicators and limited central bank guidance.
i) Central banks
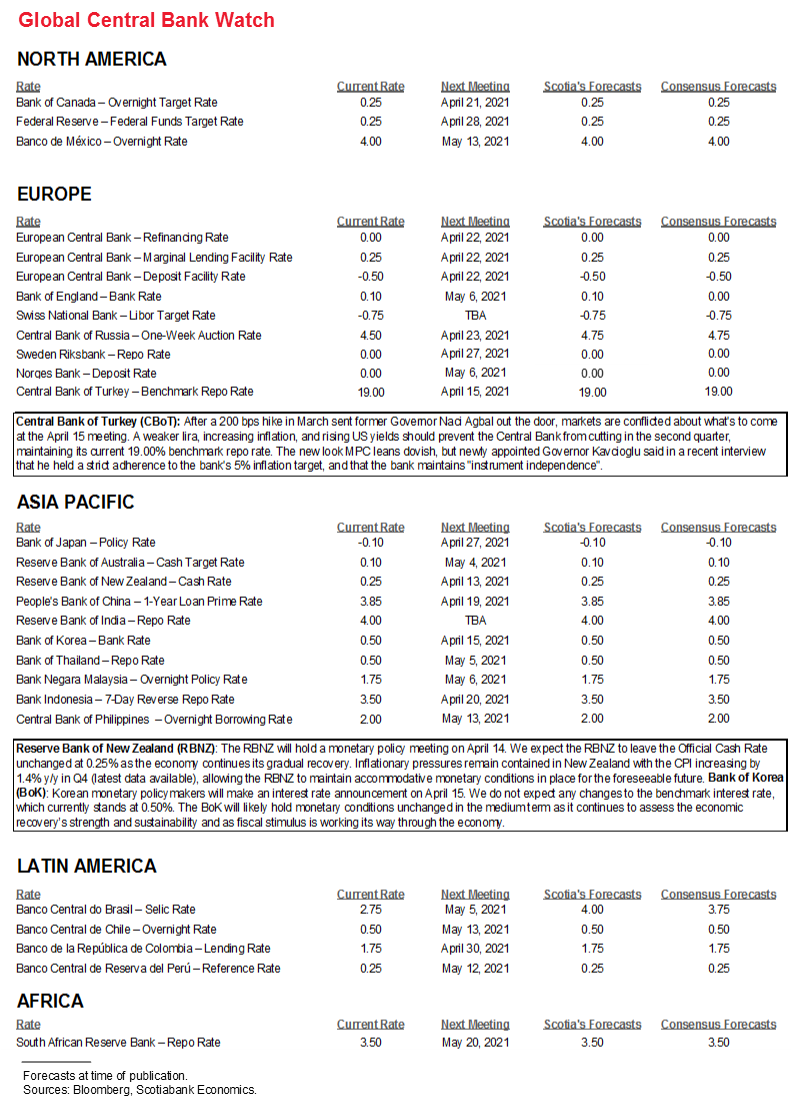
Central banks are unlikely to figure prominently until the week after next when we’ll have a keen eye on Bank of Canada decisions. In the meantime, Fed Chair Powell will make two appearances, one on Sunday night on the tv program ’60 minutes’ which will probably be similar in nature to his past appearance on that show during which he spoke to a general audience. He speaks again on Wednesday in a virtual interview with the Economic Club of Washington (12pmET). Vice Chair Clarida also speaks a little later on Wednesday about the Fed’s new framework.
Neither the RBNZ in its first policy decision since February 23rd (Tuesday night ET) nor the Bank of Korea (Thursday) is expected to alter policy.
ii) China’s economy
A treasure trove of Chinese macro reports will spice up the week. Q1 GDP (Thursday night ET) is expected to strongly accelerate in year-over-year terms but mainly because the figure will compare to the 9.7% q/q non-annualized contraction during the first quarter of last year when the pandemic’s effects struck with full force. Pay more heed to the quarter-over-quarter reading for 2021Q1 that is estimated to land around 1 ½% non-annualized. Other reports that same evening on industrial output and retail sales during March will need to control for a similar year-ago comparison distortion and ditto for trade figures toward the start of the week. China will also update aggregate financing figures for March (day tbd) in the context of persistent strength notwithstanding jawboning from officials that indicate a preference toward cooler growth.
iii) Other US releases
Retail sales for March will dominate the rest of the US calendar’s focus beyond inflation. I went with a 5% m/m rise based upon a 13% m/m gain in auto sales with a 19% weight, about a 10% m/m rise in gasoline prices with a 7.5% weight and a weather rebound effect for core sales excluding gas and autos.
Also watch for strength across industrial readings including an expected rebound in industrial production (Thursday) based upon a reversal of the Fed’s estimated weather effect on February’s 2.2% drop. The Philly Fed and Empire metrics will kickstart ISM-manufacturing tracking for April (Thursday). UofM consumer sentiment should end the week with another jobs and stimulus-fed gain.
iv) Other global releases.
Statistics Canada will update CPI from November through February on Monday in order to account for changed consumer spending basket weights during the pandemic. The results are likely to marginally raise estimated inflation compared to official estimates before StatsCan permanently adopts the revised basket weights starting with the June CPI release. We’re unlikely to get a feel for the consequences to core inflation until the June release. Canada should see weakness in February manufacturing sales (Thursday) based upon StatsCan’s guidance for a 1% drop. Friday’s wholesale trade figures for the same month were guided to be down by 0.4% m/m.
European releases will be light. UK industrial output, the services index, trade figures and monthly GDP arrive on Monday. Eurozone ZEW investor confidence (Tuesday) and Sweden’s CPI update for March (Wednesday) round it out.
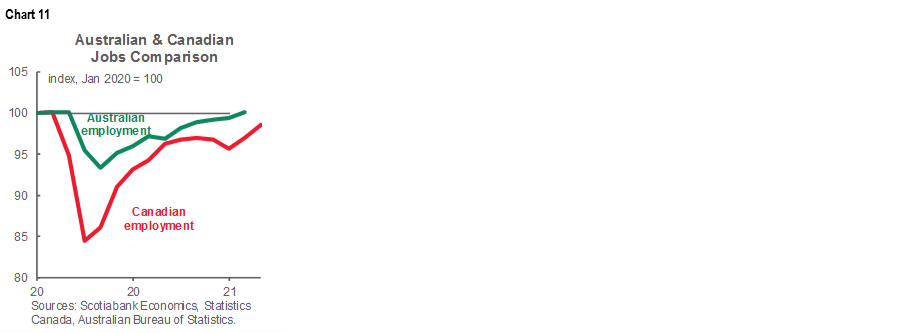
Australia will shoot for a sixth consecutive material job gain when March figures arrive on Wednesday night (ET). Australia has already recouped all of the jobs lost to the pandemic in an experience that has been similar to Canada’s experience (chart 11). These two open economies can of course be buffeted by global shocks, but they are generally repeating the greater-than-average resilience that marked their experiences during the GFC.
India updates CPI inflation (Monday) that is likely to rise toward the 5 ½% y/y mark and hence toward the upper limit of the RBI’s 2–6% target range that may be viewed as driven by transitory factors.

DISCLAIMER
This report has been prepared by Scotiabank Economics as a resource for the clients of Scotiabank. Opinions, estimates and projections contained herein are our own as of the date hereof and are subject to change without notice. The information and opinions contained herein have been compiled or arrived at from sources believed reliable but no representation or warranty, express or implied, is made as to their accuracy or completeness. Neither Scotiabank nor any of its officers, directors, partners, employees or affiliates accepts any liability whatsoever for any direct or consequential loss arising from any use of this report or its contents.
These reports are provided to you for informational purposes only. This report is not, and is not constructed as, an offer to sell or solicitation of any offer to buy any financial instrument, nor shall this report be construed as an opinion as to whether you should enter into any swap or trading strategy involving a swap or any other transaction. The information contained in this report is not intended to be, and does not constitute, a recommendation of a swap or trading strategy involving a swap within the meaning of U.S. Commodity Futures Trading Commission Regulation 23.434 and Appendix A thereto. This material is not intended to be individually tailored to your needs or characteristics and should not be viewed as a “call to action” or suggestion that you enter into a swap or trading strategy involving a swap or any other transaction. Scotiabank may engage in transactions in a manner inconsistent with the views discussed this report and may have positions, or be in the process of acquiring or disposing of positions, referred to in this report.
Scotiabank, its affiliates and any of their respective officers, directors and employees may from time to time take positions in currencies, act as managers, co-managers or underwriters of a public offering or act as principals or agents, deal in, own or act as market makers or advisors, brokers or commercial and/or investment bankers in relation to securities or related derivatives. As a result of these actions, Scotiabank may receive remuneration. All Scotiabank products and services are subject to the terms of applicable agreements and local regulations. Officers, directors and employees of Scotiabank and its affiliates may serve as directors of corporations.
Any securities discussed in this report may not be suitable for all investors. Scotiabank recommends that investors independently evaluate any issuer and security discussed in this report, and consult with any advisors they deem necessary prior to making any investment.
This report and all information, opinions and conclusions contained in it are protected by copyright. This information may not be reproduced without the prior express written consent of Scotiabank.
™ Trademark of The Bank of Nova Scotia. Used under license, where applicable.
Scotiabank, together with “Global Banking and Markets”, is a marketing name for the global corporate and investment banking and capital markets businesses of The Bank of Nova Scotia and certain of its affiliates in the countries where they operate, including; Scotiabank Europe plc; Scotiabank (Ireland) Designated Activity Company; Scotiabank Inverlat S.A., Institución de Banca Múltiple, Grupo Financiero Scotiabank Inverlat, Scotia Inverlat Casa de Bolsa, S.A. de C.V., Grupo Financiero Scotiabank Inverlat, Scotia Inverlat Derivados S.A. de C.V. – all members of the Scotiabank group and authorized users of the Scotiabank mark. The Bank of Nova Scotia is incorporated in Canada with limited liability and is authorised and regulated by the Office of the Superintendent of Financial Institutions Canada. The Bank of Nova Scotia is authorized by the UK Prudential Regulation Authority and is subject to regulation by the UK Financial Conduct Authority and limited regulation by the UK Prudential Regulation Authority. Details about the extent of The Bank of Nova Scotia's regulation by the UK Prudential Regulation Authority are available from us on request. Scotiabank Europe plc is authorized by the UK Prudential Regulation Authority and regulated by the UK Financial Conduct Authority and the UK Prudential Regulation Authority.
Scotiabank Inverlat, S.A., Scotia Inverlat Casa de Bolsa, S.A. de C.V, Grupo Financiero Scotiabank Inverlat, and Scotia Inverlat Derivados, S.A. de C.V., are each authorized and regulated by the Mexican financial authorities.
Not all products and services are offered in all jurisdictions. Services described are available in jurisdictions where permitted by law.