- Canada’s economy is tracking very soft Q3 growth
- Implications for the BoC
- US core PCE inflation is not light, and is still driven by services
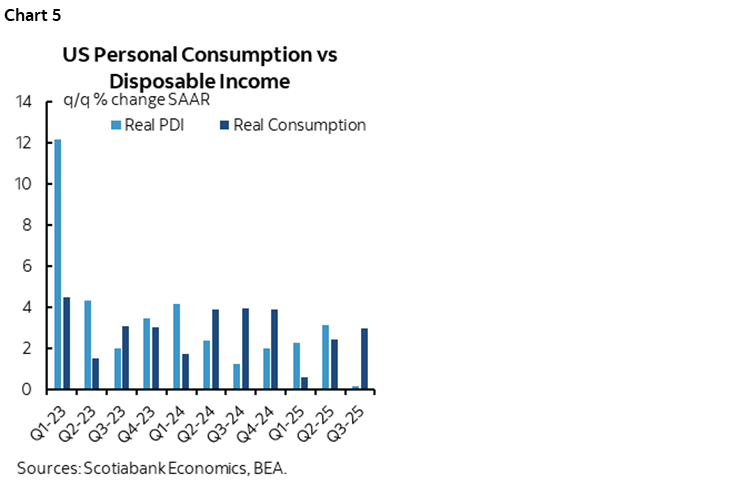
- Americans are financing spending by saving less…
- ...thereby questioning the sustainability
- Canada GDP July, m/m %, SA:
- Actual: 0.24
- Scotia: 0.1
- Consensus: 0.1
- Prior: -0.1
- August ‘flash’: “essentially unchanged”
Canada’s economy is tracking very soft growth in Q3. While not a recession, it’s still an economy that’s bumbling along. I’ll go over BoC implications after recapping the figures.
July GDP grew by 0.24% m/m SA. That slightly beat Statcan’s preliminary ‘flash’ guidance from a month ago that said they were tracking half that rate of growth. The estimate also beat consensus.
Statcan’s first stab at providing advance guidance for August GDP was “essentially unchanged.” If that’s zero, say zero!
The combined effect leaves us tracking growth of only about 0.7% q/q at a seasonally adjusted and annualized rate (SAAR) in Q3. That’s hardly much of any rebound from Q2 (chart 1). This tracking takes the information we got this morning for July and August, assumes September comes in flat simply to focus the math on what’s known to date, and what we know about Q2.
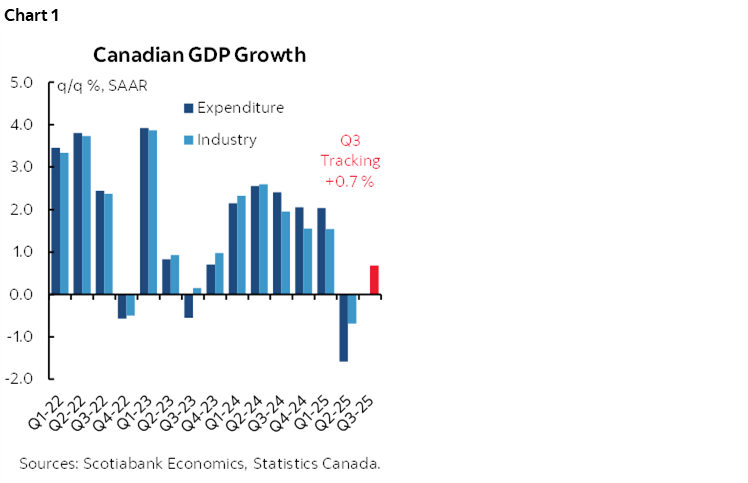
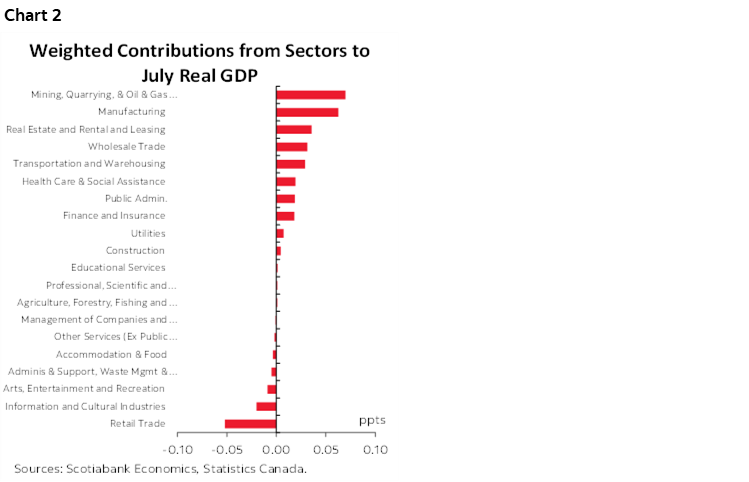
Chart 2 shows the weighted contributions to July GDP growth on a sector basis. There was significant breadth to the growth.
BoC IMPLICATIONS
The BoC is coming close to nailing it with their GDP forecasts of late. The July MPR was the last time they provided projections in their ‘current tariff scenario’ until they update them again toward the end of October.
Back then, the BoC had forecast Q2 GDP at –1.5% and we got –1.6%. They had predicted Q3 GDP at 1.0% q/q SAAR and we can’t say we are meaningfully tracking something different at this point.
The BoC and street forecast GDP on a quarterly expenditure basis. The numbers we got this morning are monthly income-based numbers. The inventory and net trade effects can be among the considerations that can drive a wedge between the two sets of accounts. With data available to date, we can’t say that the BoC’s expectations are being meaningfully surprised.
Therefore, all else equal, they'd be of the view that a touch more slack vindicates the September cut and still keeps them focused upon other data dependencies like the next batch of data before the October meeting. Unless we get some nasty surprises, I'd lean toward a skip at that meeting but tentatively and based on it being just days before Carney delayed the promised October budget to November 4th and hence after the BoC has updated all of its forecasts and is unable to do a thorough accounting of the effects of the fiscal measures that are introduced.
Such a cut-hold-cut possible path would be consistent with other fine-tuning stages when Canada has been hit by a terms of trade shock that the BoC has felt compelled to respond to. An example of which was in early 2015 under former Governor Poloz. Back then it was oil, today it’s tariffs.
WARM US INFLATION AS AMERICANS SPEND BEYOND THEIR INCOMES
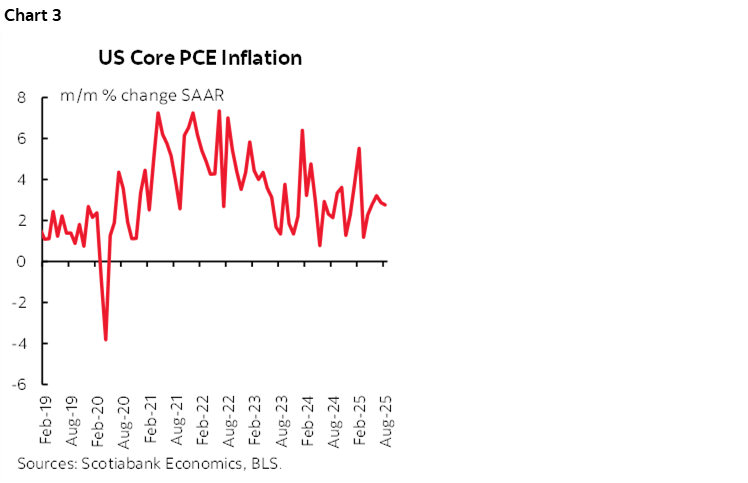
US core PCE inflation landed at 0.23% m/m SA, or 2.8% m/m SAAR. That’s not light and maintains the pattern of core readings above the 2% total PCE target (chart 3).
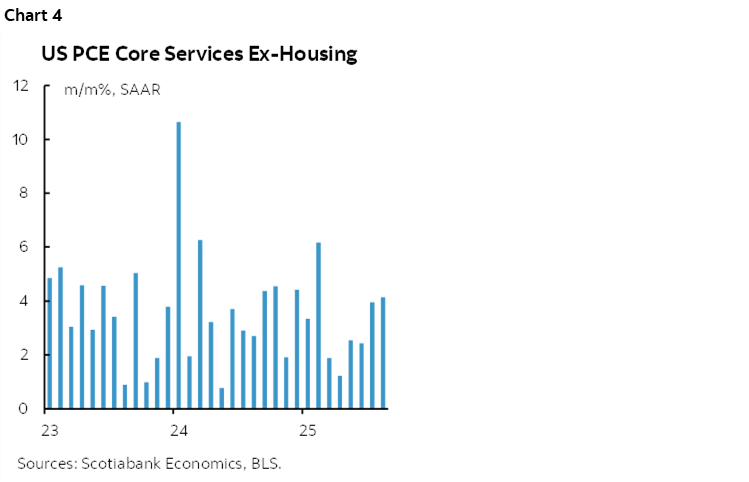
Key is also that despite all the focus on tariff effects on goods, the heat continues to come from the services side. Core services PCE excluding energy—and housing-services was up by 4.1% m/m SAAR (chart 4). This category is about a quarter of the PCE basket.
US consumer spending grew by 0.6% m/m SA in nominal terms (0.5% consensus) and 0.4% in inflation adjusted terms.
This may be unsustainable. That’s because spending is outpacing income growth. Q3 is tracking real consumption growth of 3% q/q SAAR versus real growth in personal disposable income of only 0.2% q/q SAAR. As a result, the personal saving rate remains under downward pressure (chart 5). The saving rate was 5.7% back in April and has fallen by 1.1 ppts since then.
DISCLAIMER
This report has been prepared by Scotiabank Economics as a resource for the clients of Scotiabank. Opinions, estimates and projections contained herein are our own as of the date hereof and are subject to change without notice. The information and opinions contained herein have been compiled or arrived at from sources believed reliable but no representation or warranty, express or implied, is made as to their accuracy or completeness. Neither Scotiabank nor any of its officers, directors, partners, employees or affiliates accepts any liability whatsoever for any direct or consequential loss arising from any use of this report or its contents.
These reports are provided to you for informational purposes only. This report is not, and is not constructed as, an offer to sell or solicitation of any offer to buy any financial instrument, nor shall this report be construed as an opinion as to whether you should enter into any swap or trading strategy involving a swap or any other transaction. The information contained in this report is not intended to be, and does not constitute, a recommendation of a swap or trading strategy involving a swap within the meaning of U.S. Commodity Futures Trading Commission Regulation 23.434 and Appendix A thereto. This material is not intended to be individually tailored to your needs or characteristics and should not be viewed as a “call to action” or suggestion that you enter into a swap or trading strategy involving a swap or any other transaction. Scotiabank may engage in transactions in a manner inconsistent with the views discussed this report and may have positions, or be in the process of acquiring or disposing of positions, referred to in this report.
Scotiabank, its affiliates and any of their respective officers, directors and employees may from time to time take positions in currencies, act as managers, co-managers or underwriters of a public offering or act as principals or agents, deal in, own or act as market makers or advisors, brokers or commercial and/or investment bankers in relation to securities or related derivatives. As a result of these actions, Scotiabank may receive remuneration. All Scotiabank products and services are subject to the terms of applicable agreements and local regulations. Officers, directors and employees of Scotiabank and its affiliates may serve as directors of corporations.
Any securities discussed in this report may not be suitable for all investors. Scotiabank recommends that investors independently evaluate any issuer and security discussed in this report, and consult with any advisors they deem necessary prior to making any investment.
This report and all information, opinions and conclusions contained in it are protected by copyright. This information may not be reproduced without the prior express written consent of Scotiabank.
™ Trademark of The Bank of Nova Scotia. Used under license, where applicable.
Scotiabank, together with “Global Banking and Markets”, is a marketing name for the global corporate and investment banking and capital markets businesses of The Bank of Nova Scotia and certain of its affiliates in the countries where they operate, including; Scotiabank Europe plc; Scotiabank (Ireland) Designated Activity Company; Scotiabank Inverlat S.A., Institución de Banca Múltiple, Grupo Financiero Scotiabank Inverlat, Scotia Inverlat Casa de Bolsa, S.A. de C.V., Grupo Financiero Scotiabank Inverlat, Scotia Inverlat Derivados S.A. de C.V. – all members of the Scotiabank group and authorized users of the Scotiabank mark. The Bank of Nova Scotia is incorporated in Canada with limited liability and is authorised and regulated by the Office of the Superintendent of Financial Institutions Canada. The Bank of Nova Scotia is authorized by the UK Prudential Regulation Authority and is subject to regulation by the UK Financial Conduct Authority and limited regulation by the UK Prudential Regulation Authority. Details about the extent of The Bank of Nova Scotia's regulation by the UK Prudential Regulation Authority are available from us on request. Scotiabank Europe plc is authorized by the UK Prudential Regulation Authority and regulated by the UK Financial Conduct Authority and the UK Prudential Regulation Authority.
Scotiabank Inverlat, S.A., Scotia Inverlat Casa de Bolsa, S.A. de C.V, Grupo Financiero Scotiabank Inverlat, and Scotia Inverlat Derivados, S.A. de C.V., are each authorized and regulated by the Mexican financial authorities.
Not all products and services are offered in all jurisdictions. Services described are available in jurisdictions where permitted by law.