- Core inflation continued to ebb in August, extending a multi-month trend…
- ...giving data-dependent cover for the BoC to cut tomorrow…
- ...that reinforces forward-looking arguments for a cut…
- ...that only began to change materially in September
- Canadian CPI, m/m%, NSA, August:
- Actual: -0.1
- Scotia: 0.1
- Consensus 0.0:
- Prior: 0.3
- Trimmed mean CPI: 2.25% m/m SAAR
- Weighted median CPI: 2.8% m/m SAAR
- CPI ex-f&e CPI: 1.6% m/m m/m SAAR
Canadian core inflation cemented a rate cut by the Bank of Canada tomorrow. That was our call before the numbers, and I gave reasons in my morning note about why today’s CPI print didn’t matter anyway (here). The figures didn’t hurt the call either as markets now have a cut fully priced and at least another one on the bag of chips theory (you can’t just take one out…). Shops that thought otherwise would presumably be changing their calls now, or would have to come up with some other new reason for holding out. For the BoC to hold tomorrow would need extremely good arguments in order to avoid materially tightening financial conditions by wiping out priced cuts.
The BoC Call
Until the start of September, markets had only a slight chance at a cut priced for tomorrow. They had spent the whole year trapped in a cycle of pushing out cut expectations and getting disappointed in serial fashion. Cut narratives were delivered on a lark absent enough supporting evidence—until the facts changed relatively recently which motivated a change in our long-held pause rate call. Reciprocal tariffs are gone. The US job market dramatically weakened including massive downward revisions that raise doubts about US resilience and what it means to Canada’s economy. The Canadian job market suddenly began souring. GDP disappointed despite strength in the domestic economy and tracking for Q3 GDP is looking soft which adds to modest slack. There are points and counterpoints about each of these arguments in the cut versus hold cases that I went over in my weekly (here), but the balance of the evidence significantly favours a cut—for now.
CPI Details
First, ignore headline CPI. It accelerated from 1.7% to 1.9% y/y partly due to a shift in year-ago base effects and a mild 0.2% m/m SA rise in August. This measure is distorted by the early April elimination of the consumer portion of the carbon tax which will depress the year-over-year headline CPI reading until next Spring when it should bounce higher once the data starts comparing to a year-ago starting point after April’s carbon tax change.
Key, however, is that all of the core inflation gauges were soft which extends the multi-month softening trend to provide data dependent cover for a cut (chart 1). Forward-looking arguments matter more as argued in my weekly, but current data strengthens the case for a cut.
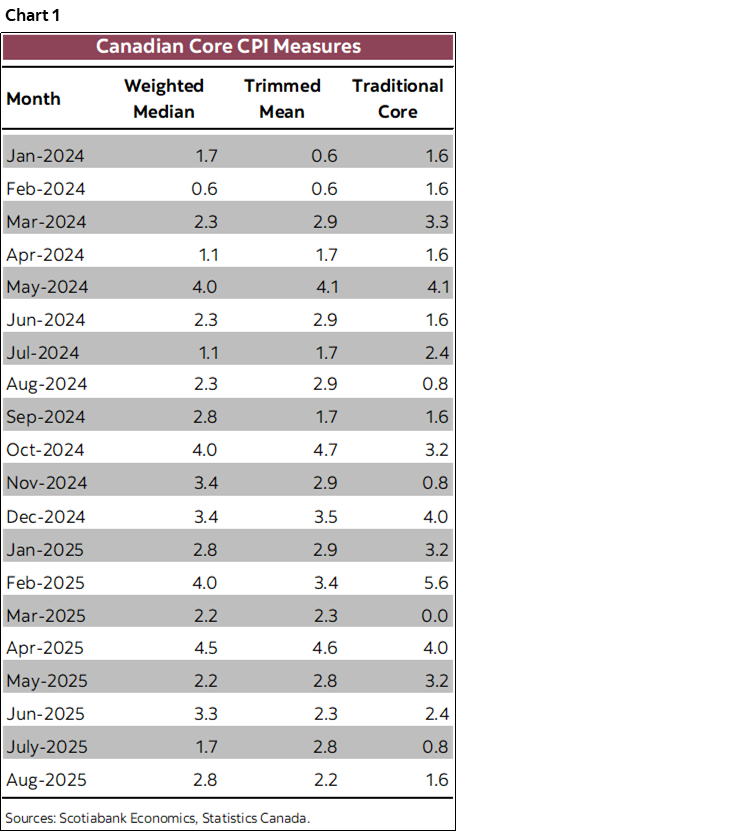
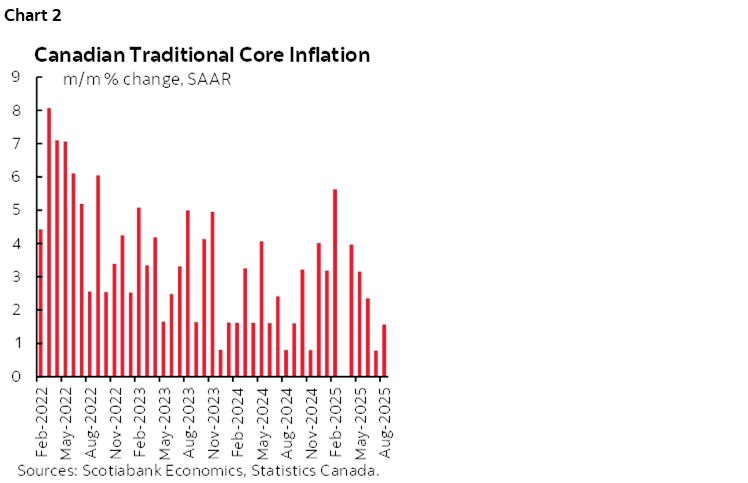
Traditional core CPI was up by only 1.6% m/m at a seasonally adjusted and annualized rate. Its three month moving average is also just 1.6% m/m SAAR (chart 2).
Trimmed mean CPI was up by 2.25% m/m SAAR (chart 3). Its three-month moving average is just 2.4%.

Weighted median CPI was up by 2.8% m/m SAAR (also chart 3). Its three-month moving average is 2.6%.
CPI excluding the effects of food, energy and indirect taxes was up by 1.6% m/m SAAR and that is our shop’s favourite although there have not been signs that Governing Council agrees. CPI excluding the eight most volatile items was up 0.8% m/m SAAR. CPIX was up 0.8% as well.
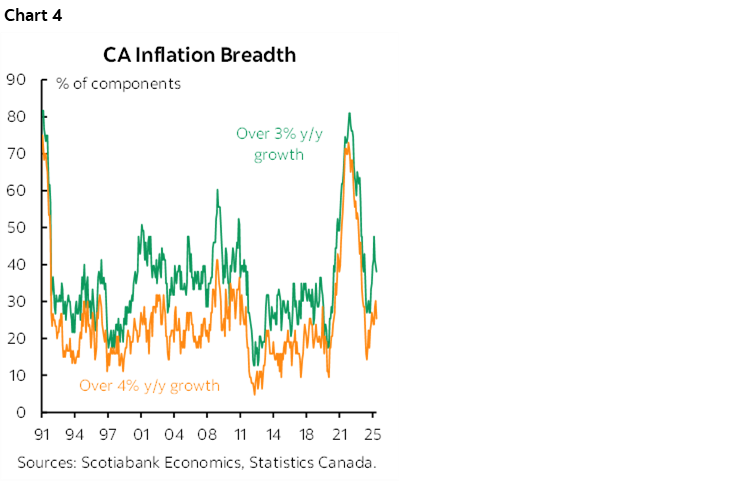
Further, breadth pulled back again (chart 4).
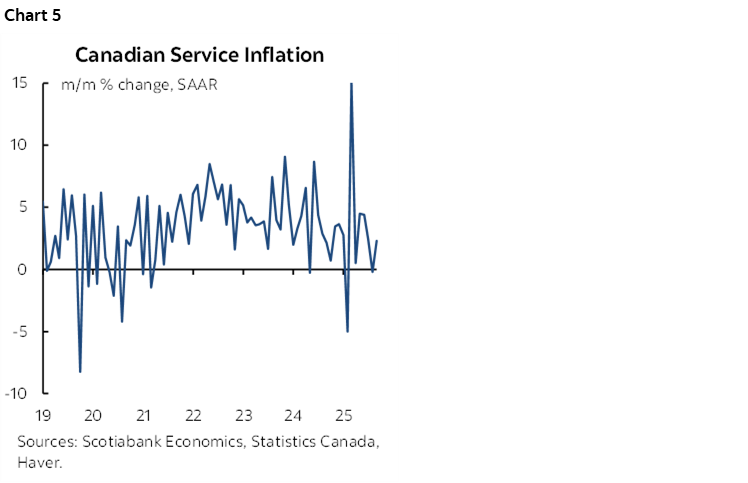
Services inflation has been softening (chart 5).
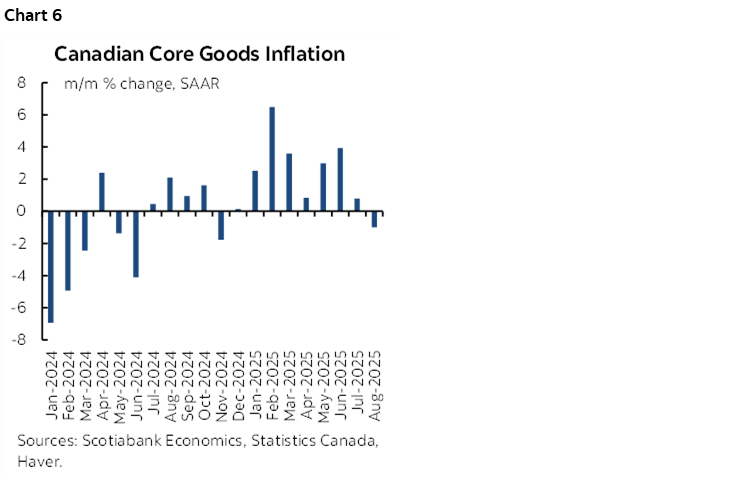
Core goods inflation (ex-food and energy) has also been softening (chart 6).
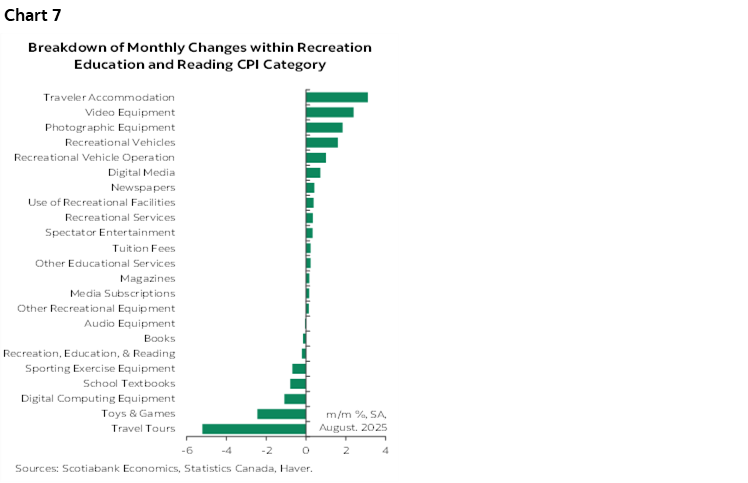
Recreation/reading/education—or the leisure category—fell –0.2% m/m SA and carries about a 10% weight as travel prices conflicted (chart 7).
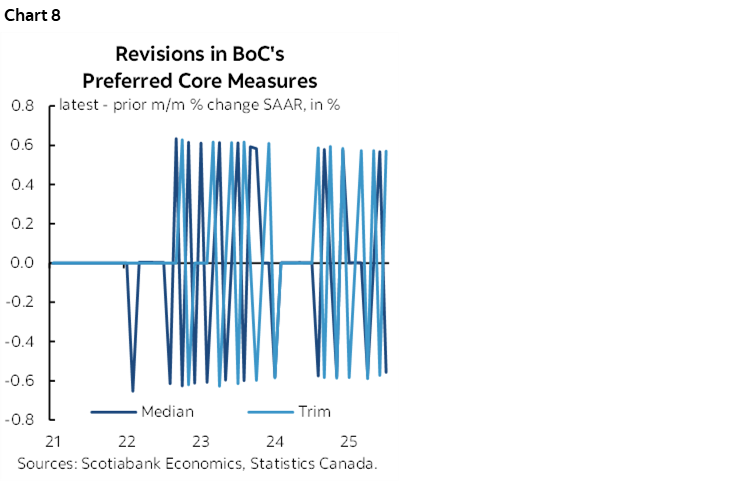
Statcan got out the etch-a-sketch for revisions and scribbled what’s shown in chart 8. They don’t revise underlying seasonally UNadjusted price data, but they do revise SA factors each time in a mechanistic model-based way using standard international procedures. The revisions each month cancel out over time in a series of wild ups and downs but lend caution to attaching too much significance to any one month’s data.
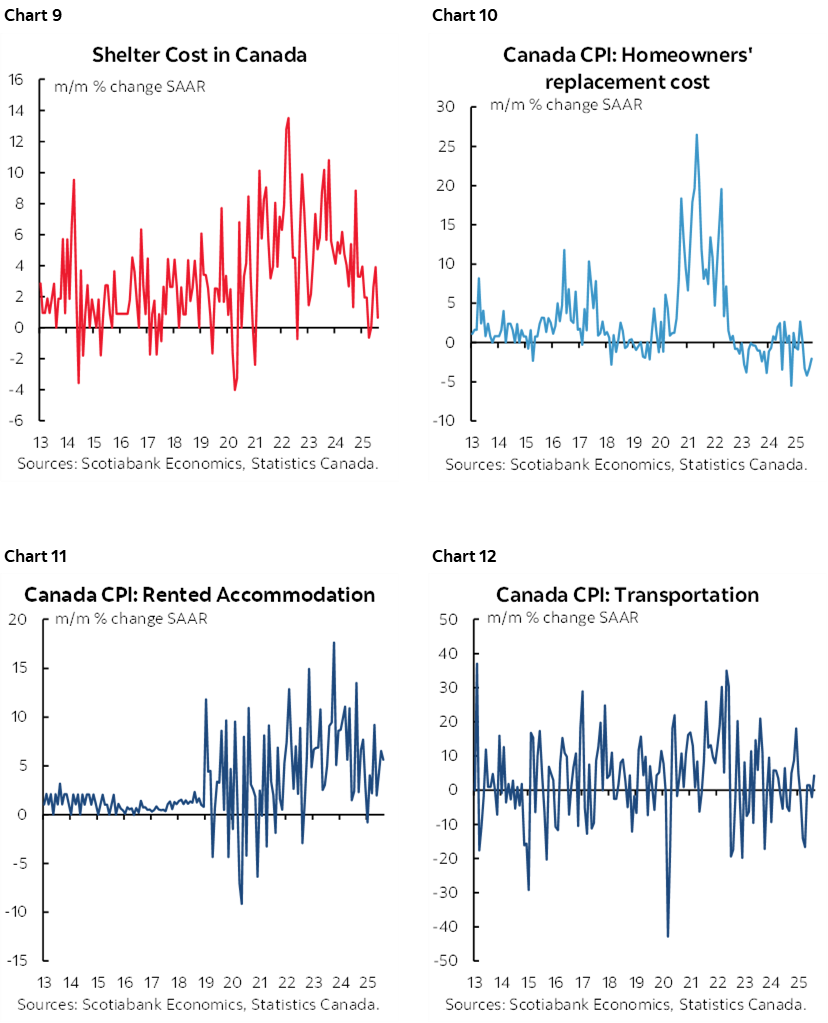
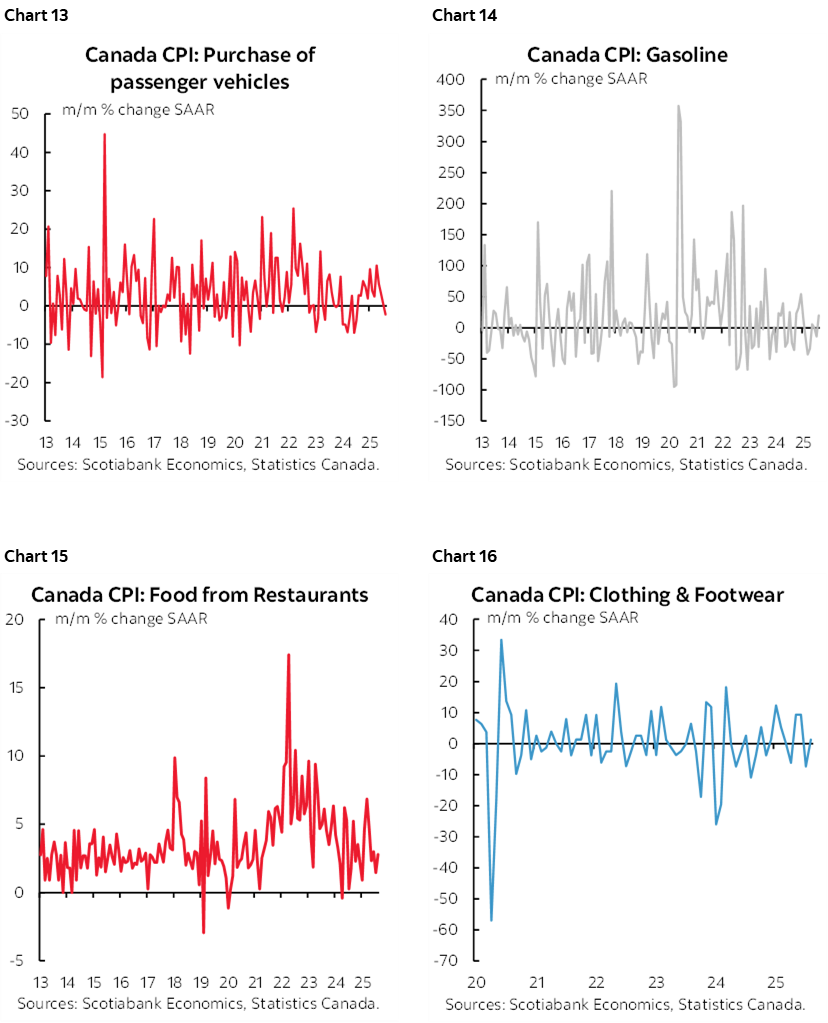
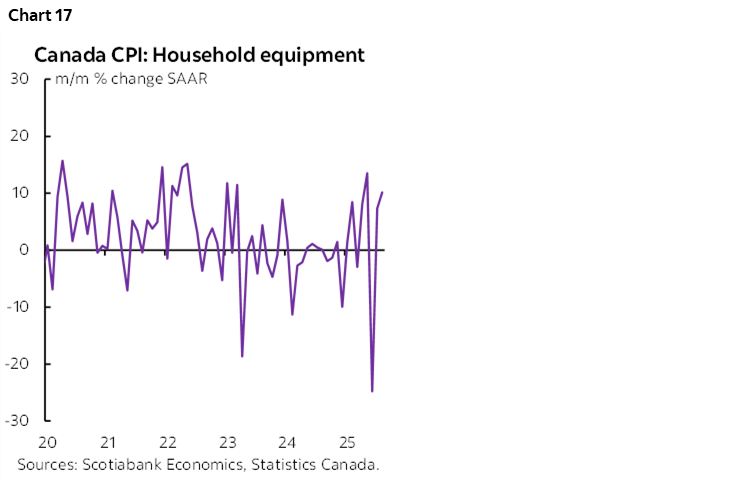
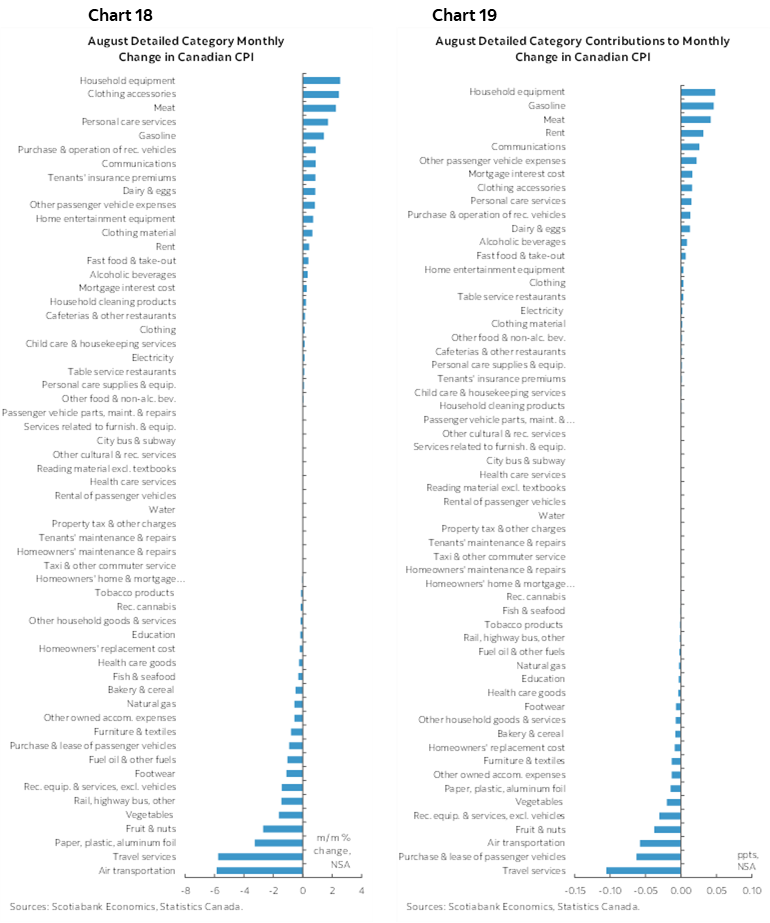
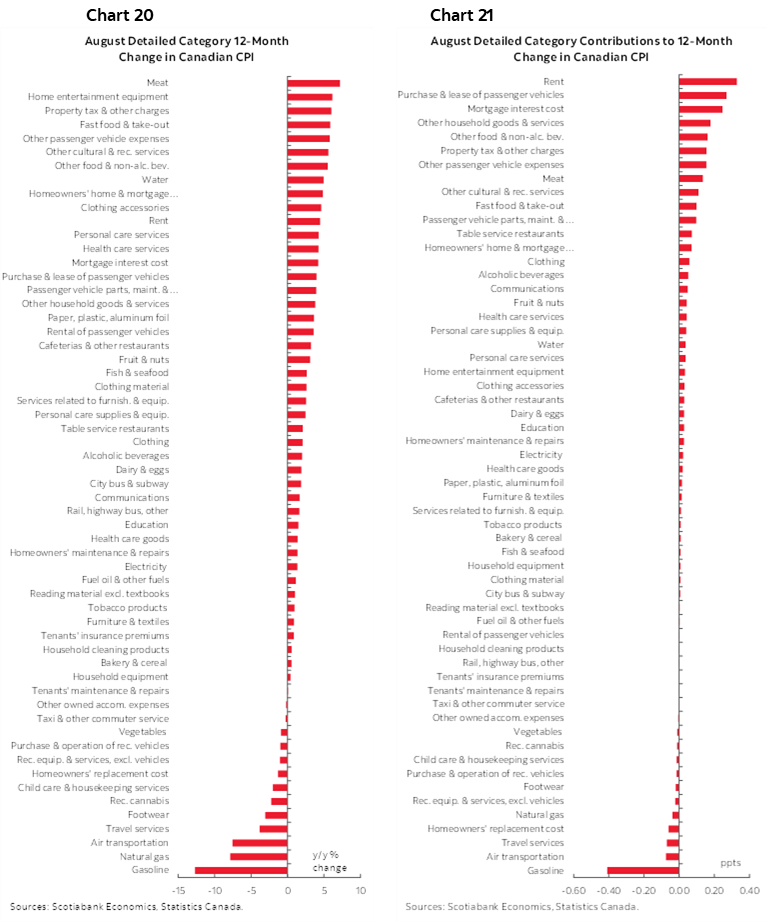
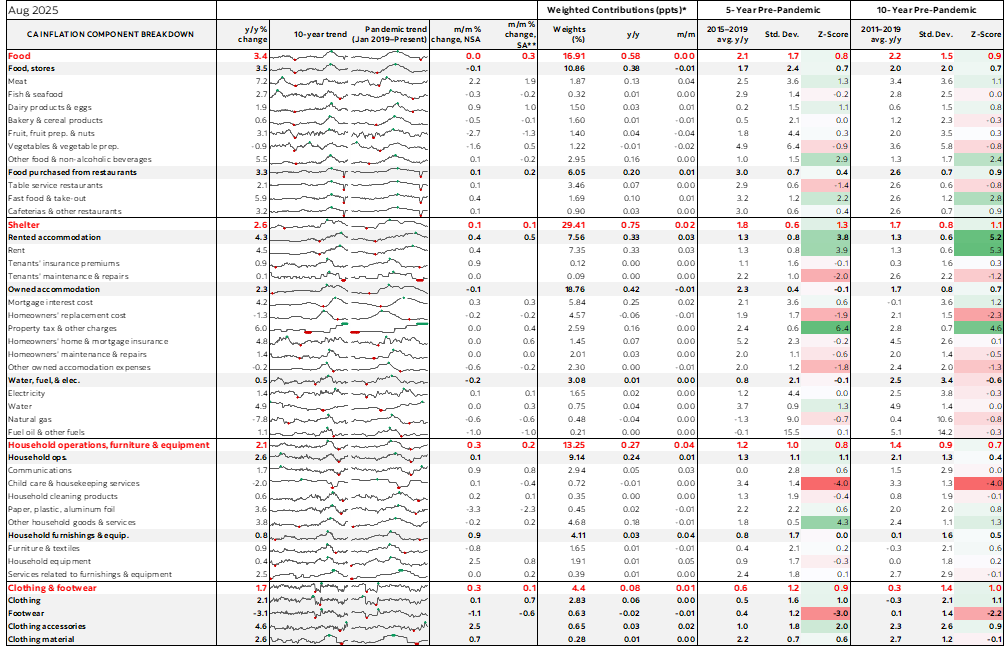
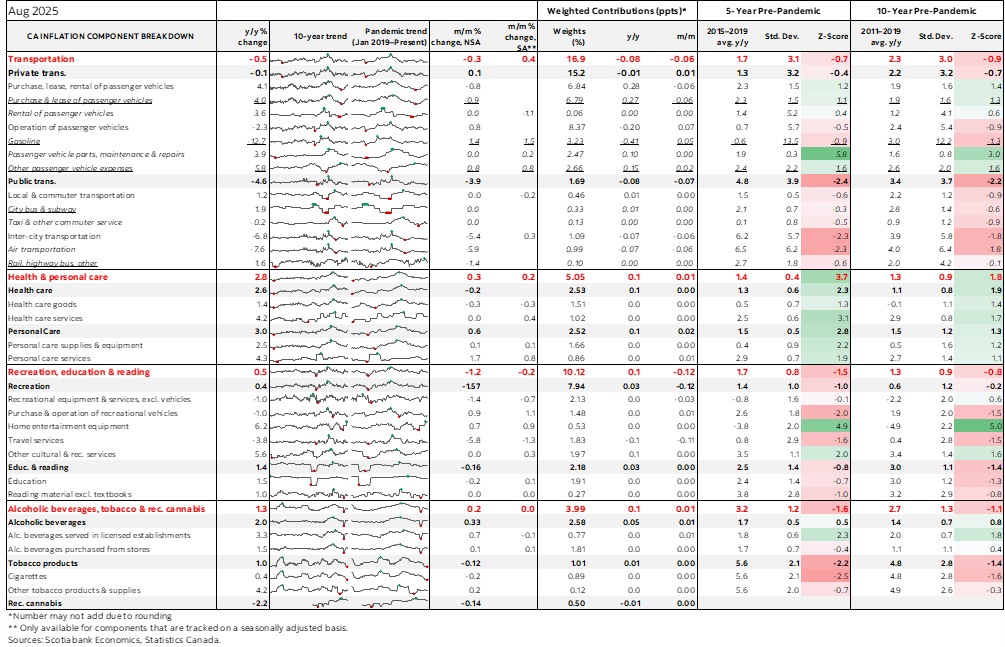
Charts 9–17 break down individual parts of the basket. Charts 18–19 break it down in m/m and weighted contributions to m/m inflation. Charts 20–21 do likewise for year-over-year. Also see the accompanying detailed table.
DISCLAIMER
This report has been prepared by Scotiabank Economics as a resource for the clients of Scotiabank. Opinions, estimates and projections contained herein are our own as of the date hereof and are subject to change without notice. The information and opinions contained herein have been compiled or arrived at from sources believed reliable but no representation or warranty, express or implied, is made as to their accuracy or completeness. Neither Scotiabank nor any of its officers, directors, partners, employees or affiliates accepts any liability whatsoever for any direct or consequential loss arising from any use of this report or its contents.
These reports are provided to you for informational purposes only. This report is not, and is not constructed as, an offer to sell or solicitation of any offer to buy any financial instrument, nor shall this report be construed as an opinion as to whether you should enter into any swap or trading strategy involving a swap or any other transaction. The information contained in this report is not intended to be, and does not constitute, a recommendation of a swap or trading strategy involving a swap within the meaning of U.S. Commodity Futures Trading Commission Regulation 23.434 and Appendix A thereto. This material is not intended to be individually tailored to your needs or characteristics and should not be viewed as a “call to action” or suggestion that you enter into a swap or trading strategy involving a swap or any other transaction. Scotiabank may engage in transactions in a manner inconsistent with the views discussed this report and may have positions, or be in the process of acquiring or disposing of positions, referred to in this report.
Scotiabank, its affiliates and any of their respective officers, directors and employees may from time to time take positions in currencies, act as managers, co-managers or underwriters of a public offering or act as principals or agents, deal in, own or act as market makers or advisors, brokers or commercial and/or investment bankers in relation to securities or related derivatives. As a result of these actions, Scotiabank may receive remuneration. All Scotiabank products and services are subject to the terms of applicable agreements and local regulations. Officers, directors and employees of Scotiabank and its affiliates may serve as directors of corporations.
Any securities discussed in this report may not be suitable for all investors. Scotiabank recommends that investors independently evaluate any issuer and security discussed in this report, and consult with any advisors they deem necessary prior to making any investment.
This report and all information, opinions and conclusions contained in it are protected by copyright. This information may not be reproduced without the prior express written consent of Scotiabank.
™ Trademark of The Bank of Nova Scotia. Used under license, where applicable.
Scotiabank, together with “Global Banking and Markets”, is a marketing name for the global corporate and investment banking and capital markets businesses of The Bank of Nova Scotia and certain of its affiliates in the countries where they operate, including; Scotiabank Europe plc; Scotiabank (Ireland) Designated Activity Company; Scotiabank Inverlat S.A., Institución de Banca Múltiple, Grupo Financiero Scotiabank Inverlat, Scotia Inverlat Casa de Bolsa, S.A. de C.V., Grupo Financiero Scotiabank Inverlat, Scotia Inverlat Derivados S.A. de C.V. – all members of the Scotiabank group and authorized users of the Scotiabank mark. The Bank of Nova Scotia is incorporated in Canada with limited liability and is authorised and regulated by the Office of the Superintendent of Financial Institutions Canada. The Bank of Nova Scotia is authorized by the UK Prudential Regulation Authority and is subject to regulation by the UK Financial Conduct Authority and limited regulation by the UK Prudential Regulation Authority. Details about the extent of The Bank of Nova Scotia's regulation by the UK Prudential Regulation Authority are available from us on request. Scotiabank Europe plc is authorized by the UK Prudential Regulation Authority and regulated by the UK Financial Conduct Authority and the UK Prudential Regulation Authority.
Scotiabank Inverlat, S.A., Scotia Inverlat Casa de Bolsa, S.A. de C.V, Grupo Financiero Scotiabank Inverlat, and Scotia Inverlat Derivados, S.A. de C.V., are each authorized and regulated by the Mexican financial authorities.
Not all products and services are offered in all jurisdictions. Services described are available in jurisdictions where permitted by law.