- Core inflation increased again…
- ...and is not being driven by base effects…
- ...and there is more persistence than the transitory bias lets on
- Stimulative monetary and fiscal policies…
- ...are driving an inflation tax…
- ...that redistributes workers’ earnings to government coffers
Canadian CPI, m/m / y/y %, August:
Actual: 0.2 / 4.1
Scotia: 0.2/ 4.1
Consensus: 0.1 / 3.9
Prior: 0.6 / 3.7
Canadian core CPI, y/y % change, August:
Average: 2.6 (prior revised to 2.4% from 2.5%)
Weighted median: 2.6 (prior revised to 2.5% from 2.6%)
Common component: 1.8 (prior 1.7%)
Trimmed mean: 3.3 (prior 3.1%)
Canadian core inflation continues to increase and is threatening the upper end of the Bank of Canada’s flexible inflation targeting range. Chart 1 shows the rise in the average of the BoC’s three central tendency measures of core inflation while chart 2 broadens the core metrics to show how they generally reach the same conclusion. Base effects are not to blame and transitory factors are probably being over-emphasized—two points I’ll return to explaining.
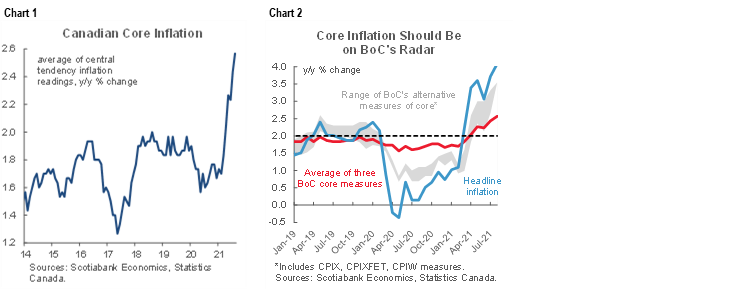
Average core inflation jumped to 2.6% y/y and was up another two tenths from the prior month for the fastest pace of increase since March 2009. That is pushing toward the upper end of the BoC’s 1–3% flexible inflation targeting bands.
As a consequence, the Bank of Canada is falling further behind the curve while the overall Canadian monetary and fiscal policy mix is paying too little attention to price pressures. Unless nascent evidence of wage pressures from Friday’s Labour Force Survey builds further from here, then the result is a rising inflation tax on the earnings of main street workers that is typically regressive. Even if wage pressures keep building, the wage-price connection could sharply test monetary policy into 2022. For now, through seigniorage, the revenue drivers of fiscal positions are benefiting on the backs of Canadian workers albeit with only early evidence of wage pressures. Prime responsibility for managing inflation rests with the Bank of Canada, but that doesn’t mean that the broader public policy mixture doesn’t matter. The continued heavy spending that is the basis of every political party’s platform suggests that Canada is not taking inflation risk very seriously.
BASE EFFECTS AND THE TRANSITORY DEBATE
Why have I persistently argued against the Bank of Canada’s tendency to misrepresent inflationary pressures as simply a function of comparing to year-ago prices? There are two broad reasons.
One reason is shown in chart 3. It shows the month-over-month changes in CPI at a seasonally adjusted and annualized rate that are smoothed by taking a rolling three month moving average to evaluate trends over volatile noise. This measure shows that—with the exception of a brief period around the initial stages of the pandemic—we’ve been getting annualized price gains that are pushing further and further away from the target. Some of this may be transitory and some is reflecting resilience and longer-lived drivers that we can debate. You cannot, however, toss aside this chart as base effect driven since by design it isn’t comparing to prices of a year ago.
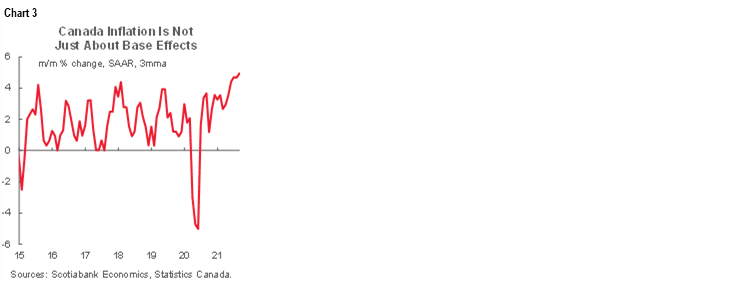
How fast is it rising? Try 5% m/m annualized on average over the most recent three months. Not fair you say because the economy has been reopening during the June–August period? Perhaps, so let’s go further back and ask how many times since the pandemic unfolded that we’ve seen this smoothed measure dip below the BoC’s 2% inflation target. Answer? Five out of eighteen months since we all began aging exponentially after February of last year. We haven’t seen a single month underperform 2% on this measure since last September. It seems to me that we have enough evidence to date that the world has been saved from deflation and disinflation that drove the initial pandemic policy responses to be more aggressively shifting gears and acknowledging the facts on inflation.
A second reason why this kind of core inflation is not base effect driven has to do with the way the BoC’s core inflation measures that were introduced under former Governor Poloz are calculated. They do not take year-over-year spot price comparisons and therefore they are not driven by base effects that speak to where prices were a year ago.
For example, trimmed mean CPI lays out the weighted distribution of month-over-month price changes each month, sorts them from highest to lowest weighted contributions to overall price changes, lops off the top and bottom 20% of the distribution to look at central tendencies and does this for each month. It then compounds each month-over-month weighted and trimmed price change over 12 months to get an annualized rate of price changes.
Weighted median core CPI does the same weighted sorting but takes the price at the 50th percentile of the full distribution without trimming the tails each month and compounds that month-over-month gain over twelve months to get an annualized figure.
Common component core CPI, by contrast, is a factor-driven black box model that looks for common drivers of as much of the basket of price changes as possible and is calculated in year-over-year terms.
Therefore, two out of the three core measures are not driven by base effects, but common component can be. The problem with common component CPI, however, is that while it may ordinarily line-up with output gaps, it assumes spending weights adjust very slowly over time which makes it less relevant at a time like, oh, say a pandemic when the composition of spending shifts around a lot. That’s when slowly adjusting spending weights combined with a year-over-year calculation can make it vulnerable to underestimating inflation if it is putting too much stock in things Canadians used to spend their money on.
The point to this aside is very important to understand and isn’t just a matter of picking a bun fight in the high school cafeteria. While the Bank of Canada has kept saying that inflation is just a base-effect change, we need to acknowledge that this may be true for headline CPI but it is not at all how the BoC’s preferred core measures are calculated. This is why I think the BoC’s bias to date has been unhelpful to inflation watchers, markets and everyday Canadians.
THE DRIVERS
Seasonally adjusted prices were up by 0.4% m/m which is a tad surprising given the 0.2% m/m unadjusted rise. August can be all over the map but is usually a light month for seasonal gains.
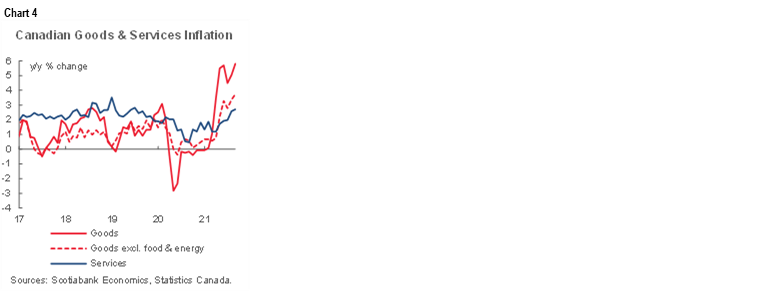
Chart 4 shows that the acceleration of price pressures has been across both goods and services as the latter has been catching up. This point has been previously emphasized in the sense that arguing goods price inflation is transitory ignores that services inflation was depressed on a transitory basis.
Let’s start with the highly weighted components that are not fed just by reopening effects.
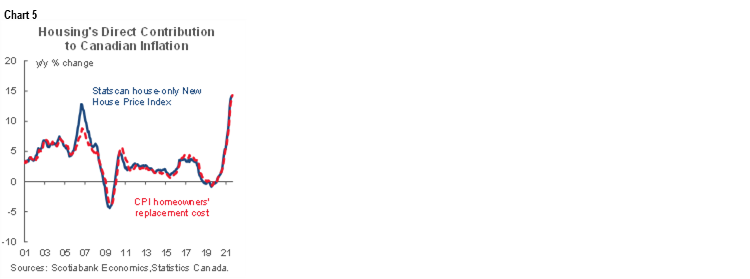
Homeowners' replacement cost is rising at the fastest rate since September 1987. Recall that Canada captures housing differently than the US. In Canada, builder prices (house only, ex-land) drives replacement cost as the main housing component in Canadian CPI (chart 5). This contributor likely faces further upside risk given how tight the Canadian real estate market is. For example, good luck finding resale properties. Numbers out this morning for the month of August showed that there just isn’t any supply with the sales-to-new-listings ratio at 72.4% and still deep into net sellers’ territory while months supply fell to 2.2 months. Incremental housing demand has to leak into expanding the housing stock through new builds which gives builders the pricing power in this environment.
Sticking with housing contributions, rent slipped 0.2% m/m seasonally unadjusted. It’s still likely that we’ll see more pressure on rent going forward in keeping with past periods following sharp deteriorations in housing affordability (chart 6).
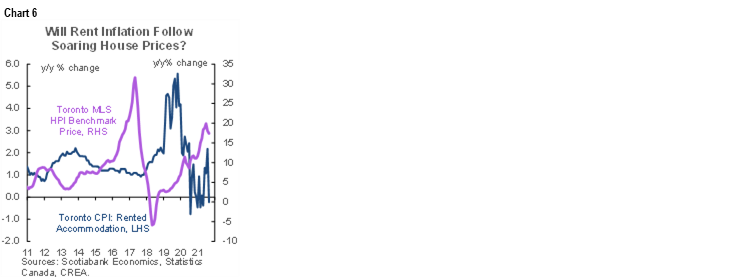
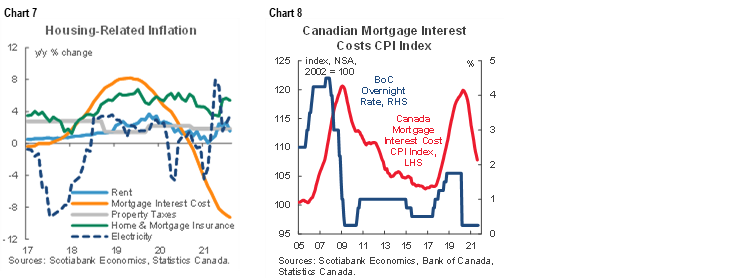
Chart 7 shows other shelter-related drivers. Mortgage interest costs are a transitory source of disinflationary pressure as the rate cuts and lower fixed borrowing costs from earlier in the pandemic continue to push through the mortgage book (chart 8).
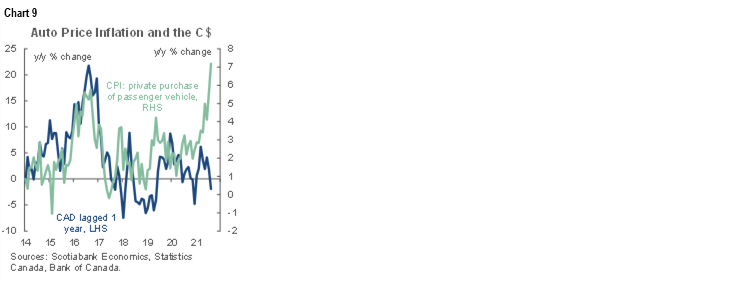
Enough of housing! Those four wheels parked in front of said shelter keeps getting more and more expensive to replace. Auto prices were up another 0.5% m/m last month and are soaring in the year-over-year terms shown in chart 9. This reflects the global supply chain problems that are having a particularly acute effect on the auto sector. Whereas in the past we’ve seen currency movements motivate changes in sticker prices, this time is clearly different. This driver is likely to continue for quite a while yet. Now imagine what Canadian inflation would look like if StatCan didn’t exclude used vehicle prices...
REOPENING EFFECTS
Chart 10 shows the high contact types of activity that contributed to inflation last month as the economy continued to reopen.
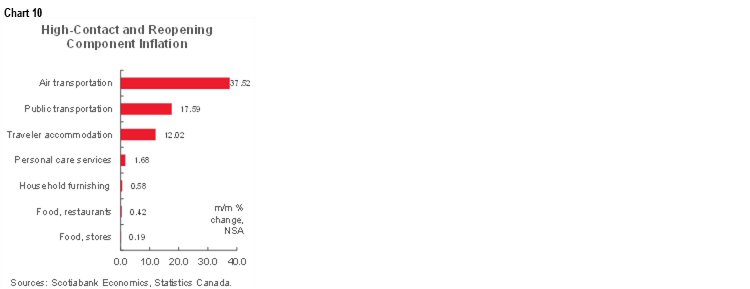
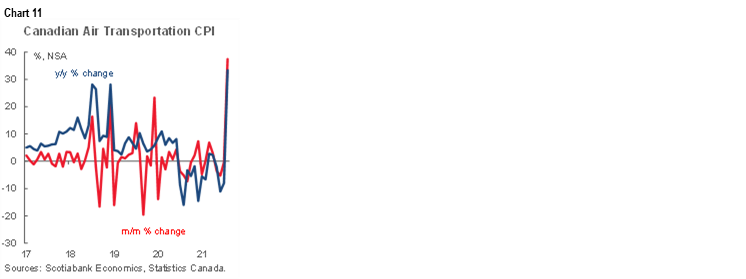
Airfare was up by 37.5% m/m (yes, m/m) and that’s clearly a transitory reopening burst of activity. The minute the borders became open to vaccinated American cross-border travel on August 9th, airlines jacked up fares and built upon the effects of the pick-up in domestic travel (chart 11). Still, this only carries a 0.26% weight in CPI so the explosive gain only contributed 0.1% to m/m inflation and the same 0.1% to the year-over-year headline inflation rate.
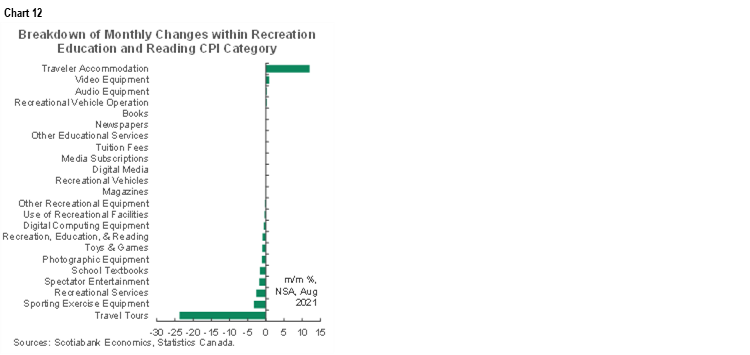
Traveller accommodation accelerated with reopening effects and no noticeable Delta effect unlike the US. Still, the overall recreation, education and reading category that includes traveller accommodation was down 1.1% m/m in August. Chart 12 shows why as accommodation was the only material upside. We might see travel tours and some other categories pick-up from here and so offsetting some of the transitory upsides in the rec/reading/ed category may be transitory downsides.
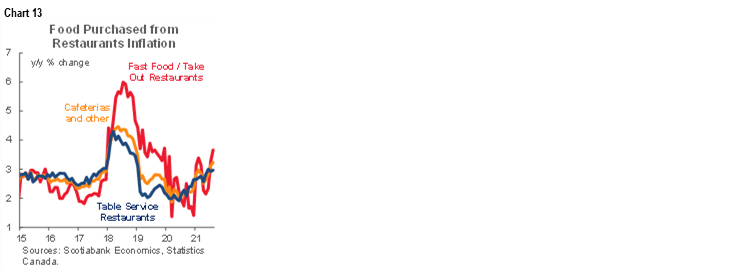
Food prices also contributed including reopening effects upon take-out options (chart 13).
The ‘sins’ including alcohol, tobacco and recreational cannabis were up 0.7% m/m and 2.6% y/y which contributed 0.1% to the year-over-year CPI inflation rate and nothing material to month-ago inflation.
Also note that Statcan advised that special treatments for several categories that were being used since April 2020 to account for things like incomplete markets and missing prices have now ended starting with August 2021 data.
THE BANK OF CANADA—TIME TO PIVOT
While the September statement from the Bank of Canada tempered the message somewhat, I still find the BoC has spent far too much time dismissing inflation as base effect driven and transitory after having drastically underestimated inflation in its forecasts over the past year despite knowing the base effect starting points.
So what do you do now if you’re Governor Macklem? The BoC can still say they are approaching this with a flexible target, but the move toward the upper end of that on a core basis should be motivating faster exits as inflation risk has evolved in a very different way than they anticipated. The BoC is still 150bps–250bps below their estimate of a neutral policy rate and still buying truckloads of bonds. Instead of adopting an idiosyncratic approach to the inflation drivers that evaluates conditions by sectors, it relies upon malleable output gaps that say inflation shouldn’t be happening. Well, it is and there is a credibility issue to fix here. Amid ongoing uncertainties including pandemic risks to the job market, it’s not as if policy would suddenly become tight by acknowledging that stimulus overshot over the past year and a half and transitioning more rapidly toward exits.
I think the BoC should shut down its bond purchase program at the October meeting. It may instead spread that out in two decisions as per ‘gradual and measured’ guidance. What will continue to dominate tapering will be fundamentals, not technical market factors like relative rates or net supply considerations. The BoC has repeatedly emphasized throughout tapering that the goal post of getting to hikes when the output gap shuts and working backwards from that in tapering, ending net purchases and then reinvesting for a time is dominating his thinking. The BoC has repeatedly resisted any tendency to hold off tapering on technical and supply factors. In fact, you could say that the entire point of tapering to net zero is precisely to thrust more incremental supply of bonds onto private balance sheets and thereby lessening incremental stimulus to the Canadian economy.
WANT SOME MORE?
Chart 14 shows the year-over-year changes in the CPI basket by component and chart 15 does likewise in terms of weighted contributions to the year-over-year inflation rate. Charts 16 and 17 do the same things in month-over-month terms.
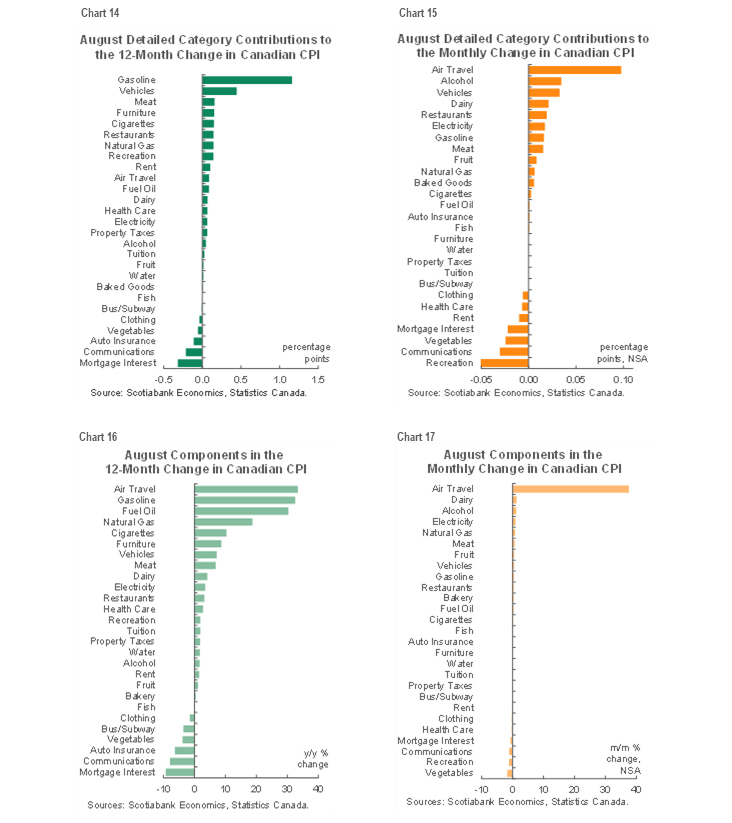
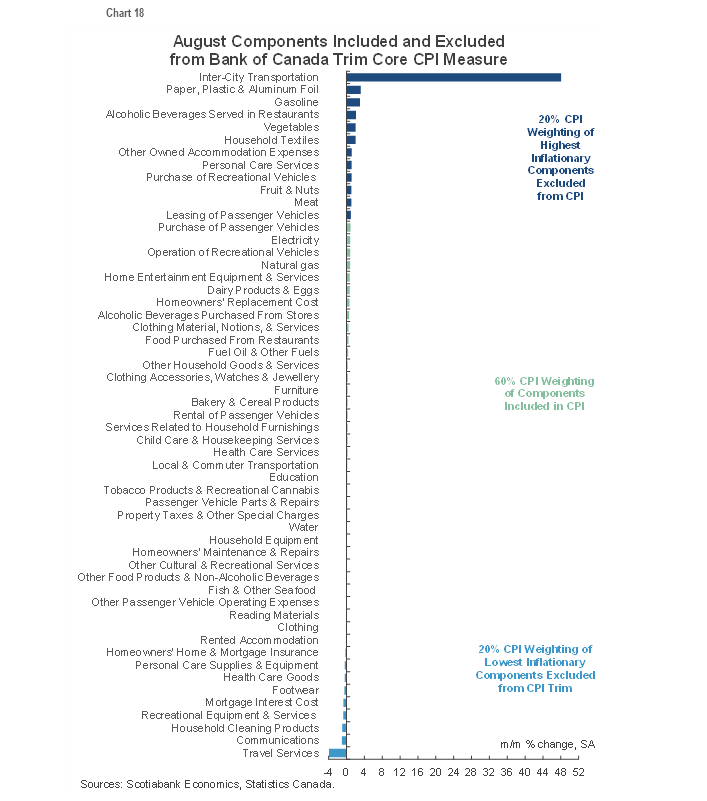
Chart 18 illustrates only what was included in August within the trimmed mean CPI measure that compounds each month’s weighted price changes over the past year. It is included to demonstrate that the biggest upside drivers were excluded from the calculations so as not to distort trimmed mean CPI by this reopening effect.
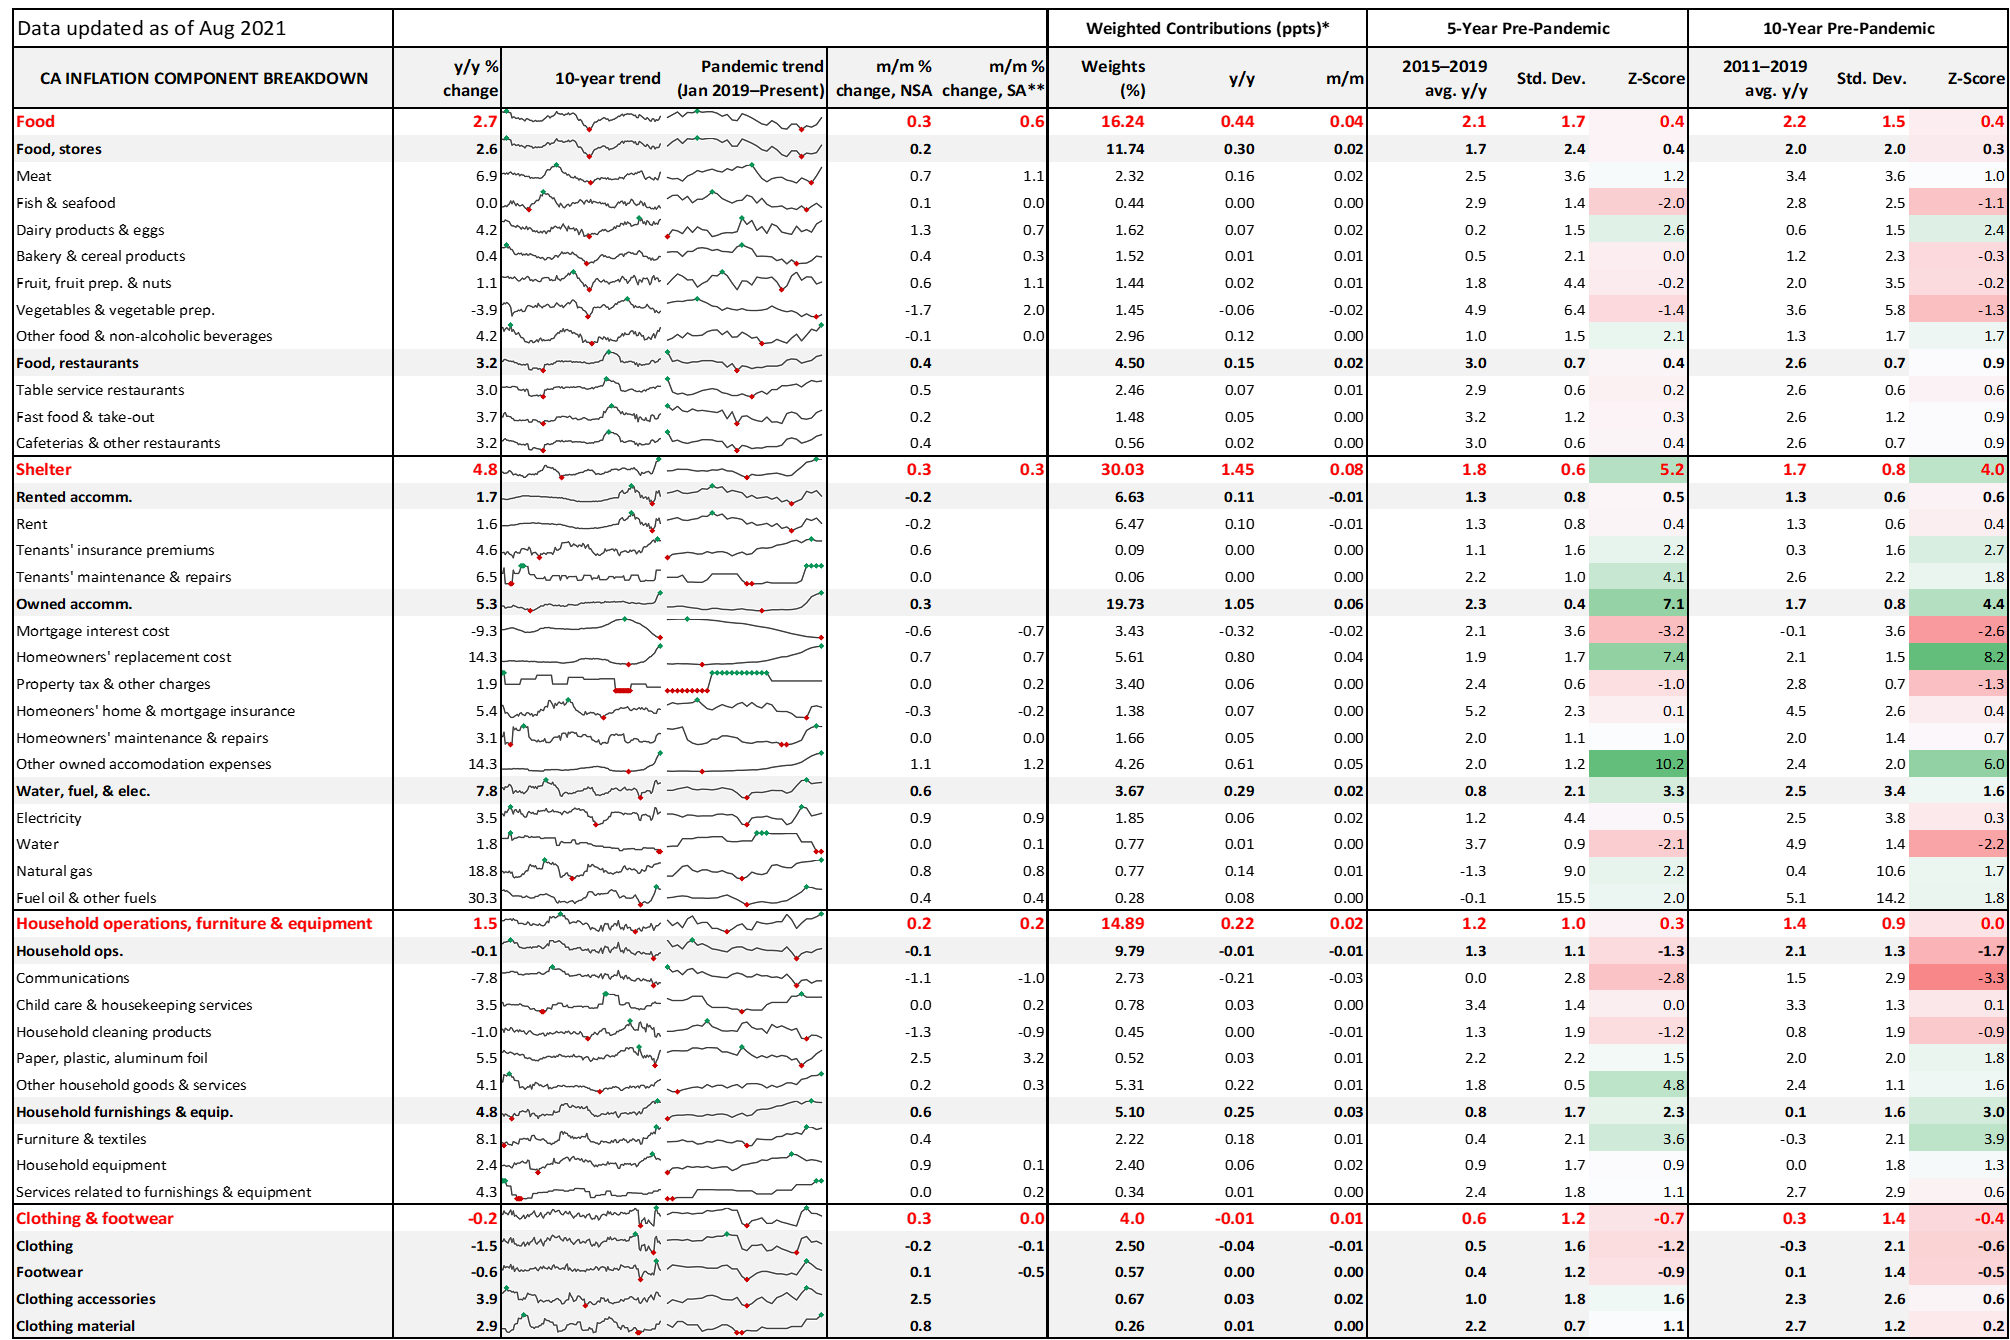
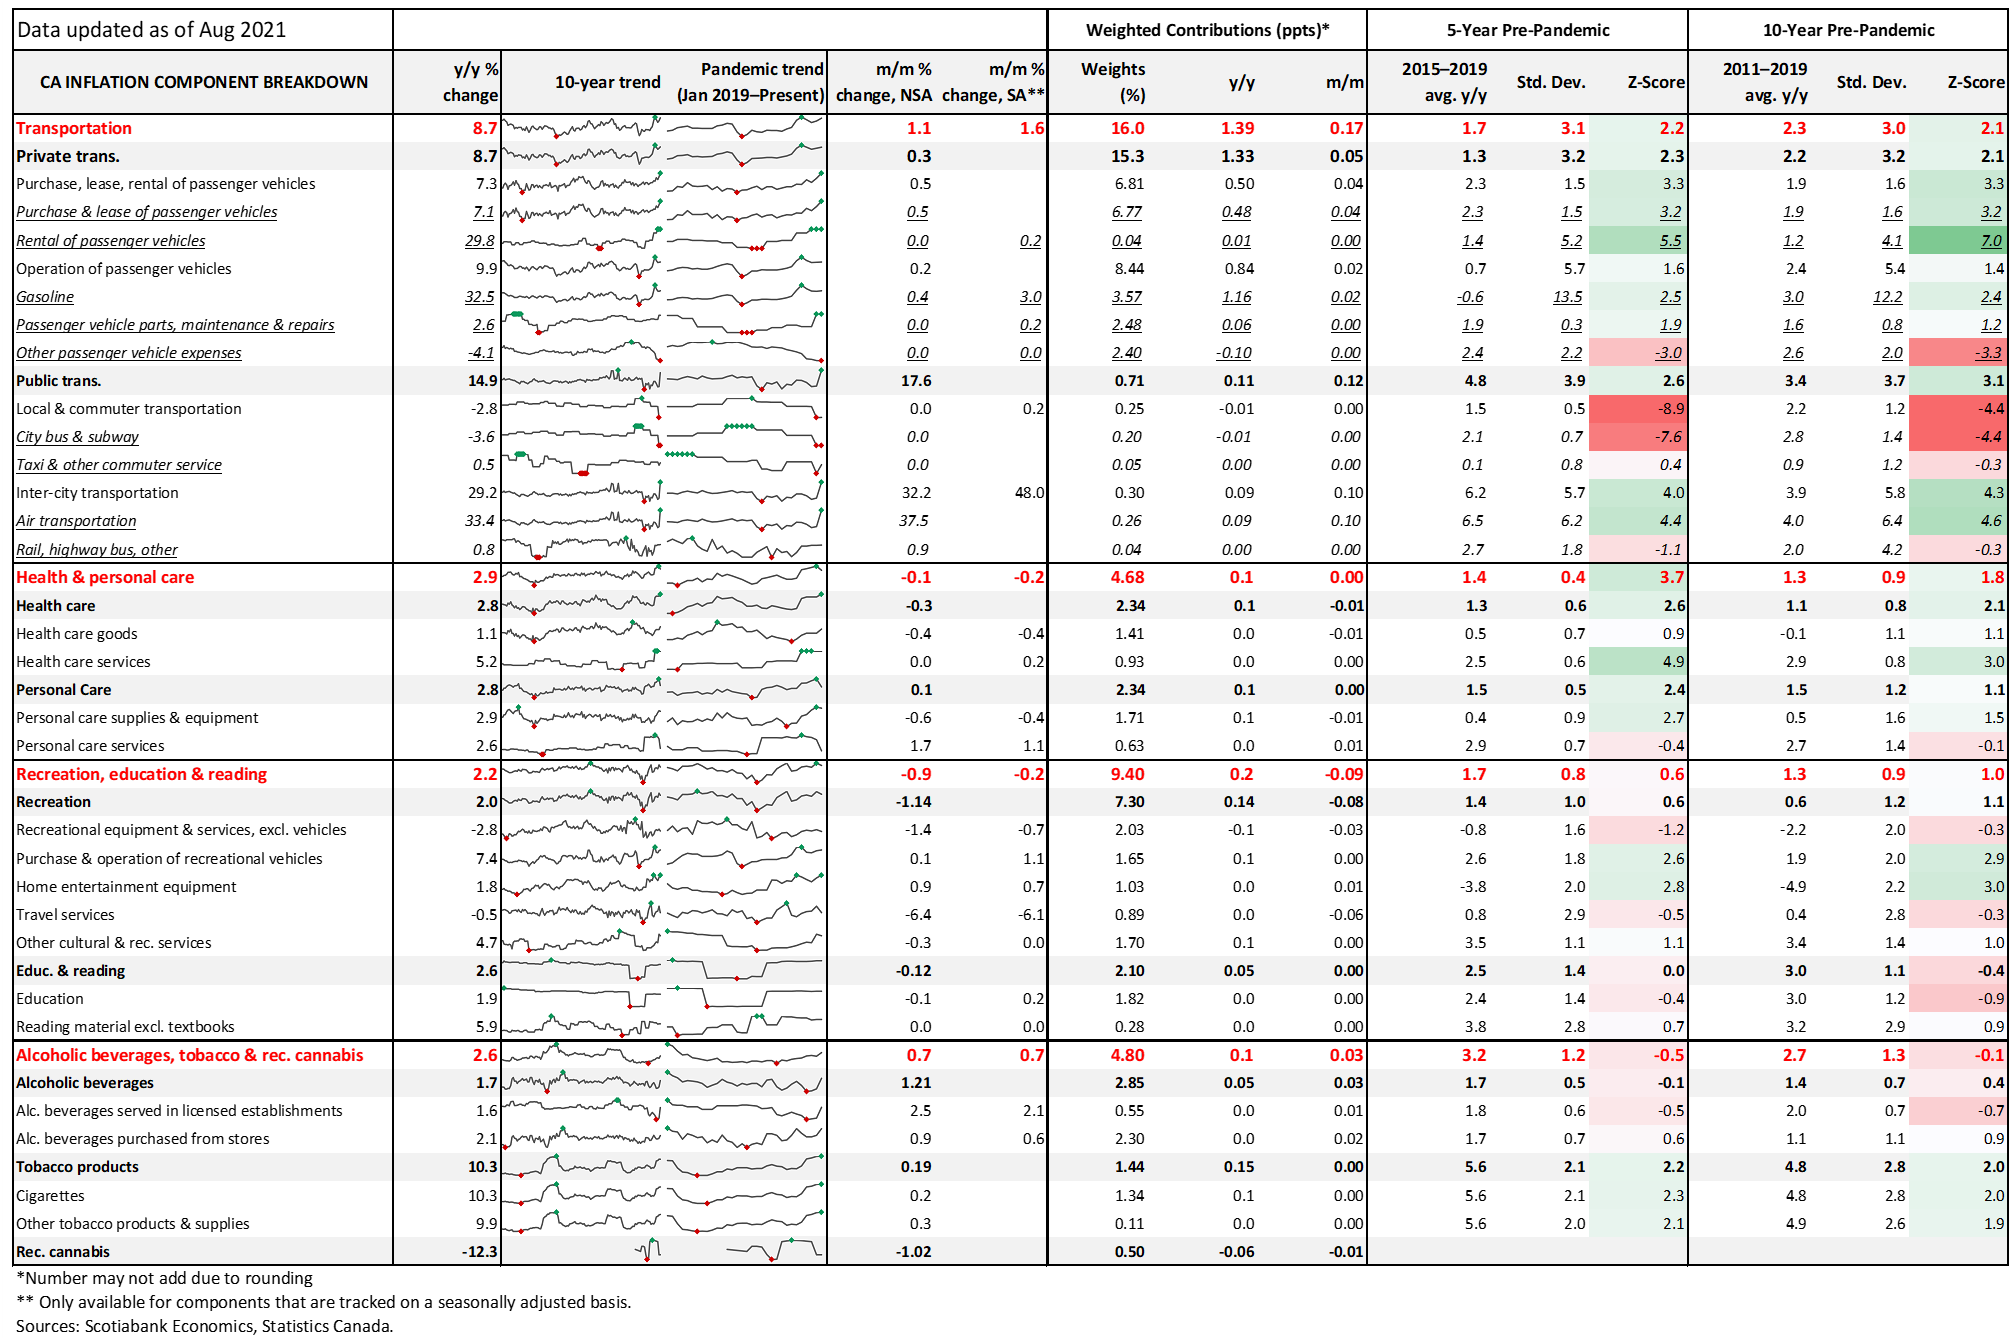
Please also see the appendix to this report that breaks down the basket into month-ago and year-ago price changes with micro-charts and Z-scores with thanks to Marc Ercolao’s good work on this. Z-scores seek to portray by how much current inflation readings by category are deviating from historical averages by taking current rates minus the historical average divided by standard deviations.
DISCLAIMER
This report has been prepared by Scotiabank Economics as a resource for the clients of Scotiabank. Opinions, estimates and projections contained herein are our own as of the date hereof and are subject to change without notice. The information and opinions contained herein have been compiled or arrived at from sources believed reliable but no representation or warranty, express or implied, is made as to their accuracy or completeness. Neither Scotiabank nor any of its officers, directors, partners, employees or affiliates accepts any liability whatsoever for any direct or consequential loss arising from any use of this report or its contents.
These reports are provided to you for informational purposes only. This report is not, and is not constructed as, an offer to sell or solicitation of any offer to buy any financial instrument, nor shall this report be construed as an opinion as to whether you should enter into any swap or trading strategy involving a swap or any other transaction. The information contained in this report is not intended to be, and does not constitute, a recommendation of a swap or trading strategy involving a swap within the meaning of U.S. Commodity Futures Trading Commission Regulation 23.434 and Appendix A thereto. This material is not intended to be individually tailored to your needs or characteristics and should not be viewed as a “call to action” or suggestion that you enter into a swap or trading strategy involving a swap or any other transaction. Scotiabank may engage in transactions in a manner inconsistent with the views discussed this report and may have positions, or be in the process of acquiring or disposing of positions, referred to in this report.
Scotiabank, its affiliates and any of their respective officers, directors and employees may from time to time take positions in currencies, act as managers, co-managers or underwriters of a public offering or act as principals or agents, deal in, own or act as market makers or advisors, brokers or commercial and/or investment bankers in relation to securities or related derivatives. As a result of these actions, Scotiabank may receive remuneration. All Scotiabank products and services are subject to the terms of applicable agreements and local regulations. Officers, directors and employees of Scotiabank and its affiliates may serve as directors of corporations.
Any securities discussed in this report may not be suitable for all investors. Scotiabank recommends that investors independently evaluate any issuer and security discussed in this report, and consult with any advisors they deem necessary prior to making any investment.
This report and all information, opinions and conclusions contained in it are protected by copyright. This information may not be reproduced without the prior express written consent of Scotiabank.
™ Trademark of The Bank of Nova Scotia. Used under license, where applicable.
Scotiabank, together with “Global Banking and Markets”, is a marketing name for the global corporate and investment banking and capital markets businesses of The Bank of Nova Scotia and certain of its affiliates in the countries where they operate, including; Scotiabank Europe plc; Scotiabank (Ireland) Designated Activity Company; Scotiabank Inverlat S.A., Institución de Banca Múltiple, Grupo Financiero Scotiabank Inverlat, Scotia Inverlat Casa de Bolsa, S.A. de C.V., Grupo Financiero Scotiabank Inverlat, Scotia Inverlat Derivados S.A. de C.V. – all members of the Scotiabank group and authorized users of the Scotiabank mark. The Bank of Nova Scotia is incorporated in Canada with limited liability and is authorised and regulated by the Office of the Superintendent of Financial Institutions Canada. The Bank of Nova Scotia is authorized by the UK Prudential Regulation Authority and is subject to regulation by the UK Financial Conduct Authority and limited regulation by the UK Prudential Regulation Authority. Details about the extent of The Bank of Nova Scotia's regulation by the UK Prudential Regulation Authority are available from us on request. Scotiabank Europe plc is authorized by the UK Prudential Regulation Authority and regulated by the UK Financial Conduct Authority and the UK Prudential Regulation Authority.
Scotiabank Inverlat, S.A., Scotia Inverlat Casa de Bolsa, S.A. de C.V, Grupo Financiero Scotiabank Inverlat, and Scotia Inverlat Derivados, S.A. de C.V., are each authorized and regulated by the Mexican financial authorities.
Not all products and services are offered in all jurisdictions. Services described are available in jurisdictions where permitted by law.