- Job growth was strong and supported by positive details
- Labour slack is rapidly disappearing
- Wage gains are returning
- Hours worked say one thing, GDP another
- Canada’s unemployment and underemployment rates are very close to the US
- The policy mixture is increasingly looking too easy
CDN Jobs, m/m 000s // UR %, August, SA:
Actual: 90.2 / 7.1
Scotia: 50 / 7.3
Consensus: 68.2 / 7.3
Prior: 94 / 7.5
Job growth exceeded expectations and the underlying details were solid. See the accompanying summary table for highlights.
(ALMOST) FULL EMPLOYMENT
Job growth beat expectations and the underlying details were solid. Technically, after taking account of noise in the household survey, we can say that at a 95% level of confidence job growth was between roughly 30k–150k last month. Still, I’ll take it, as the grander point is that unlike the US that saw a deterioration in job growth during August, Canada’s gain in August matched the prior month’s gain in part because the latest COVID-19 wave is much less severe in Canada than in the US and particularly the US South.
That means slack in Canada’s job market is shutting faster than the Bank of Canada has been anticipating and at a minimum that keeps them on track to gradually exit exceptionally stimulative monetary policy while the fiscal policy bias continues to plow ahead.
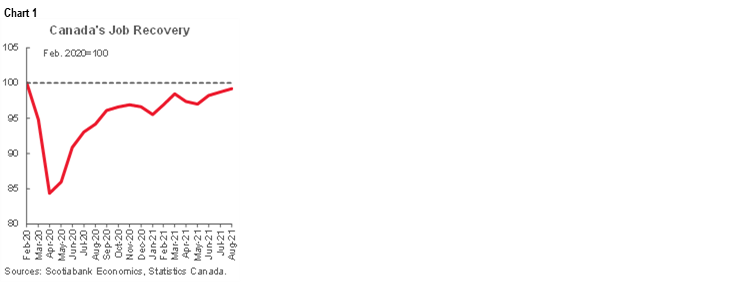
With a gain of about 90,000 jobs, Canada is now just 156k below where employment sat in February 2020 (chart 1). At this rate Canada might recapture all lost jobs in another 2–3 months.
While services are supposed to be the worst affected by the pandemic, they are only down 14k cumulatively on jobs. See chart 2 for the sector breakdown of cumulative jobs lost and gained to date by sector during the pandemic. Goods are down 142k due to construction (-62k) and manufacturing (-37k).

There are multiple other measures that point toward rapidly regaining full employment conditions:
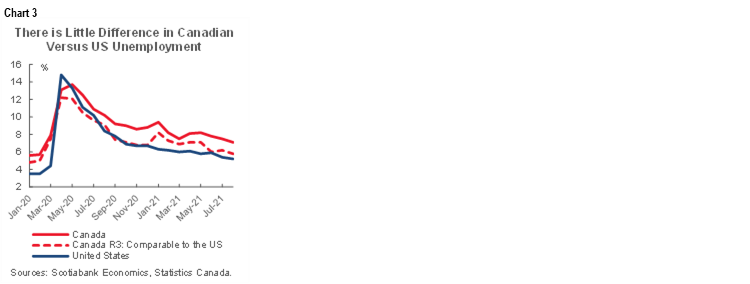
- The unemployment rate fell to 7.1% and is now 1.4% higher than pre-pandemic but half the pandemic peak. When comparing the US to Canada given Fed-BoC expectations, always bear in mind that there are measurement differences in how the two countries estimate unemployment. Chart 3 shows that when measured through identical approaches, Canada’s 7.1% official rate falls to 5.8% which lies within spitting distance of the US unemployment rate of 5.2%. Then consider that most economists believe that Canada’s structural unemployment rate is higher than the US and so Canada is likely much closer to a level of the unemployment rate that signifies full employment than the US is.
- The labour force participation rate sits at 65.1% and is only 0.4% below the pre-pandemic level (chart 4).

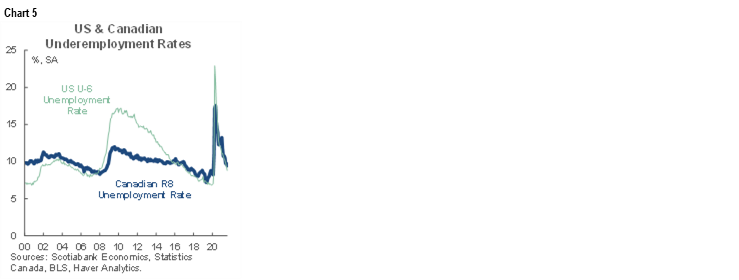
- The underemployment rate considers not just the unemployed but also the underemployed and discouraged workers. That rate now sits at 9.4% which is still above the 8.2% rate back in February 2020 but is about half of where it stood at its peak in May 2020. The rate isn’t much higher than it was for many years prior to that point. Further, Canada’s R8 measure of underemployment is only 0.6 points above the US U6 measure of underemployment (chart 5).
- All that said, we need to look at where the underperformance still resides. Several service sectors are still down, but if employment at hotels/motels/bars/restaurants is removed by excluding the accommodation and food services category that has been hardest hit by the pandemic, then Canada has already regained all the lost jobs due to the pandemic as lost jobs in other services have rotated toward job gains or mild losses elsewhere.
- StatCan notes that the number of employees who worked less than half of their usual hours is almost back to where it was in February 2020 toward a more normal run-rate.
- The agency also noted that mobility in search of better pay and better jobs has also picked up. The number of job leavers increased to 275k last month which was up by about 7% m/m and up from the low of 217k back in April. In fact, the job changing rate has fully rebounded to pre-pandemic levels and slightly then some.
- Disappearing slack is also true in terms of several inclusive yardsticks. Jobs for women 25+ are still down the most (-76k) but not by much with men 25+ down 39k and youths down 41k. Given it’s a household survey with significant margin of error we can’t definitively say that any of these segments must be in a worse position than the others judged solely on the basis of the blunt measure of total employment. Other measures would supplement this perspective of course and not least of which responsibilities for childcare.
Now tell me, how many other times in history did we have a 0% policy rate while buying truckloads of bonds despite being down only 156k jobs and with inflation running at 3.7% y/y and core measures averaging over target? Oh, and all the while talking as if little of it is happening and little of it was forecast in advance while having to provide ongoing stimulus? Never as far as I can recall. There are risks, but to me the larger risk is the human tendency to stay wedded to what was put in place while filtering out new information that challenges the ongoing need for it all.
RISING WAGE PRESSURES
So there is less and less—almost non-existent—slack with rising evidence of mobility in search of better pay and jobs. The natural temptation is to turn the attention to wages.
First, always bear in mind that wage growth is a lagging indicator. That’s important because if we’re seeing signs of wage pressures at a nascent stage for full employment then it could mean greater pressures lie ahead. That’s one reason I don’t like the BoC’s emphasis upon simply tracking wage growth to date across a suite of measures and basing forward looking policy on this lagging measure.
Nevertheless, check out the current evidence! Average wages of all employees were up 9.1% m/m at a seasonally adjusted and annualized pace in August over July after the prior month’s gain of 6.3%. The BoC's old preferred wage measure (for permanent employees instead of the total) was up 8.3% m/m SAAR after a prior 6.1%. You noticed right?? Perhaps only if you moved around as a typical cycle unfolds with many employers seemingly preferring to lose top employees and go through retraining and integration costs rather than being proactive on wages.
Now there are caveats around these estimates, but the general point stands that wage pressures are building. One caveat is that this isn't the BoC's preferred wage measure, but their preferred wage common composite yardstick that mashes four measures together is too lagging to be useful as a measure of faster moving developments at the margin.
Another caveat is obviously that annualizing monthly gains assumes they’ll hold at that kind of pace over a full year, but it’s a useful way of vividly pointing out the pace of pressures at the margin especially for a lagging indicator like wage growth.
Another caveat is that this measure doesn’t control for compositional shifts in employment, but on that I’m less inclined to do so than some others might be and it’s unclear it matters a whole lot anyway. The BoC will likely put more emphasis upon the measure of wages using fixed weights that control for compositional shifts in the labour force. StatCan says that measure is up 5.2% now compared to the 2019 average in order to smooth through the pandemic, versus 7.1% cumulative growth in wages without holding composition unchanged. The average fixed-weight wage measure has regained the pre-pandemic level and a little beyond and due to gains since late last year with probably more ahead.
Then there is the debate over whether to hold composition unchanged in any event. The fixed weight measures do so by occupation and job tenure. I'm less convinced of the merits to doing so since it basically says if you switch jobs to a better paying opportunity in a different sector or if those with more/less tenure are getting more/lower gains than others then we don't want to include that. Didn’t see it, don’t want to, never mind, messes up a good narrative. Meh. I disagree. Pay is pay in terms of aggregate measures that drive consumption, prices etc. Monetary policy should focus upon aggregate measures and stick to its knitting absent any ability (or need) to control for compositional matters.
The bottom line? Wage pressures are at a nascent stage of the recovery in tightening labour markets and businesses would do well to build into their plans and projections what it takes to keep their top performers and expect greater wage pressures going forward.
THE STIMULUS DEBATE
With tightening job markets and building wage pressures the next step is to consider policy. I won’t stray too far into the politics during an election but to market observers pricing inflation and curve risk it’s important to note that lost is the opportunity to have a balanced debate on the mixture of monetary and fiscal policy stimulus at present and going forward. That probably means erring on the side of caution in terms of expecting more persistent wage and price pressures.
On fiscal policy, all parties sound the same on the matter as far as I can hear and see. The incumbent Liberal minority government with NDP support can claim that their policies have contributed to this employment recovery and with considerable legitimacy, of course alongside (in my opinion) the very large complementary role played by science and vaccines plus imported stimulus effects from the world’s most influential central banks and US fiscal stimulus and a natural easing in market conditions. No one, however, is speaking toward the need to rein it in. Why? The electorate may be to blame for this despite noticing price increases and complaining about them, but absent much pressure on the parties to shift gears out of recession policies. That likely means no one is speaking out against the nasty inflation tax that is among the most regressive policies any government can pursue. With a centrist/left electorate in a populist era it may be self ruinous to advance a platform that calls for pulling back on the horns.
As for the Bank of Canada, I think they should shut down bond purchases in October instead of the ongoing C$2B/week pace but can see them taking two putts two feet from the hole to do it. That'd stink at golf (and I am definitely not one to talk….), but it would meet the 'gradual and measured' guidance toward ending purchases by year-end. Is there need for monetary stimulus in the face of uncertainties? Yes. Emergency stimulus? I think that point passed long ago.
As for the policy mix, I don't think hanging around 0% and buying truckloads of bonds while heaping on more fiscal stimulus is a suitable solution to addressing lost jobs particularly in one sector. It would perhaps be less distorting to the overall economy to simply pay off and/or retrain these unfortunate workers who may not have sustainable employment within their sectors for some time to come and get on with addressing the bigger picture of inflation & wage pressures in a more balanced sense of the risks.
GDP VERSUS JOB MARKETS
Hours worked are tracking a gain of 5.2% q/q SAAR in Q3 assuming a flat September (chart 6). The massive 1.3% m/m rise in July was retained with a 0.1% m/m bump in August. I’m mildly surprised we didn't dip in August on the heels of such a big prior increase.

The sharp gain being tracked for hours worked in Q3 adds to the debate over what’s going on with the GDP figures. Since GDP is an identity equated to hours worked times labour productivity (the latter defined as output per hour worked) why are we tracking such a weak Q3 for growth? At present using Q2 GDP and July's 'flash' contraction from Statistics Canada (with a large amount of salt…), GDP is tracking a slight dip into Q3 over Q2 assuming nothing for August and September. Even if we got ½% m/m gains in each of August and September the monthly GDP figures would point to only about 1½% annualized q/q GDP growth. Yet hours are up over 5% so far over Q2.
Something's off here. There are only three ways of squaring it all. One is that hours worked may be inaccurate, though revisions are usually unlikely. Another is that perhaps productivity really tanked in Q3 which would mean a pretty substantial drop in output per hour worked. A third possibility is that, ahem, perhaps another GDP revision lies ahead! However it gets settled, the typically tight connection between jobs and GDP growth you learned about in Econ 101 via Okun’s ‘law’ suggests such a deviation between racking up hours at work and output growth is unlikely to persist. Our bet is that this gets settled through a solid rebound in GDP growth.
DETAILS, DETAILS!
The rest of the details were solid.
The unemployment rate fell by more than expected to 7.1% last month. What drove it was partly the gain in jobs but also the fact that the labour force was flat again. After a significant jump in the size of the labour force in June due to reopening effects, there hasn’t been any material growth over the past two months.
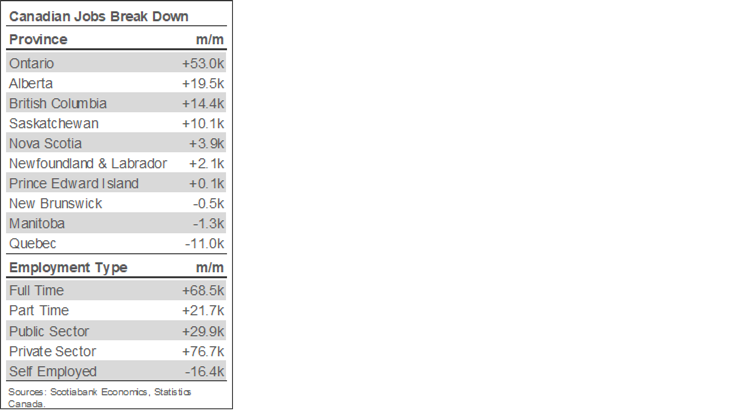
Almost all of the job gain was in full-time positions that were up 68.5k with part-time jobs up 21.7k.
Three-quarters of the gain in jobs occurred on private sector payrolls (77k) with public sector payrolls up 30k. Off-payroll self-employed jobs fell by 16k likely as they were pulled back onto payrolls; in fact, self-employed jobs are down by almost 80k over the past three months.
By sector (chart 7), services were up 93k and jobs in the goods sector were flat (-2.6k). With goods, construction jobs were up 20k while there were small declines in manufacturing, agriculture and resources.

Within services there was decent breadth to the gain. Accommodation and food was up 75k, info/culture/rec was up 24k, education gained 11k spots, the professional employees category (docs/lawyers/scientists etc) was up 15k, wholesale/retail jobs increased by 17k. Downsides were in 'other' services, business support and the finance, insurance and real estate sector.
DISCLAIMER
This report has been prepared by Scotiabank Economics as a resource for the clients of Scotiabank. Opinions, estimates and projections contained herein are our own as of the date hereof and are subject to change without notice. The information and opinions contained herein have been compiled or arrived at from sources believed reliable but no representation or warranty, express or implied, is made as to their accuracy or completeness. Neither Scotiabank nor any of its officers, directors, partners, employees or affiliates accepts any liability whatsoever for any direct or consequential loss arising from any use of this report or its contents.
These reports are provided to you for informational purposes only. This report is not, and is not constructed as, an offer to sell or solicitation of any offer to buy any financial instrument, nor shall this report be construed as an opinion as to whether you should enter into any swap or trading strategy involving a swap or any other transaction. The information contained in this report is not intended to be, and does not constitute, a recommendation of a swap or trading strategy involving a swap within the meaning of U.S. Commodity Futures Trading Commission Regulation 23.434 and Appendix A thereto. This material is not intended to be individually tailored to your needs or characteristics and should not be viewed as a “call to action” or suggestion that you enter into a swap or trading strategy involving a swap or any other transaction. Scotiabank may engage in transactions in a manner inconsistent with the views discussed this report and may have positions, or be in the process of acquiring or disposing of positions, referred to in this report.
Scotiabank, its affiliates and any of their respective officers, directors and employees may from time to time take positions in currencies, act as managers, co-managers or underwriters of a public offering or act as principals or agents, deal in, own or act as market makers or advisors, brokers or commercial and/or investment bankers in relation to securities or related derivatives. As a result of these actions, Scotiabank may receive remuneration. All Scotiabank products and services are subject to the terms of applicable agreements and local regulations. Officers, directors and employees of Scotiabank and its affiliates may serve as directors of corporations.
Any securities discussed in this report may not be suitable for all investors. Scotiabank recommends that investors independently evaluate any issuer and security discussed in this report, and consult with any advisors they deem necessary prior to making any investment.
This report and all information, opinions and conclusions contained in it are protected by copyright. This information may not be reproduced without the prior express written consent of Scotiabank.
™ Trademark of The Bank of Nova Scotia. Used under license, where applicable.
Scotiabank, together with “Global Banking and Markets”, is a marketing name for the global corporate and investment banking and capital markets businesses of The Bank of Nova Scotia and certain of its affiliates in the countries where they operate, including; Scotiabank Europe plc; Scotiabank (Ireland) Designated Activity Company; Scotiabank Inverlat S.A., Institución de Banca Múltiple, Grupo Financiero Scotiabank Inverlat, Scotia Inverlat Casa de Bolsa, S.A. de C.V., Grupo Financiero Scotiabank Inverlat, Scotia Inverlat Derivados S.A. de C.V. – all members of the Scotiabank group and authorized users of the Scotiabank mark. The Bank of Nova Scotia is incorporated in Canada with limited liability and is authorised and regulated by the Office of the Superintendent of Financial Institutions Canada. The Bank of Nova Scotia is authorized by the UK Prudential Regulation Authority and is subject to regulation by the UK Financial Conduct Authority and limited regulation by the UK Prudential Regulation Authority. Details about the extent of The Bank of Nova Scotia's regulation by the UK Prudential Regulation Authority are available from us on request. Scotiabank Europe plc is authorized by the UK Prudential Regulation Authority and regulated by the UK Financial Conduct Authority and the UK Prudential Regulation Authority.
Scotiabank Inverlat, S.A., Scotia Inverlat Casa de Bolsa, S.A. de C.V, Grupo Financiero Scotiabank Inverlat, and Scotia Inverlat Derivados, S.A. de C.V., are each authorized and regulated by the Mexican financial authorities.
Not all products and services are offered in all jurisdictions. Services described are available in jurisdictions where permitted by law.