- Canada’s economy put in a weak performance...
- ...principally due to transitory shocks...
- ...as Statcan fingered widespread wildfire effects on multiple sectorsThe shocks went beyond wildfires...
- ...and as they ease, growth should rebound
- The BoC will probably pause next week...
- ...but leave the door open to returning...
- ...as they look through much of the weakness and seek to control market
- Canada GDP m/m % change, SA, June:
- Actual: -0.2
- Scotia: -0.1
- Consensus –0.2:
- Prior: 0.2 (revised down from 0.3%)
- July ‘flash’ guidance: “essentially unchanged”
- Canada GDP q/q % change, SAAR, Q2:
- Actual: -0.2
- Scotia: 1.0
- Consensus: 1.2
- Prior: 2.6 (revised down from 3.1%).
Canada’s latest GDP figures literally read like the sequel to a bad Cheech and Chong movie from the 70s. The common narrative is that they provide evidence that Canada’s economy has finally buckled under the weight of rate hikes. That’s thin veneer headline commentary in my view. The underlying details point to something that is considerably more robust when controlling for various distortions like the very widespread impact of wildfires, strikes and probably weather as well. I’ll go over the implications for the BoC, then the numbers, then how the distortions have impacted them.
BoC TO SIT THIS ONE OUT
The Bank of Canada has the cover in the GDP data to stay on pause with a hawkish bias on Wednesday. That’s because growth came in materially weaker than they had forecast. Ditto for Scotia Economics’ last forecast in July (1.7% Q2), my updated guesstimate into today’s figures (1%) and the consensus forecast of 1.2%.
It’s also because the BoC is likely to lean in favour of going through a full forecast process into the October MPR and evaluate further incoming data between now and then and beyond. They will want to delve deeply into the figures and drivers in order to develop an updated view on how much of the softness may be transitory. I think a lot of it is, but I’d like to see what their army of economists and policymakers think. For now, the BoC must leave the door open to returning with future tightening on the statement bias for three reasons.
- One is that I think this set of numbers has transitory written all over it and we’ll probably see signs of a firm rebound into year-end as a multitude of shocks wears off.
- Two is that the BoC needs to manage markets and keep at bay itchy trigger fingers that are inclined to pounce on rate cut pricing prematurely. The usual line here is that history cautions strongly against prematurely declaring victory over inflation and particularly in today’s world of widespread structural changes.
- Three is that the BoC has been clear that it is focused upon the multiple influences upon core inflation, inflation expectations, wages, productivity and corporate pricing behaviour. Governor Macklem has also said he needs to see demand growth slow and today’s numbers are a step in that direction, but not if we just wind up rebounding from temporary drag effects.
Q2 GROWTH DISAPPOINTED
The whole first half performance of the Canadian economy disappointed expectations. Q1 growth was revised down a half percentage point and Q2 GDP was little changed at –0.2% q/q SAAR. That’s weaker than the BoC had been assuming by taking Q1 at face value and forecasting 1½% Q2 growth.
Chart 1 shows the key drivers. Inventories knocked 0.85 percentage points off of Q2 growth through lessened investment. Imports subtracted 0.64 percentage points off of Q2 growth. The combined drag from inventories and imports knocked about 1¼ percentage points off of Q2 growth.
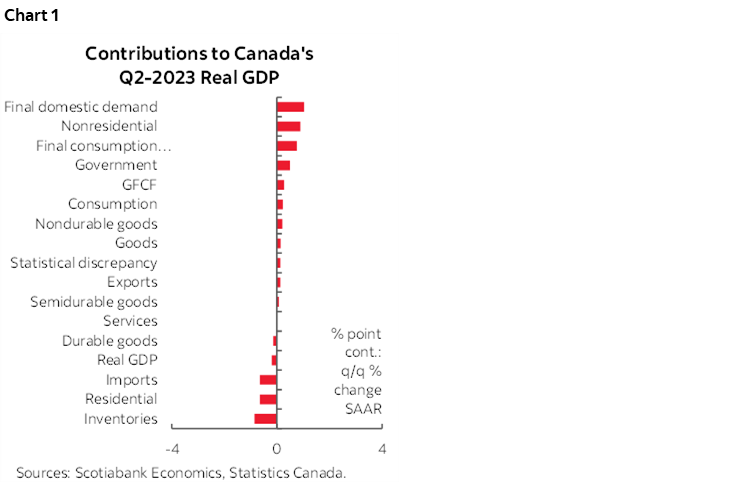
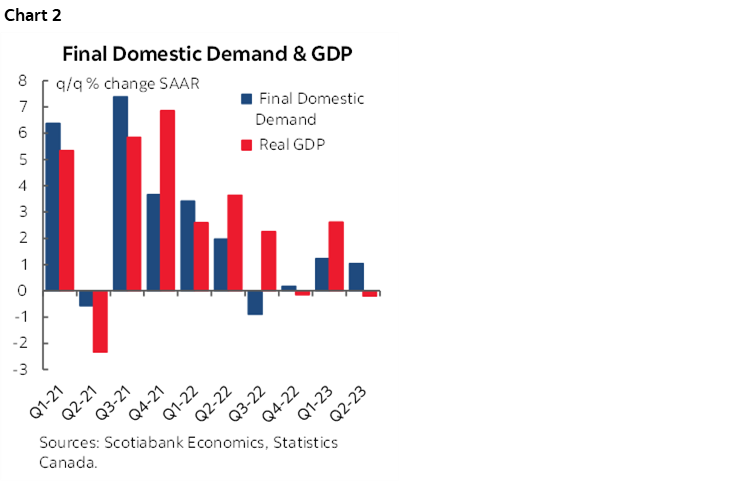
One way of controlling for this is to look at Final Domestic Demand that adds up consumption, investment and government spending and hence excludes net trade and inventory effects (chart 2). It was up by 1% q/q SAAR in Q2 which is close to the 1.2% reading in Q1.
Therefore, the economy was not as bad as the headline GDP indicated, but it wasn’t great either. Consumption contributed just 0.1 percentage points to q/q annualized GDP growth. Investment added 0.3 ppts to growth as housing investment dragged 0.65 ppts off GDP and this was offset by a 0.9ppt contribution from business investment. Business investment’s contribution to GDP growth saw a 0.55 ppt contribution from nonresidential structures and a 0.3 contribution from equipment investment. Government spending added 0.5 ppts to growth and government investment was a flat contributor. Exports added just 0.1 ppts.
Q1 REVISED DOWN
Q1 GDP growth was revised down from 3.1% q/q SAAR to 2.6% now. The main driver of the negative revision was the consumer. Instead of being up 3.2% q/q SAAR in Q1 it now shows a rise of 2.7% which is still very solid. Housing investment was also revised lower to –1.7% q/q SAAR from –1.3%. Inventories are now showing as less of a drag at –1.6 ppts instead of –2.4. Trade figures were left untouched as exports still contributed 3.3 ppts to Q1 growth and imports 0.3. The result is that final domestic demand went from contributing a weighted 2.7 ppts to GDP growth to now contributing 1.2 ppts.
MONTHLY GDP WAS SOFT
June GDP fell by 0.2% m/m and July’s preliminary flash guidance pointed to being “essentially unchanged.”
There are no details available for the preliminary July estimate other than verbal guidance that gains in the public sector, finance and insurance and professional, scientific and technical services sectors were offset by dips in manufacturing, transportation and warehousing and construction. Details will arrive on September 29th.
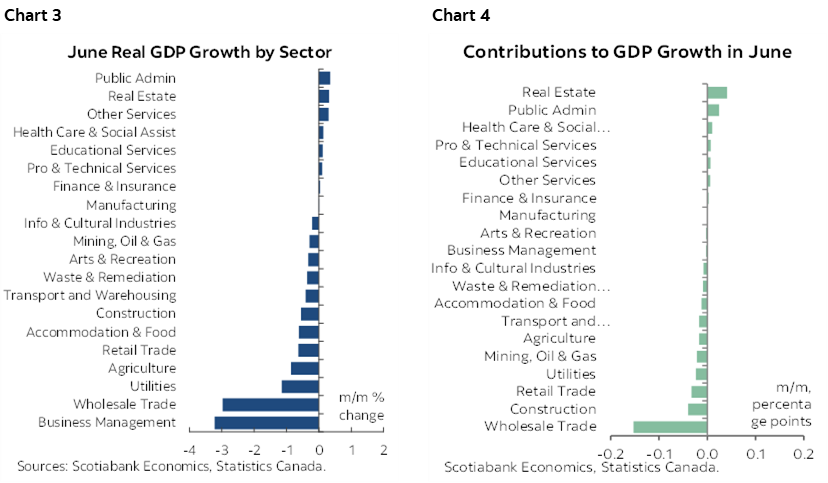
Chart 3 shows the drivers of June GDP by sector and how weakness was widespread. Chart 4 shows the same thing in terms of weighted contributions to GDP growth by sector that account for relative sizes.
WHAT’S BAKED INTO Q3?
Q3 has –0.4% q/q SAAR growth baked in thus far. That derived from using monthly GDP figures for Q2 and July and assuming that August and September come in flat solely in order to focus the math upon the known information to date.
There are two cautions here. One is that monthly GDP from the production side doesn’t capture factors like inventory and import swings that can impact quarterly GDP that is measured on an expenditure basis. Second is that we need to see readings on how the economy performed during August and September while leaving the door open to possibly rebounding.
TTTTTTRRANSITORY!
Not that word again! Ok but bear with me because I think it’s important to argue that much of the recent weakness in the economy is temporary due to a multitude of shocks that will lift and drive a probable rebound going forward. Don’t believe me? Read Statcan’s write up on June GDP here. I’ll rattle off some of their references to the distortions. Suffice it to say that while I expected wildfires to be disruptive to the readings, even I’m amazed at how widespread the cited effects turned out to be.
Wildfires were widely cited as drivers of weakness across sectors.
- Mining and quarrying ex-energy fell 5.7% m/m in June with metal ore mining down 6.7% mainly due to a whopping 35% drop in iron ore mining traceable to wildfire and maintenance effects. Mines in Quebec were shut due to wildfires.
- Wildfires were also cited as walloping rail transportation (-6.6%).
- Even accommodation and food services fell 0.6% m/m in June with wildfire effects on camps and parks cited as the driver. That means tourism-related activity was depressed due to the evacuation orders and the heavy smell of smoke that hung over large parts of the country this summer. That, in turn, likely explains some of the softness in consumer spending including services.
- Oil and gas extraction was up 1.1% in June but only partially reversed the 3.4% drop in May due to wildfires that shut in production.
- The agriculture/forestry/fishing sector fell 3.5% q/q in Q2. Fires were cited as the driver of lower crop production (-4.2% q/q in Q2).
- Forestry and logging output fell 4.5% q/q and fishing/hunting fell 9.8% again heavily due to wildfires.
- Added spending on fighting forest fires lifted support activities for forestry and agriculture by 1.8%.
Other disruptions cited by the agency including technical issues for airlines and staff shortages at airports that dropped that sector’s output by 1.2% m/m SA. I would add the likelihood that the BC port strike, flooding on Canada’s east coast and other weather effects weighed upon growth. For example, July was the wettest month on record in major cities like Toronto and Montreal and across southern Ontario and that can easily explain some of the softness in homebuilding plus outdoor activities. We will need to go through our own complete forecasting process in order to take into account today’s information and determine how much of the weakness was transitory versus indicative of momentum effects.
DISCLAIMER
This report has been prepared by Scotiabank Economics as a resource for the clients of Scotiabank. Opinions, estimates and projections contained herein are our own as of the date hereof and are subject to change without notice. The information and opinions contained herein have been compiled or arrived at from sources believed reliable but no representation or warranty, express or implied, is made as to their accuracy or completeness. Neither Scotiabank nor any of its officers, directors, partners, employees or affiliates accepts any liability whatsoever for any direct or consequential loss arising from any use of this report or its contents.
These reports are provided to you for informational purposes only. This report is not, and is not constructed as, an offer to sell or solicitation of any offer to buy any financial instrument, nor shall this report be construed as an opinion as to whether you should enter into any swap or trading strategy involving a swap or any other transaction. The information contained in this report is not intended to be, and does not constitute, a recommendation of a swap or trading strategy involving a swap within the meaning of U.S. Commodity Futures Trading Commission Regulation 23.434 and Appendix A thereto. This material is not intended to be individually tailored to your needs or characteristics and should not be viewed as a “call to action” or suggestion that you enter into a swap or trading strategy involving a swap or any other transaction. Scotiabank may engage in transactions in a manner inconsistent with the views discussed this report and may have positions, or be in the process of acquiring or disposing of positions, referred to in this report.
Scotiabank, its affiliates and any of their respective officers, directors and employees may from time to time take positions in currencies, act as managers, co-managers or underwriters of a public offering or act as principals or agents, deal in, own or act as market makers or advisors, brokers or commercial and/or investment bankers in relation to securities or related derivatives. As a result of these actions, Scotiabank may receive remuneration. All Scotiabank products and services are subject to the terms of applicable agreements and local regulations. Officers, directors and employees of Scotiabank and its affiliates may serve as directors of corporations.
Any securities discussed in this report may not be suitable for all investors. Scotiabank recommends that investors independently evaluate any issuer and security discussed in this report, and consult with any advisors they deem necessary prior to making any investment.
This report and all information, opinions and conclusions contained in it are protected by copyright. This information may not be reproduced without the prior express written consent of Scotiabank.
™ Trademark of The Bank of Nova Scotia. Used under license, where applicable.
Scotiabank, together with “Global Banking and Markets”, is a marketing name for the global corporate and investment banking and capital markets businesses of The Bank of Nova Scotia and certain of its affiliates in the countries where they operate, including; Scotiabank Europe plc; Scotiabank (Ireland) Designated Activity Company; Scotiabank Inverlat S.A., Institución de Banca Múltiple, Grupo Financiero Scotiabank Inverlat, Scotia Inverlat Casa de Bolsa, S.A. de C.V., Grupo Financiero Scotiabank Inverlat, Scotia Inverlat Derivados S.A. de C.V. – all members of the Scotiabank group and authorized users of the Scotiabank mark. The Bank of Nova Scotia is incorporated in Canada with limited liability and is authorised and regulated by the Office of the Superintendent of Financial Institutions Canada. The Bank of Nova Scotia is authorized by the UK Prudential Regulation Authority and is subject to regulation by the UK Financial Conduct Authority and limited regulation by the UK Prudential Regulation Authority. Details about the extent of The Bank of Nova Scotia's regulation by the UK Prudential Regulation Authority are available from us on request. Scotiabank Europe plc is authorized by the UK Prudential Regulation Authority and regulated by the UK Financial Conduct Authority and the UK Prudential Regulation Authority.
Scotiabank Inverlat, S.A., Scotia Inverlat Casa de Bolsa, S.A. de C.V, Grupo Financiero Scotiabank Inverlat, and Scotia Inverlat Derivados, S.A. de C.V., are each authorized and regulated by the Mexican financial authorities.
Not all products and services are offered in all jurisdictions. Services described are available in jurisdictions where permitted by law.