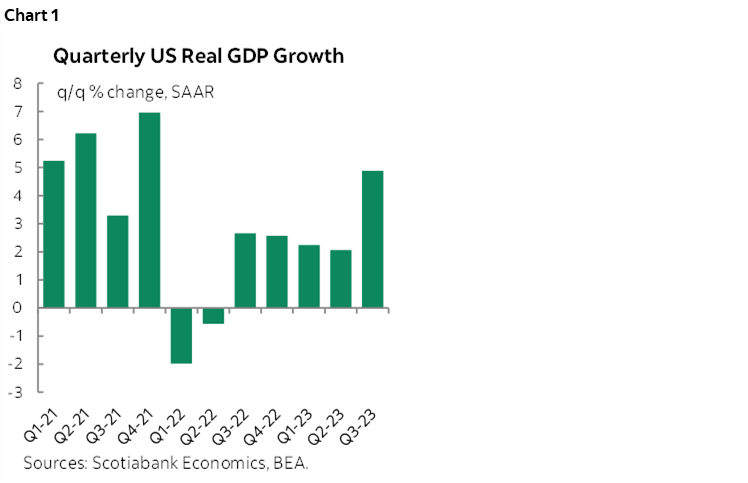
- US GDP growth beats again...
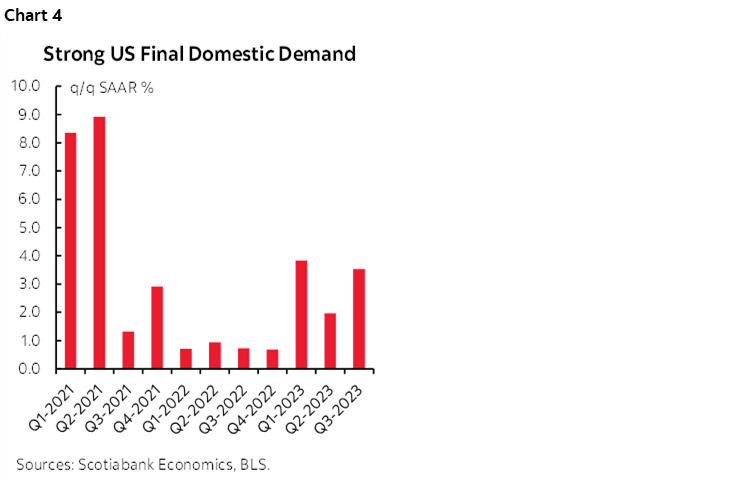
- ...and other readings were simultaneously strong...
- ...but yields rallied...
- ...perhaps by placing more attention upon core PCE
- We need tomorrow’s September PCE to assess pressures at the margin
- The FOMC might not see it the same way as markets did
- US Q3 GDP, q/q SAAR, %:
- Actual: 4.9%
- Scotia: 3.8
- Consensus: 4.5
- Prior: 2.1
A lot of information hit markets all at about the same time this morning (ECB, US indicators, etc) and this makes it difficult to draw overly strong conclusions about what markets reacted to. Nevertheless, it seems probable that US Treasury yields fell after 8:30amET US data because markets placed greater emphasis upon a small miss by core PCE inflation and ignored a beat by Q3 GDP alongside impressive details. I’m skeptical toward whether this was the correct reading from a Fed narrative standpoint.
First the data. Q3 GDP grew by 4.9% q/q SAAR and hence slightly in excess of consensus and well above the bottom end of consensus that had also included Scotiabank Economics’ estimate. Growth sharply accelerated to the strongest since 2021Q4 (chart 1).
Core PCE, however, missed consensus expectations by a tick and landed at 2.4% q/q SAAR. We can’t tell if that was due to revisions to prior months or a signal that tomorrow’s reading for core PCE in the month of September will land weaker than expected. We need to see tomorrow’s data in order to evaluate inflationary pressures at the margin using the Fed’s preferred gauge. For now, chart 2 largely just tells us what we know about the soft patch in monthly core PCE readings mapped onto the Q3 tally.
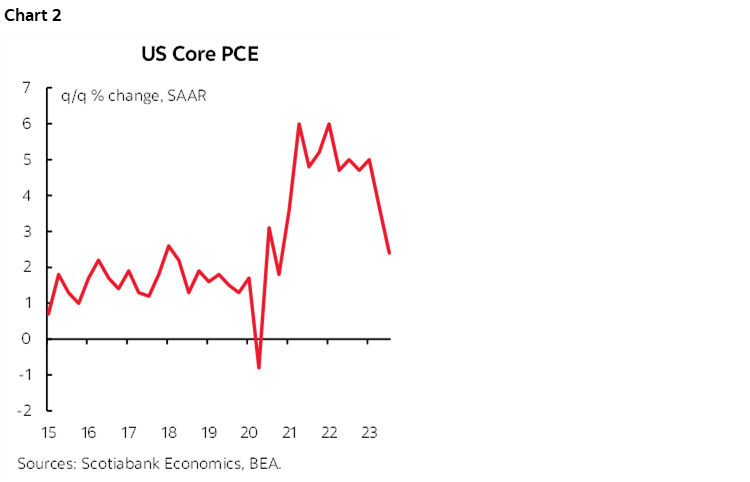
Chart 3 breaks down what drove Q3 GDP growth of 4.9% by individual expenditure driver. Consumption added 2.7ppts on a weighted contribution to GDP growth basis. That was split between services that added 1.6ppts and goods that added 1.1 ppts.
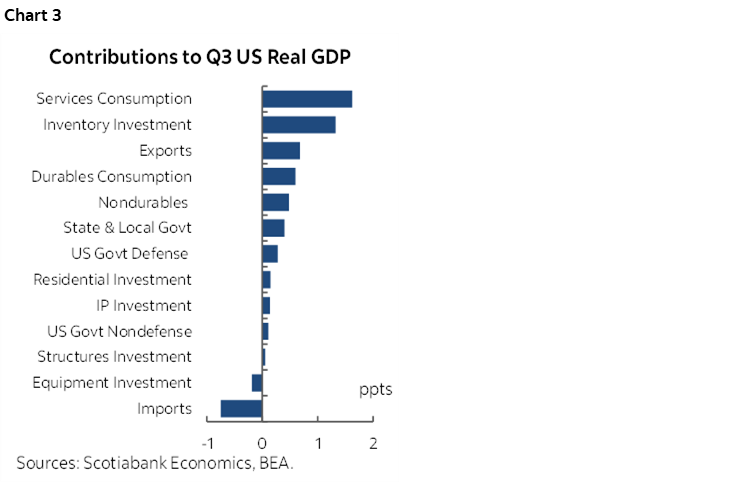
Investment added just 0.2 ppts to GDP growth. Nonresidential investment was flat as structures investment made no contribution to growth and equipment investment knocked off 0.2 ppts from GDP growth. Residential investment added 0.2 ppts.
Inventories added 1.3 ppts, all in nonfarm inventories. Even excluding this amount, growth would have been robust and I’ll come back to this in a moment.
Net trade was a small drag of -0.1 ppts as exports added 0.7 ppts and imports subtracted 0.75 ppts. In other words, imports increased in a reversal of the prior quarter's decline and that meant that in Q3 higher imports served as a bigger leakage effect on GDP growth (negative contribution) which is perhaps consistent with higher inventories. Companies are importing more and restocking perhaps in preparation for the holiday shopping season.
Government spending added 0.8 ppts and this was evenly split between Federal and state/local governments.
Final domestic demand few strongly in Q3 and posted a gain of 3.5% q/q SAAR (chart 4). Recall that FDD is consumption plus government spending plus investment and hence excludes inventories and net trade. This measure is clean of inventory and import effects that shouldn’t necessarily be stripped out but the strength in FDD serves as a cross check on how strong the domestic economy was last quarter.
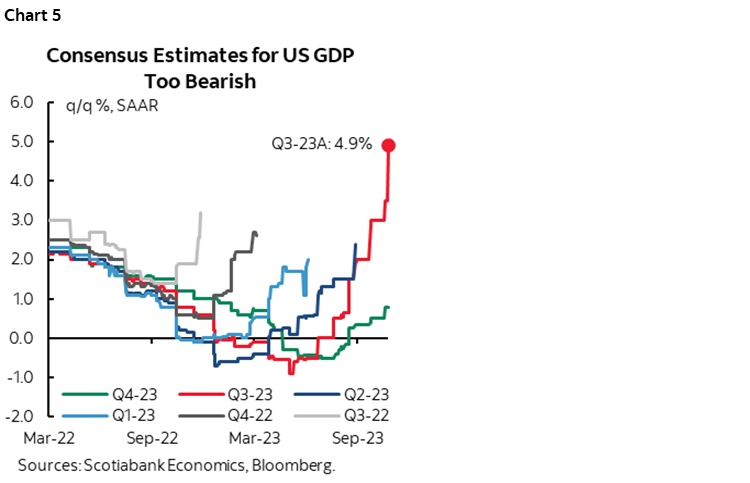
What today’s numbers achieved was to extend for yet another quarter the five-quarter streak of how consensus has come into each quarter thinking this is the one when the shoe will drop, only to spend the rest of the quarter revising up growth estimates and still being beaten in the end. There is nascent evidence that this is starting to happen again in Q4 (chart 5).
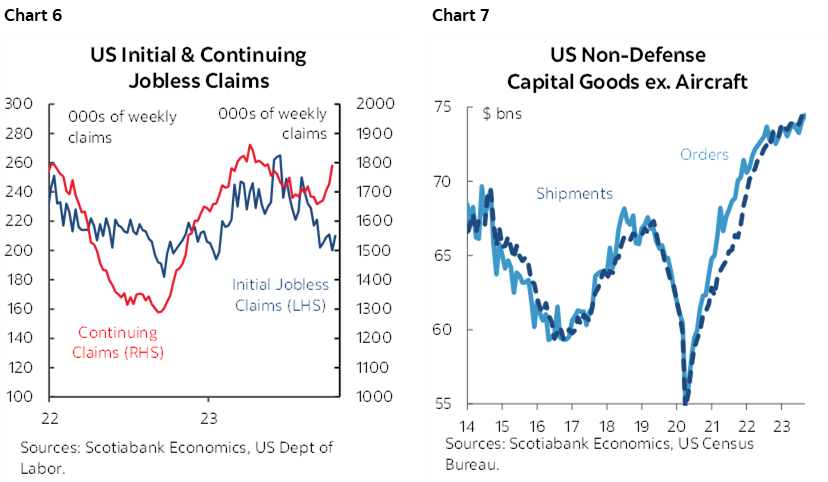
At the same time, weekly claims remained low at 210k last week (200k prior week) and US capital goods orders ripped (charts 6, 7). Core orders ex-defence and aircraft were up 0.6% m/m in September and revised up to 1.1% m/m in August (from 0.9%). Total durable goods orders were up 4.7% m/m SA (1.9% consensus). Business investment was very much alive in September.
WILL THE FED SEE IT THE SAME WAY AS MARKETS?
So did markets react the way they should have? I’m uncertain, but think that Chair Powell's argument is that persistent strength in GDP growth amplifies future inflation risk even if that output gap and augmented Phillips Curve approach to gauging future inflation has frankly been a dud to date. The US economy is showing few signs of slowing down and is therefore driving persistent capacity pressures that could be keeping inflation risk very much alive regardless of the summer/Q3 soft patch.
DISCLAIMER
This report has been prepared by Scotiabank Economics as a resource for the clients of Scotiabank. Opinions, estimates and projections contained herein are our own as of the date hereof and are subject to change without notice. The information and opinions contained herein have been compiled or arrived at from sources believed reliable but no representation or warranty, express or implied, is made as to their accuracy or completeness. Neither Scotiabank nor any of its officers, directors, partners, employees or affiliates accepts any liability whatsoever for any direct or consequential loss arising from any use of this report or its contents.
These reports are provided to you for informational purposes only. This report is not, and is not constructed as, an offer to sell or solicitation of any offer to buy any financial instrument, nor shall this report be construed as an opinion as to whether you should enter into any swap or trading strategy involving a swap or any other transaction. The information contained in this report is not intended to be, and does not constitute, a recommendation of a swap or trading strategy involving a swap within the meaning of U.S. Commodity Futures Trading Commission Regulation 23.434 and Appendix A thereto. This material is not intended to be individually tailored to your needs or characteristics and should not be viewed as a “call to action” or suggestion that you enter into a swap or trading strategy involving a swap or any other transaction. Scotiabank may engage in transactions in a manner inconsistent with the views discussed this report and may have positions, or be in the process of acquiring or disposing of positions, referred to in this report.
Scotiabank, its affiliates and any of their respective officers, directors and employees may from time to time take positions in currencies, act as managers, co-managers or underwriters of a public offering or act as principals or agents, deal in, own or act as market makers or advisors, brokers or commercial and/or investment bankers in relation to securities or related derivatives. As a result of these actions, Scotiabank may receive remuneration. All Scotiabank products and services are subject to the terms of applicable agreements and local regulations. Officers, directors and employees of Scotiabank and its affiliates may serve as directors of corporations.
Any securities discussed in this report may not be suitable for all investors. Scotiabank recommends that investors independently evaluate any issuer and security discussed in this report, and consult with any advisors they deem necessary prior to making any investment.
This report and all information, opinions and conclusions contained in it are protected by copyright. This information may not be reproduced without the prior express written consent of Scotiabank.
™ Trademark of The Bank of Nova Scotia. Used under license, where applicable.
Scotiabank, together with “Global Banking and Markets”, is a marketing name for the global corporate and investment banking and capital markets businesses of The Bank of Nova Scotia and certain of its affiliates in the countries where they operate, including; Scotiabank Europe plc; Scotiabank (Ireland) Designated Activity Company; Scotiabank Inverlat S.A., Institución de Banca Múltiple, Grupo Financiero Scotiabank Inverlat, Scotia Inverlat Casa de Bolsa, S.A. de C.V., Grupo Financiero Scotiabank Inverlat, Scotia Inverlat Derivados S.A. de C.V. – all members of the Scotiabank group and authorized users of the Scotiabank mark. The Bank of Nova Scotia is incorporated in Canada with limited liability and is authorised and regulated by the Office of the Superintendent of Financial Institutions Canada. The Bank of Nova Scotia is authorized by the UK Prudential Regulation Authority and is subject to regulation by the UK Financial Conduct Authority and limited regulation by the UK Prudential Regulation Authority. Details about the extent of The Bank of Nova Scotia's regulation by the UK Prudential Regulation Authority are available from us on request. Scotiabank Europe plc is authorized by the UK Prudential Regulation Authority and regulated by the UK Financial Conduct Authority and the UK Prudential Regulation Authority.
Scotiabank Inverlat, S.A., Scotia Inverlat Casa de Bolsa, S.A. de C.V, Grupo Financiero Scotiabank Inverlat, and Scotia Inverlat Derivados, S.A. de C.V., are each authorized and regulated by the Mexican financial authorities.
Not all products and services are offered in all jurisdictions. Services described are available in jurisdictions where permitted by law.