- Core CPI was slightly softer than expected, but the trend is hot
- Shelter and core goods weighed down inflation…
- ...but core service price inflation remains hot
- Markets has a relatively small reaction that marginally reinforced cut pricing
- US CPI / core CPI, m/m %, SA, September:
- Actual: 0.23 / 0.31
- Scotia: 0.3 / 0.3
- Consensus: 0.4 / 0.3
- Prior: 0.4 / 0.3
US core inflation came in slightly below almost all expectations for the month of September. Most of the softening was driven by shelter and little evidence of tariff pass through into core goods prices. Still, beneath the hood lies ongoing strong pressures on underlying core service prices.
The result added a little to market expectations for rate cuts by the Federal Reserve. The two-year Treasury yield fell by about 5–6bps at first but clawed that back to about 3bps. Cumulative pricing for cuts between now and the April meeting increased a bit to about 80bps of further reductions. The dollar swung from gaining against most major FX crosses to losing ground against most except for CAD in the wake of Trump’s attacks on Canada last night and continuing this morning.
Chart 1 shows the recent pattern. Core CPI landed at 2.75% m/m SAAR in September, down from 4.2% in August. The three month moving average is now 3.6% m/m SAAR. Don’t tell me that US inflationary pressures have gone away. I don’t believe that Chair Powell will say that next Wednesday, although he has pre-committed himself to looking through inflationary effects of tariffs as transitory should they arise.

DETAILS
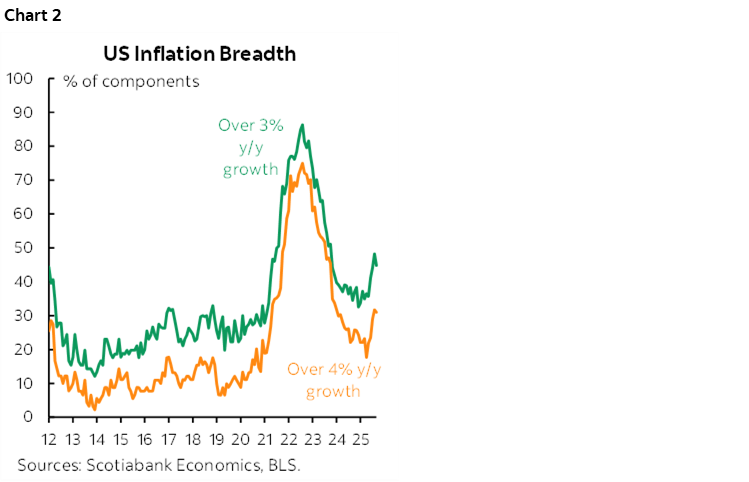
The breadth of inflationary pressures eased off a touch but remains high (chart 2).
Core goods inflation—where tariffs would be most likely to show up—was muted at just 0.22% m/m SA, or 2.7% m/m SAAR (chart 3). That’s not light, but cooler than the prior month’s reading.

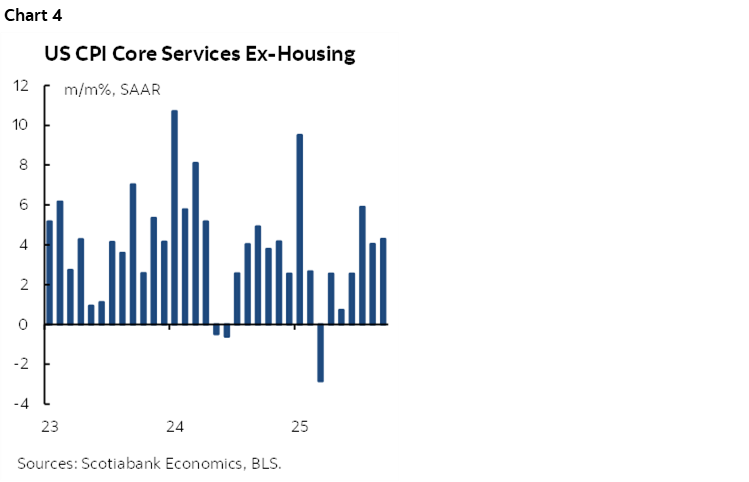
Core services inflation (ex-housing services and energy services) accounts for about one-quarter of the CPI basket and those prices were up by 0.35% m/m SA, or 4.3% m/m SAAR (chart 4). There remains high resilience in core service price inflation in the US economy.
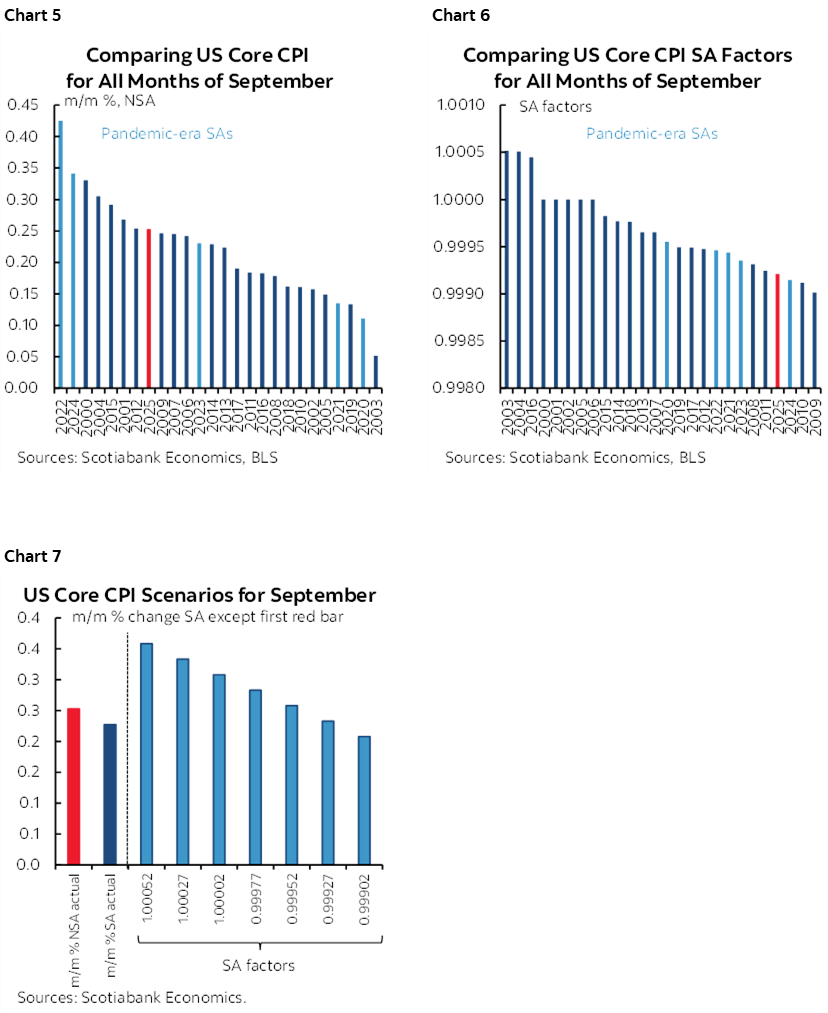
Seasonal factors were potentially distorting. September posted an above average m/m seasonally unadjusted gain in core CPI (chart 5) but this was tamped down by a lower than normal seasonal adjustment factor (chart 6). Core CPI was about as low as it could have been compared to using other SA factors drawn from prior months of September (chart 7). SA factors are mechanically calculated using standard X12A adjustments in unthinking fashion and these adjustments have a strong recency bias that may result in SA factors that are not appropriate.
It's somewhat futile without PPI, but based on core CPI versus core PCE weighting differences, core PCE is tracking very close to core CPI as 0.22% m/m SA. There are also other differences, like income and substitution effects that PCE does a better job of capturing, but in any event we won't get PCE until after the shutdown ends. Recall the only reason we go CPI was for the COLA requirements.
Watch the publication of the share of the CPI basket estimated using proxy means when it is likely to be published sometime after 11amET. That share has been over one-third of the basket—a record high—due to budget cuts at the BLS.
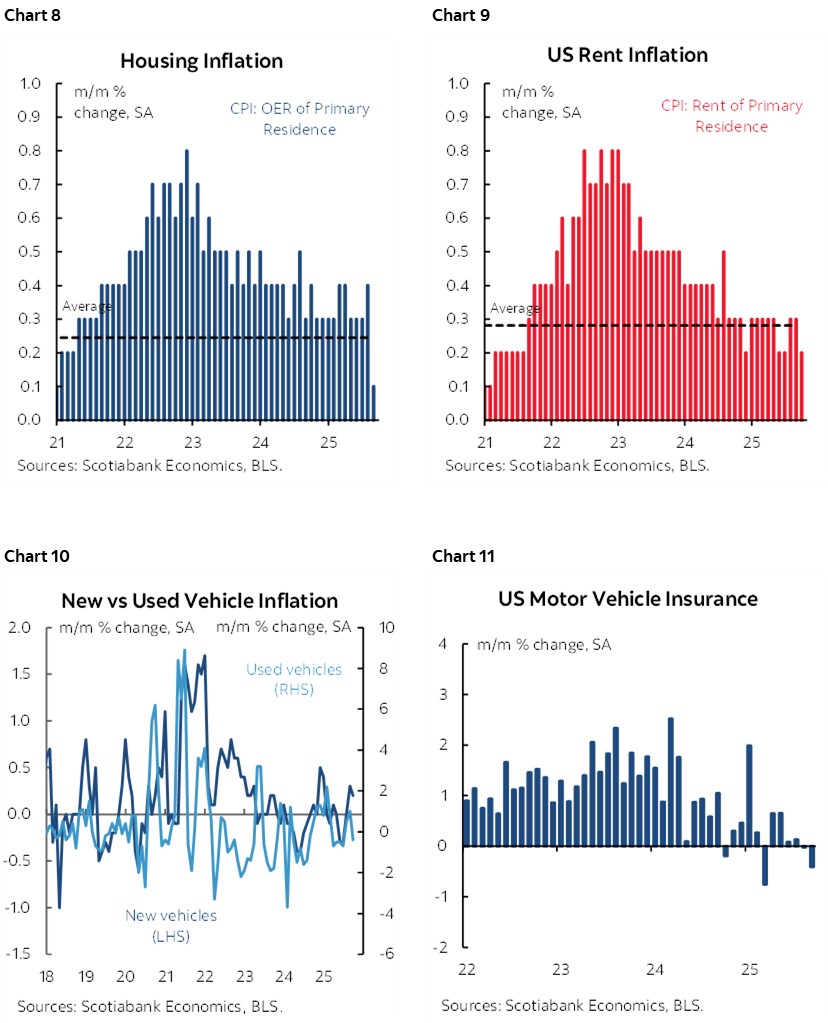
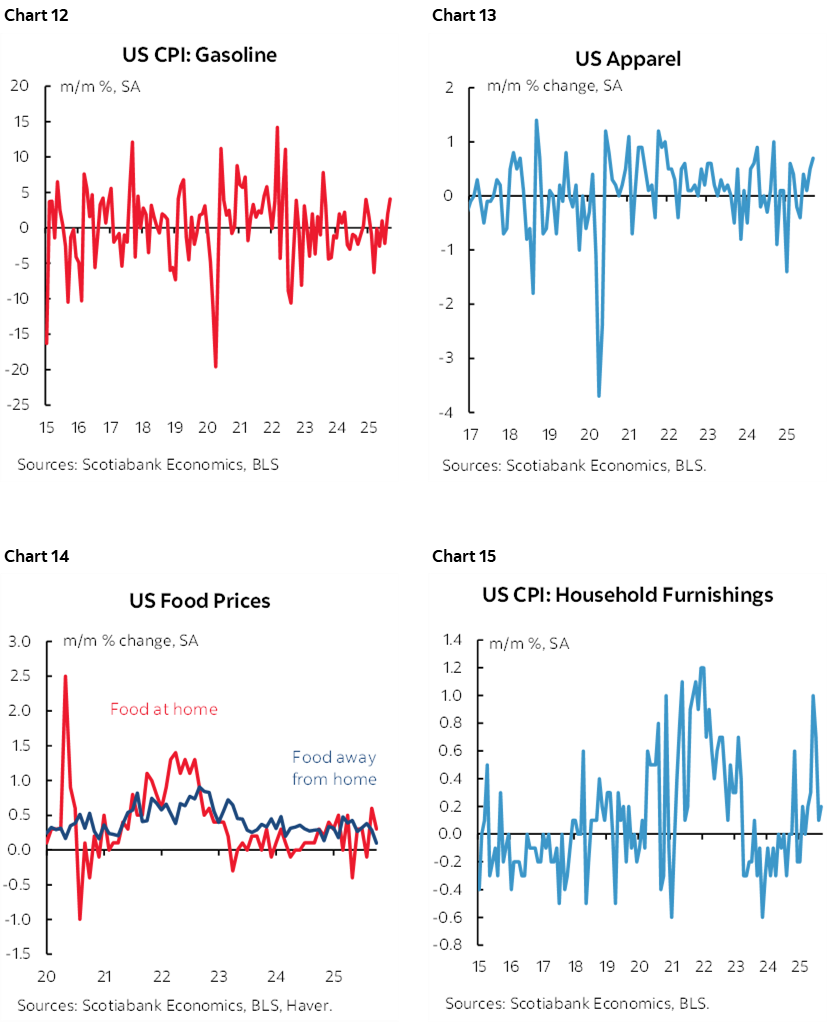
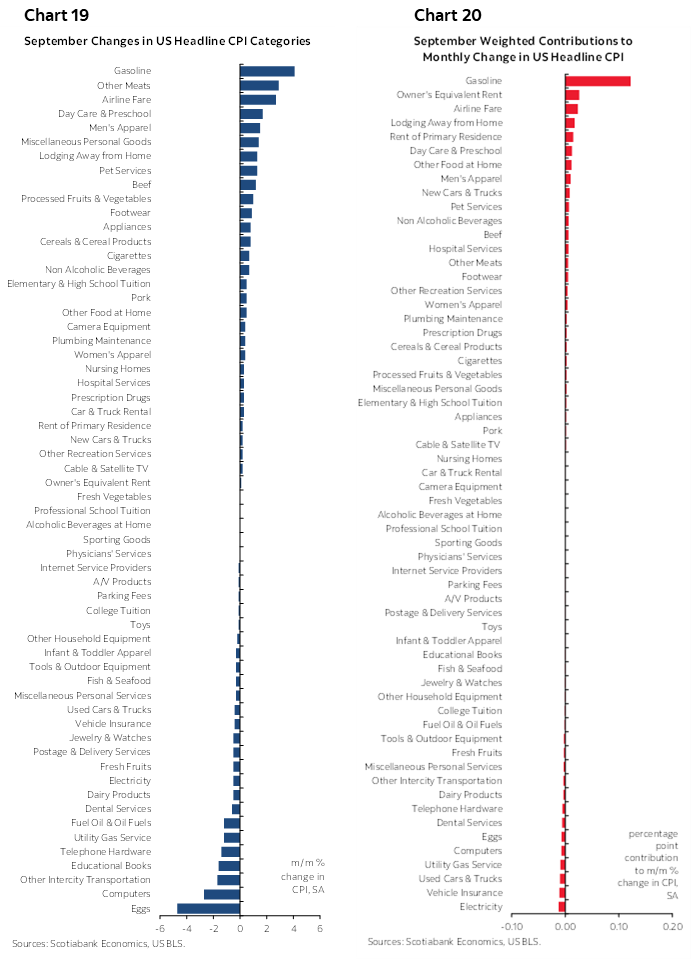
Please see charts 8–16 that provide a breakdown of select US CPI components. Charts 17–18 provide a breakdown of the whole basket in y/y terms that are both raw and as weighted contributions to the overall change in CPI. Charts 19–20 do likewise for the m/m CPI changes.


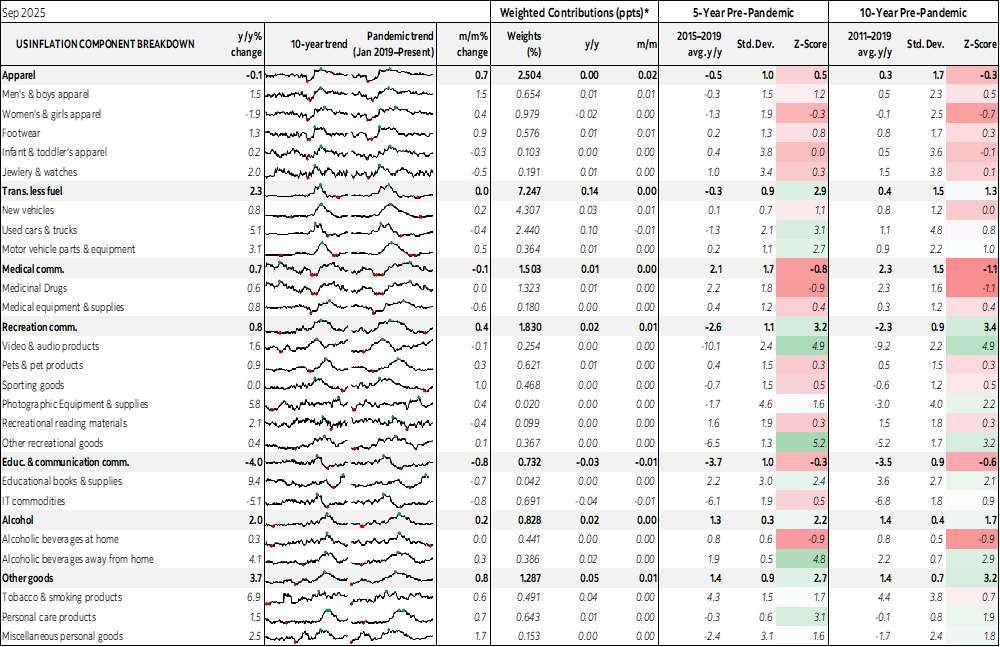
Please also see the accompanying table that provides further detail.


DISCLAIMER
This report has been prepared by Scotiabank Economics as a resource for the clients of Scotiabank. Opinions, estimates and projections contained herein are our own as of the date hereof and are subject to change without notice. The information and opinions contained herein have been compiled or arrived at from sources believed reliable but no representation or warranty, express or implied, is made as to their accuracy or completeness. Neither Scotiabank nor any of its officers, directors, partners, employees or affiliates accepts any liability whatsoever for any direct or consequential loss arising from any use of this report or its contents.
These reports are provided to you for informational purposes only. This report is not, and is not constructed as, an offer to sell or solicitation of any offer to buy any financial instrument, nor shall this report be construed as an opinion as to whether you should enter into any swap or trading strategy involving a swap or any other transaction. The information contained in this report is not intended to be, and does not constitute, a recommendation of a swap or trading strategy involving a swap within the meaning of U.S. Commodity Futures Trading Commission Regulation 23.434 and Appendix A thereto. This material is not intended to be individually tailored to your needs or characteristics and should not be viewed as a “call to action” or suggestion that you enter into a swap or trading strategy involving a swap or any other transaction. Scotiabank may engage in transactions in a manner inconsistent with the views discussed this report and may have positions, or be in the process of acquiring or disposing of positions, referred to in this report.
Scotiabank, its affiliates and any of their respective officers, directors and employees may from time to time take positions in currencies, act as managers, co-managers or underwriters of a public offering or act as principals or agents, deal in, own or act as market makers or advisors, brokers or commercial and/or investment bankers in relation to securities or related derivatives. As a result of these actions, Scotiabank may receive remuneration. All Scotiabank products and services are subject to the terms of applicable agreements and local regulations. Officers, directors and employees of Scotiabank and its affiliates may serve as directors of corporations.
Any securities discussed in this report may not be suitable for all investors. Scotiabank recommends that investors independently evaluate any issuer and security discussed in this report, and consult with any advisors they deem necessary prior to making any investment.
This report and all information, opinions and conclusions contained in it are protected by copyright. This information may not be reproduced without the prior express written consent of Scotiabank.
™ Trademark of The Bank of Nova Scotia. Used under license, where applicable.
Scotiabank, together with “Global Banking and Markets”, is a marketing name for the global corporate and investment banking and capital markets businesses of The Bank of Nova Scotia and certain of its affiliates in the countries where they operate, including; Scotiabank Europe plc; Scotiabank (Ireland) Designated Activity Company; Scotiabank Inverlat S.A., Institución de Banca Múltiple, Grupo Financiero Scotiabank Inverlat, Scotia Inverlat Casa de Bolsa, S.A. de C.V., Grupo Financiero Scotiabank Inverlat, Scotia Inverlat Derivados S.A. de C.V. – all members of the Scotiabank group and authorized users of the Scotiabank mark. The Bank of Nova Scotia is incorporated in Canada with limited liability and is authorised and regulated by the Office of the Superintendent of Financial Institutions Canada. The Bank of Nova Scotia is authorized by the UK Prudential Regulation Authority and is subject to regulation by the UK Financial Conduct Authority and limited regulation by the UK Prudential Regulation Authority. Details about the extent of The Bank of Nova Scotia's regulation by the UK Prudential Regulation Authority are available from us on request. Scotiabank Europe plc is authorized by the UK Prudential Regulation Authority and regulated by the UK Financial Conduct Authority and the UK Prudential Regulation Authority.
Scotiabank Inverlat, S.A., Scotia Inverlat Casa de Bolsa, S.A. de C.V, Grupo Financiero Scotiabank Inverlat, and Scotia Inverlat Derivados, S.A. de C.V., are each authorized and regulated by the Mexican financial authorities.
Not all products and services are offered in all jurisdictions. Services described are available in jurisdictions where permitted by law.