- Core inflation gauges remain within BoC’s target range
- Breadth of price pressures has improved
- Why the BoC will cut next week
- Why it shouldn’t, or why it should at least sound hawkish
- Canadian CPI m/m NSA // y/y %, September:
- Actual: +0.1 / 2.4
- Scotia: 0.0 / 2.3
- Consensus: -0.1 / 2.2
- Prior: -0.1 / 1.9
- Trimmed mean CPI (m/m SAAR %): 2.8
- Weighted median CPI (m/m SAAR %): 2.8
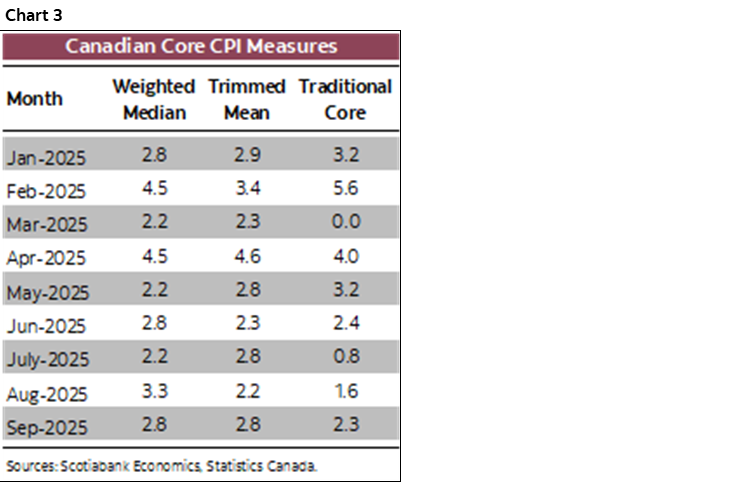
- CPI ex-food and energy CPI (m/m SAAR %): 2.3
Canadian core inflation measures remain good enough for the BoC to cut next week when properly evaluated in terms of month-over-month trends and breadth. I’ll explain my views about why it should be a careful, hawkish sounding cut.
Key is that each of the main core measures of inflation were well within the flexible 1–3% headline inflation target range and were likely overstated by mechanistic seasonal adjustments that may not be appropriate.
Chart 1 shows the trimmed mean and weighted median core measures that were both 2.8% m/m at a seasonally adjusted and annualized rate (SAAR). Chart 2 shows the traditional core CPI measure that only excludes food and energy and was 2.3% m/m SAAR.
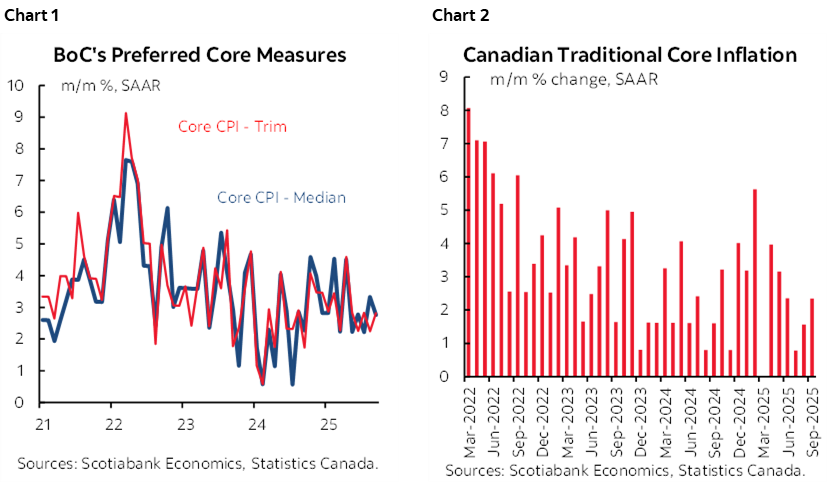
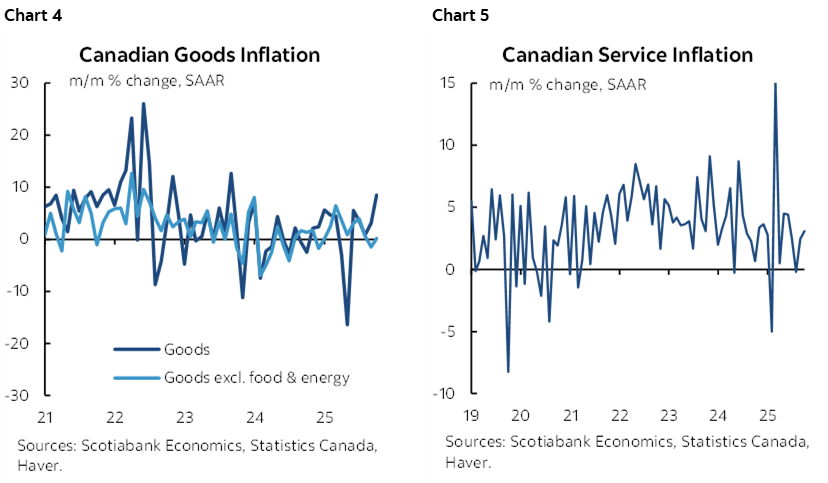
Chart 3 shows the pattern over 2025 for all three measures. They’ve generally been trending within the target range for a while now.
Core goods inflation was weak as the pressure came from the services side of the picture (charts 4, 5).
The BoC will mostly welcome the breadth readings (chart 6). They show that the share of the CPI basket that is cruising above 3% or 4% m/m SAAR is between roughly one-third and 40%.
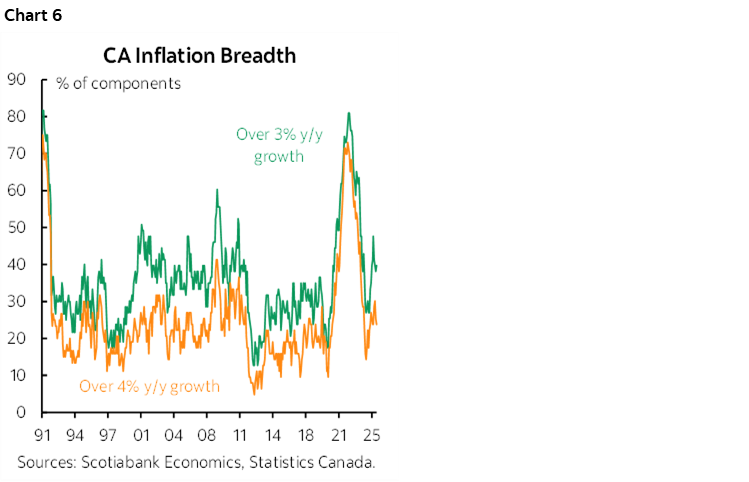
Chart 7 demonstrates that traditional core CPI was among the lowest on record for like months of September over time. What propped up the SA reading for traditional core in m/m SA terms was a high seasonal adjustment factor (chart 8).
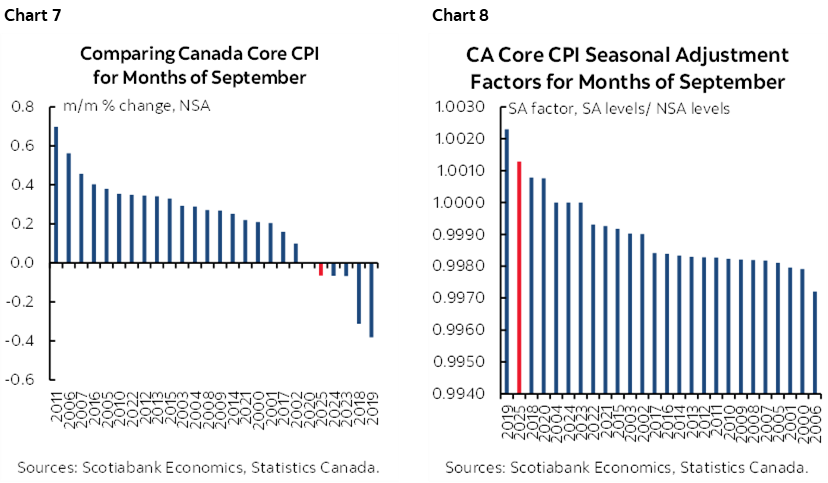
Statcan will say that the SA factor is just a mechanistic outcome of applying standard X12A seasonal adjustment methodologies that are commonly used by many data agencies. That’s not the same as saying we should take it at face value.
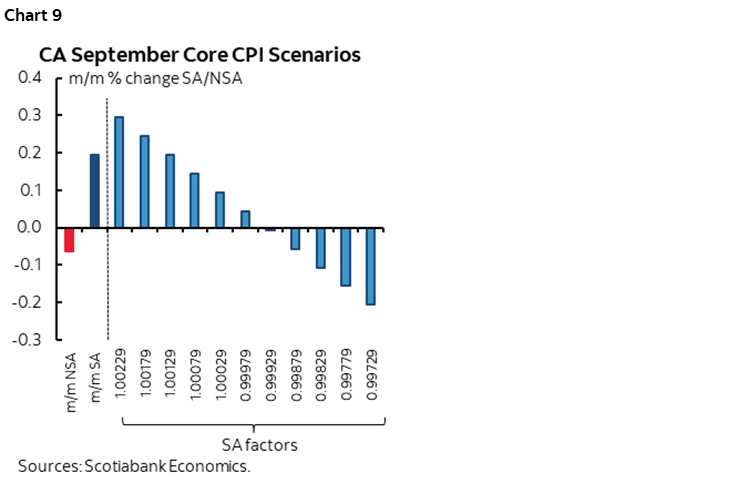
Chart 9 applies different SA factors drawn from the history of SA factors for months of September to show hoe core CPI would have changed. At most other SA factors in time, traditional core CPI would have been weaker than reported and possibly even negative.
BoC CALL
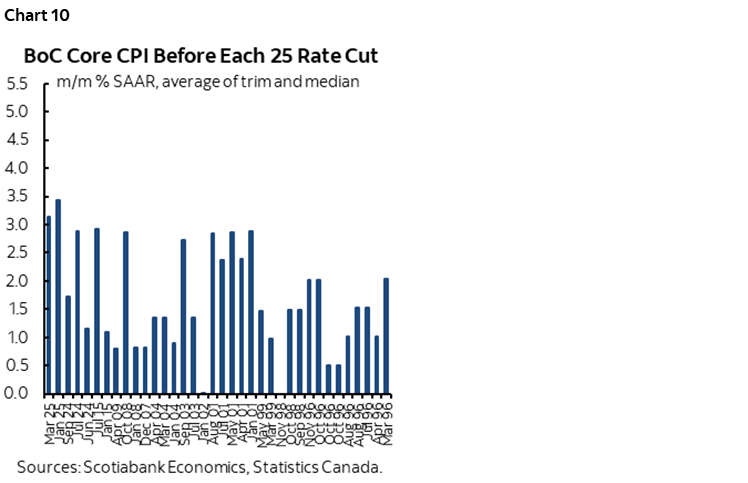
There is plenty of precedence to cut after the average of TM and WM cpi landed at about 2¾% m/m SAAR. In fact, they've done so a half dozen or so times in the past (chart 10). I think the BoC will work the flexible inflation target range that Macklem keeps emphasizing and deliver easing next Wednesday but with a hawkish sounding and noncommittal feel.
Why cut?
- They’d need good arguments against a cut that I don’t think they have in relation to disappointing the two-thirds market pricing of a 25bps cut. From a risk-reward standpoint, it may be more difficult to justify holding than to cut and, if they agree, sound like they’re shifting to the sidelines.
- Core inflation measures are in the range on a higher frequency m/m SAAR basis for a while now.
- Their July MPR expected inflation to be around 2% by the end of 2026 in the current tariffs scenario. Developments since then likely have them thinking there is more downside to that forecast than upside, ergo give it a nudge.
- One cut doesn't do it given my longstanding bag of chips metaphor and that you can’t just pull one chip out of the bag.
- Jobs rebounded, but the BoC always fades just one spot number for the volatile household survey and the trend is weak.
- GDP is weakening with basically no growth being tracked in Q3 so slack continues to open up. On the one hand, that's why they were cutting from last July to this March in anticipation of a souring economy. Plus, the economy is broadly tracking their expectations in the July MPR. But key may be Macklem’s ongoing guidance they expect a slight improvement in growth by at rates still below the economy’s potential GDP growth rate which means more slack opening up over time.
- You could argue the Budget's influences both ways. Wait to see if PM Carney is going to prime the pump a lot, versus act now because it might be optically harder to act after the Budget is presented and passed. I think at this juncture, the BoC will say they want to err on the side of combining policy measures.
- Macklem is a dove at heart. I rarely take him seriously when he jawbones inflation risk. He’s a labour market guy at heart as he was when delivering fully inclusive speeches as Senior Deputy Governor under BoC Governor Carney at the time and more recently in the pandemic.
- Trade policy uncertainty will be elevated for a long time yet. Talk of a possible agreement soon sounds very limited, mostly metals, with the negotiators distancing themselves from rumours. Other tariffs have worsened.
Why not cut, or why to sound hawkish?
Then there are plenty of counter-arguments to easing now which at a minimum should have the BoC leaning against extreme dovish views.
- the real policy rate is zero and we're already well within the neutral r* range.
- Financial conditions are buoyant. There is no financial crisis notwithstanding persistent risks.
- Monetary policy entails lagging effects and we’re still inside the full pass through of 250bps of rate cuts that began in June of last year through to March of this year. Give it time for a zero real rate to work through.
- there are more drivers of inflation risk than just output gaps. Costs are under upward pressure through the whole value-added supply chain. Labour settlements are too hot, productivity is not, inventories are high, and supply chains are at a highly nascent stage of being revamped in the US-driven global trade war and revamping them entails higher costs. Someone pays those higher costs. Sensible incidence effects would have one thinking everyone will share in it including higher prices for consumers in a longer wave sense.
- so overall, I'm still of the belief that if I were Macklem, I would not be easing now. I would take a rather BoE-like approach to ‘gradual’. Spread it out, and assess new information along the way.
- and I still think the tariff shock to Canada is often exaggerated. The effective tariff rate has bumped up to 6%. USDCAD over 1.40 is doing what a flexible exchange rate should do to help assuage the shock to the terms of trade. Remove the tariffs on the most affected narrow sectors, and the tariff shock is tiny given the high CUSMA/USMCA compliance rate.
- Canada has the lowest tariff shock against any notable US trade partner by far. Anything can happen to CUSMA/USMCA but you can't conduct monetary policy when the outcome could be bi-modal in nature.
DETAILS
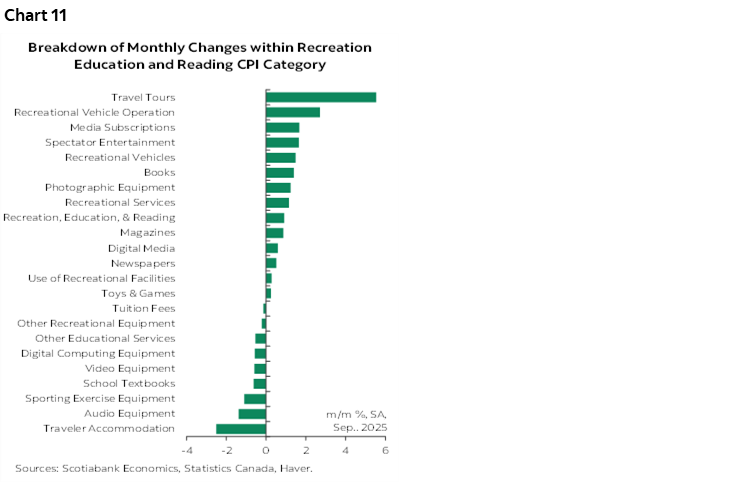
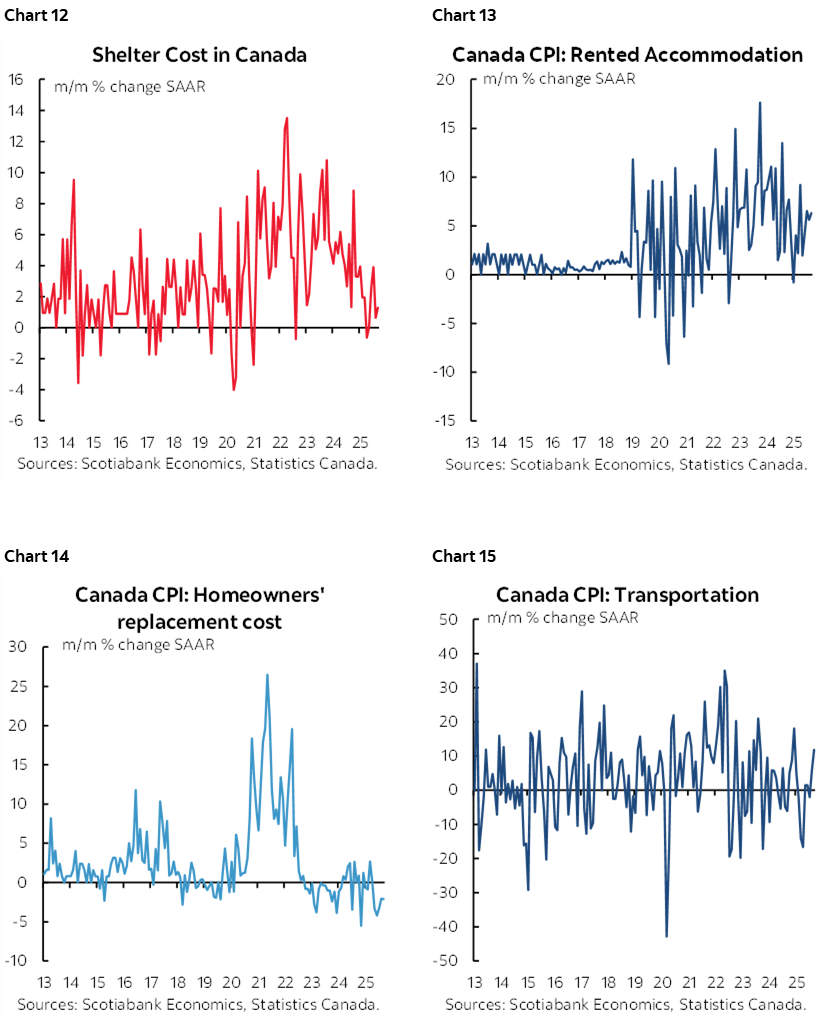
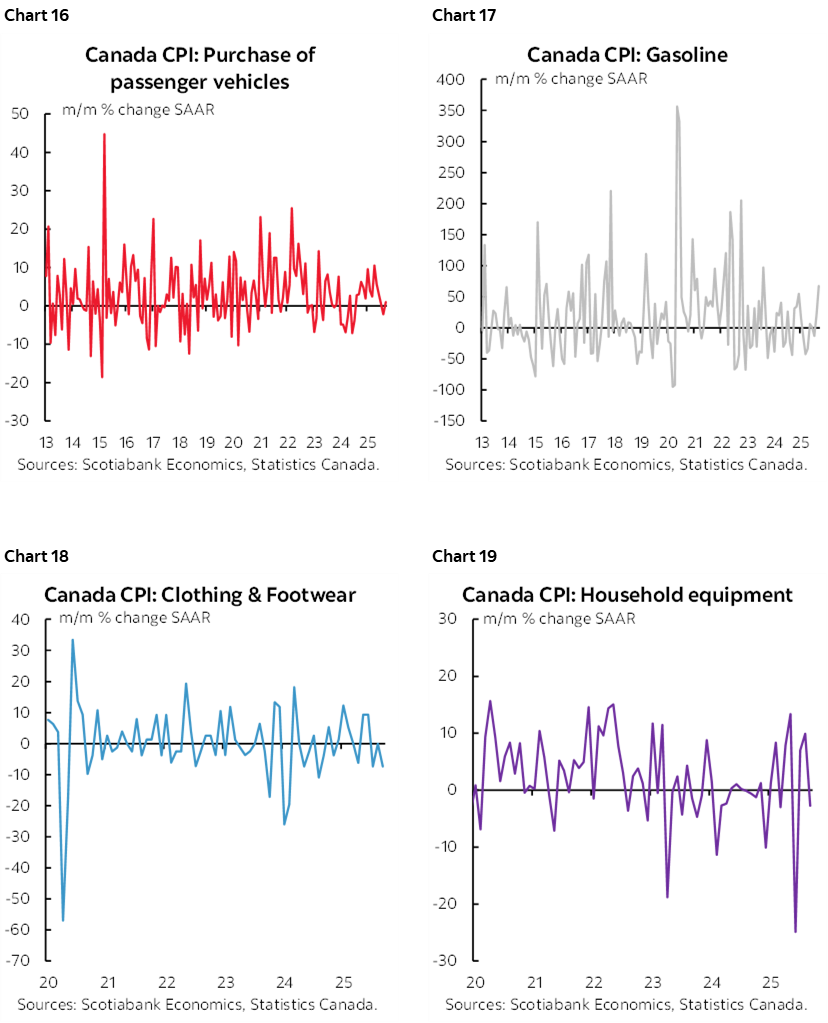
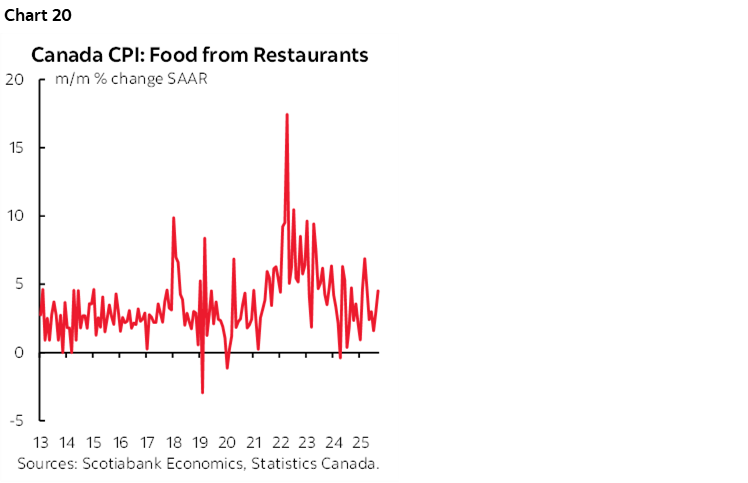
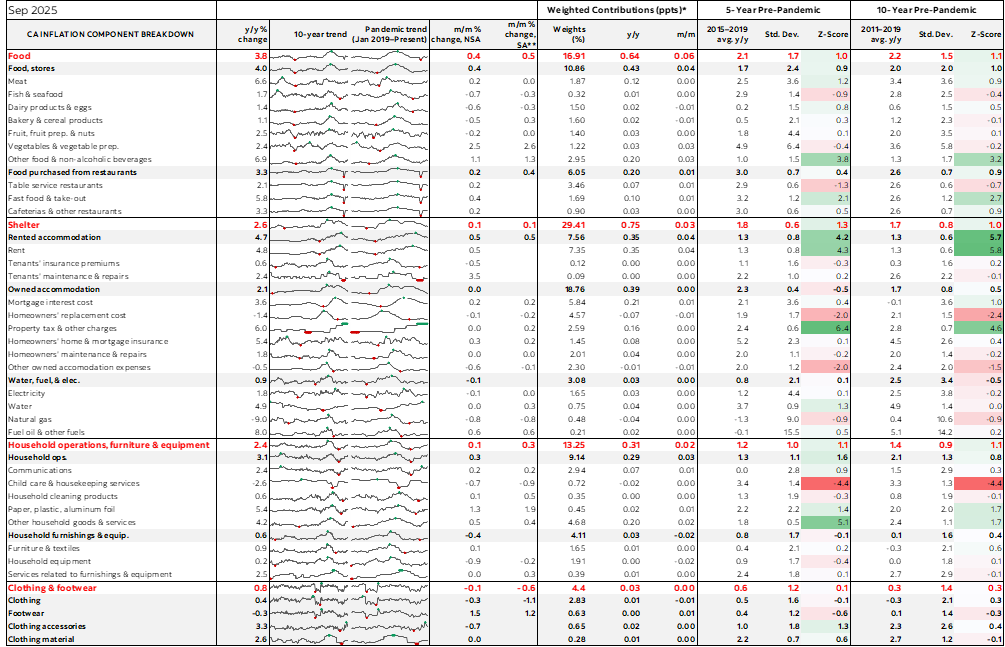
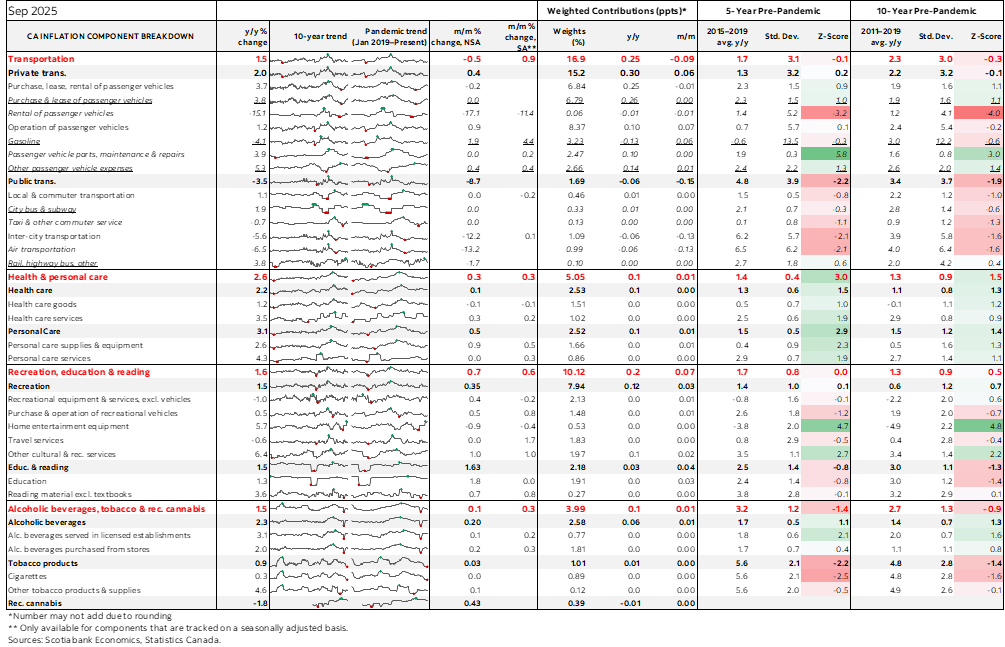
Charts 11–20 give breakdowns of select components of the CPI basket. The recreation category’s 0.6% m/m SA rise was driven by travel tours as the biggest gainer. Shelter cost inflation has subsided but not because of direct primary rent that remains warm. Transportation costs were buoyed by gasoline.
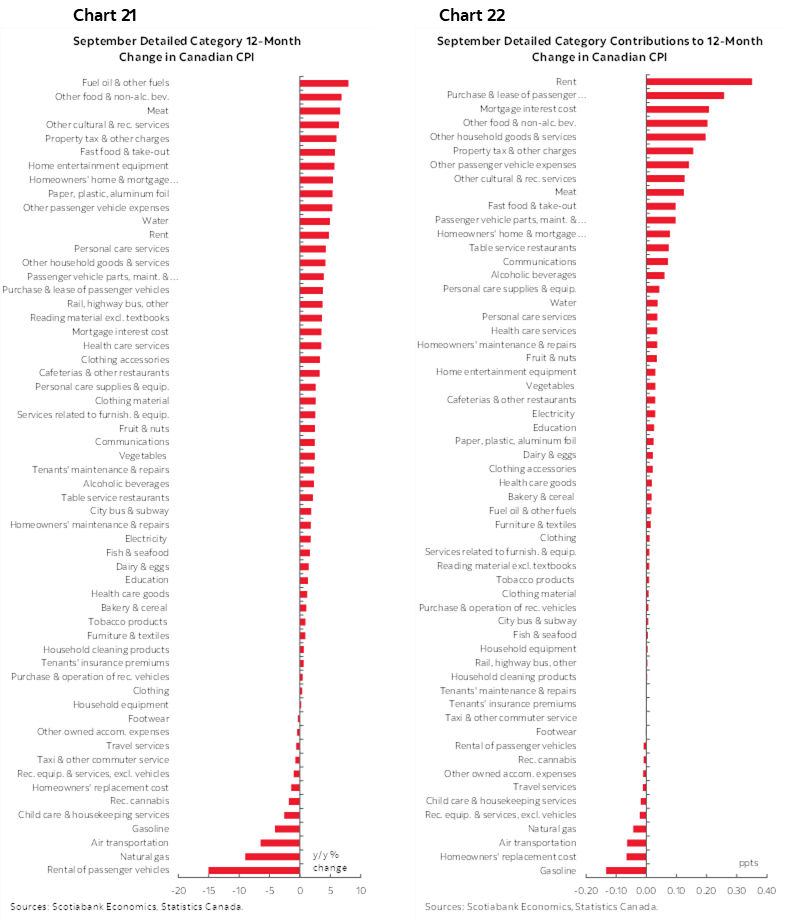
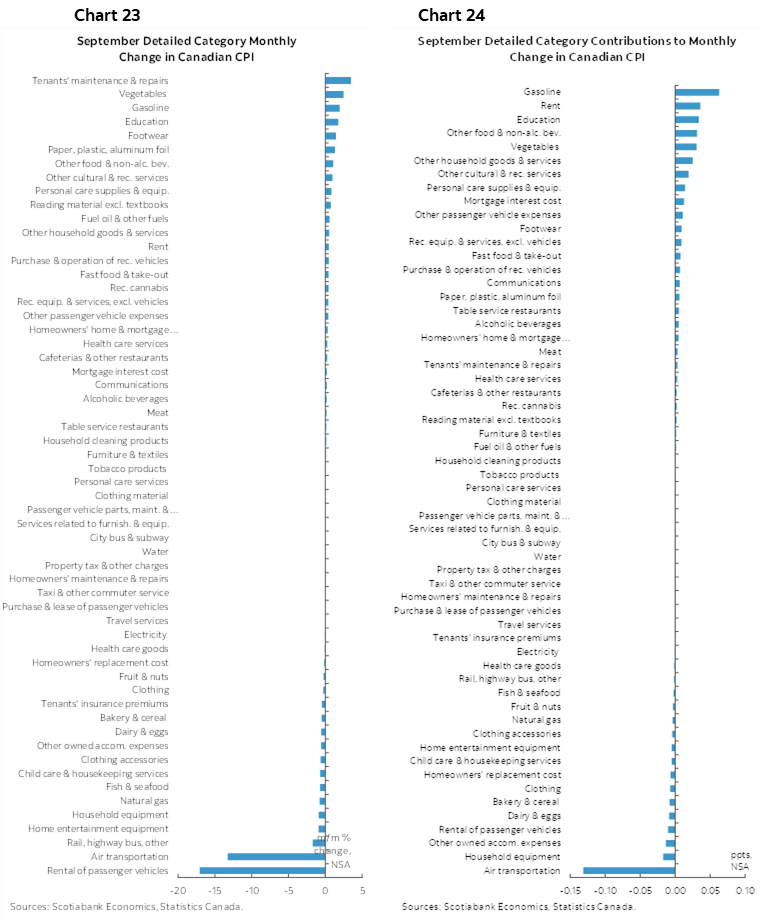
Charts 20–21 provide a breakdown fo the whole y/y CPI basket in raw terms and in terms of weighted contributions to the overall index’s rise. Charts 22–23 do likewise in m/m terms.
DISCLAIMER
This report has been prepared by Scotiabank Economics as a resource for the clients of Scotiabank. Opinions, estimates and projections contained herein are our own as of the date hereof and are subject to change without notice. The information and opinions contained herein have been compiled or arrived at from sources believed reliable but no representation or warranty, express or implied, is made as to their accuracy or completeness. Neither Scotiabank nor any of its officers, directors, partners, employees or affiliates accepts any liability whatsoever for any direct or consequential loss arising from any use of this report or its contents.
These reports are provided to you for informational purposes only. This report is not, and is not constructed as, an offer to sell or solicitation of any offer to buy any financial instrument, nor shall this report be construed as an opinion as to whether you should enter into any swap or trading strategy involving a swap or any other transaction. The information contained in this report is not intended to be, and does not constitute, a recommendation of a swap or trading strategy involving a swap within the meaning of U.S. Commodity Futures Trading Commission Regulation 23.434 and Appendix A thereto. This material is not intended to be individually tailored to your needs or characteristics and should not be viewed as a “call to action” or suggestion that you enter into a swap or trading strategy involving a swap or any other transaction. Scotiabank may engage in transactions in a manner inconsistent with the views discussed this report and may have positions, or be in the process of acquiring or disposing of positions, referred to in this report.
Scotiabank, its affiliates and any of their respective officers, directors and employees may from time to time take positions in currencies, act as managers, co-managers or underwriters of a public offering or act as principals or agents, deal in, own or act as market makers or advisors, brokers or commercial and/or investment bankers in relation to securities or related derivatives. As a result of these actions, Scotiabank may receive remuneration. All Scotiabank products and services are subject to the terms of applicable agreements and local regulations. Officers, directors and employees of Scotiabank and its affiliates may serve as directors of corporations.
Any securities discussed in this report may not be suitable for all investors. Scotiabank recommends that investors independently evaluate any issuer and security discussed in this report, and consult with any advisors they deem necessary prior to making any investment.
This report and all information, opinions and conclusions contained in it are protected by copyright. This information may not be reproduced without the prior express written consent of Scotiabank.
™ Trademark of The Bank of Nova Scotia. Used under license, where applicable.
Scotiabank, together with “Global Banking and Markets”, is a marketing name for the global corporate and investment banking and capital markets businesses of The Bank of Nova Scotia and certain of its affiliates in the countries where they operate, including; Scotiabank Europe plc; Scotiabank (Ireland) Designated Activity Company; Scotiabank Inverlat S.A., Institución de Banca Múltiple, Grupo Financiero Scotiabank Inverlat, Scotia Inverlat Casa de Bolsa, S.A. de C.V., Grupo Financiero Scotiabank Inverlat, Scotia Inverlat Derivados S.A. de C.V. – all members of the Scotiabank group and authorized users of the Scotiabank mark. The Bank of Nova Scotia is incorporated in Canada with limited liability and is authorised and regulated by the Office of the Superintendent of Financial Institutions Canada. The Bank of Nova Scotia is authorized by the UK Prudential Regulation Authority and is subject to regulation by the UK Financial Conduct Authority and limited regulation by the UK Prudential Regulation Authority. Details about the extent of The Bank of Nova Scotia's regulation by the UK Prudential Regulation Authority are available from us on request. Scotiabank Europe plc is authorized by the UK Prudential Regulation Authority and regulated by the UK Financial Conduct Authority and the UK Prudential Regulation Authority.
Scotiabank Inverlat, S.A., Scotia Inverlat Casa de Bolsa, S.A. de C.V, Grupo Financiero Scotiabank Inverlat, and Scotia Inverlat Derivados, S.A. de C.V., are each authorized and regulated by the Mexican financial authorities.
Not all products and services are offered in all jurisdictions. Services described are available in jurisdictions where permitted by law.