- Canada gained 60k jobs in September with some decent details
- Seasonality quirks should dampen confidence in the data
- Why October’s BoC decision may still be live
- Canada employment m/m 000s / UR %, SA, September:
- Actual: +60.4 / 7.1
- Scotia: -50 / 7.2
- Consensus: +5.0 / 7.1
- Prior: -65.5 / 7.1
There are few—but meaningful—holes to poke in a very strong Canadian employment report that adds to evidence in favour of a hold by the Bank of Canada on October 29th.
That’s more probable now, but not assured. We still need to see CPI on October 21st and the BoC’s quarterly surveys the day before, but at this point the odds of skipping the meeting have gone up. The economy is still weak and building spare capacity which could motivate the BoC to opt in favour of additional insurance. The BoC looks at job market trends that are still weak with employment down 46k in Q3 and there is a strong reason to be careful interpreting this round of jobs numbers.
DETAILS
Chart 1 provides some summary metrics. Total employment was up by +60.4k. Almost all of that was in payrolls (+53k) with public sector payrolls up by 31k and private sector payrolls up by 22k but self-employed was also a little higher at +8k.
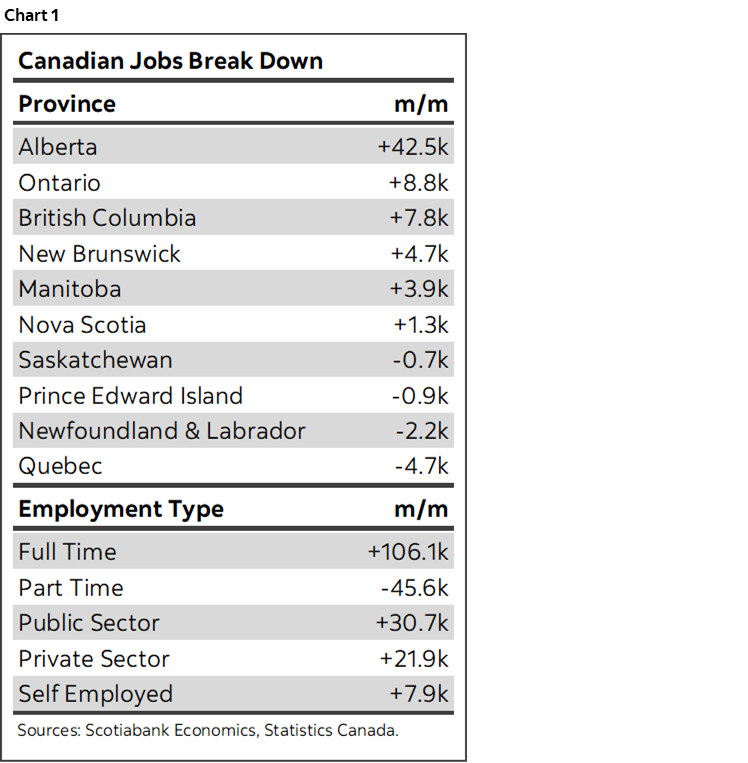
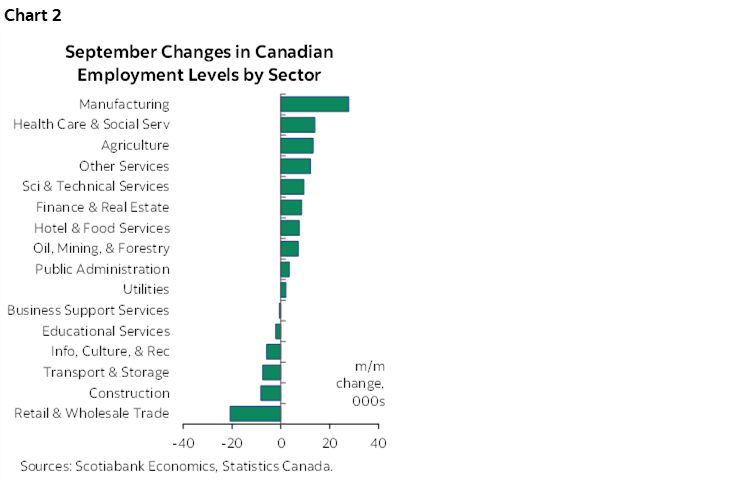
Chart 2 shows the breakdown of job growth by sector. Somehow manufacturers added 28k jobs. The rest was mostly in health care and social assistance plus 'other' services ex-public admin. There was decent breadth to small gains in some sectors. The only notable downside was the retail/wholesale sector.
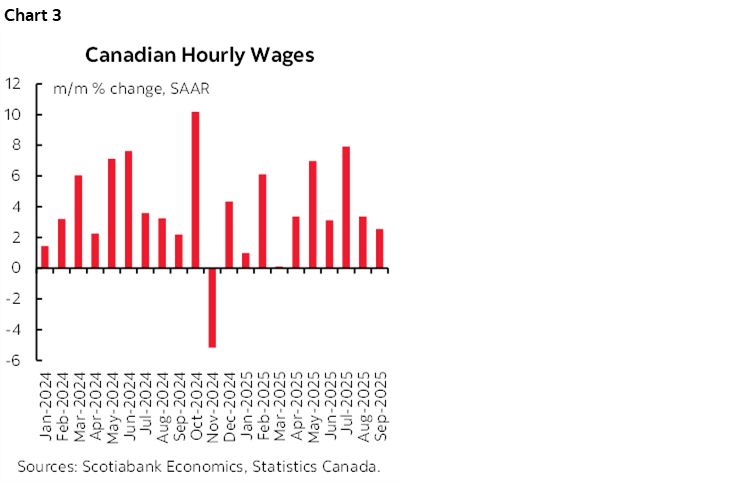
Wages grew by 2.5% m/m SAAR (chart 3). That’s the second consecutive slow down, but with the same cautions that collective bargaining exercises remain skewed toward above-inflation wage gains for years to come.
All of the gain was in full-time jobs at +106k with part-time losses at -46k.
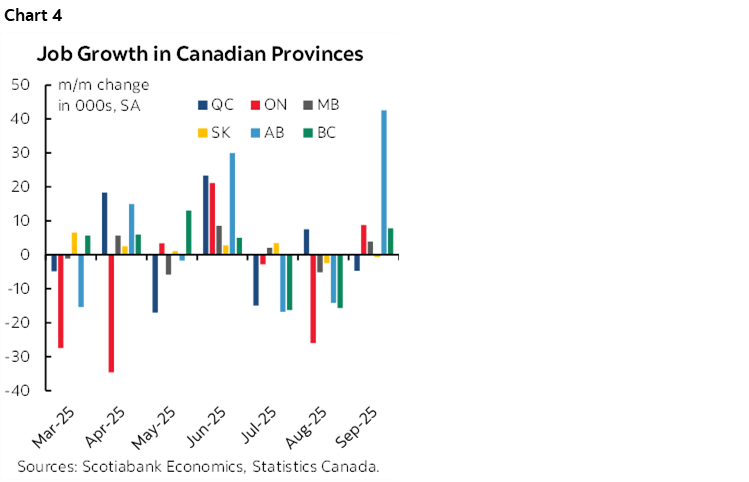
Go Alberta! That one province’s +43k job gain was the dominant driver. BC was up 8k. Other provinces were a combination of small gains and small losses. Chart 4. The manufacturing gain was in Ontario (+12k) and Alberta (+7.9k). Alberta's 43k job gain was 26k in goods sectors led by construction (+8.4k) and manufacturing (+7.9k) plus services (+16.7k) led by prof/scientific/technical (+6.5k), education (+7.4k), public admin (6.6k), 'other' services (6.6k) and health care (+4.2k).
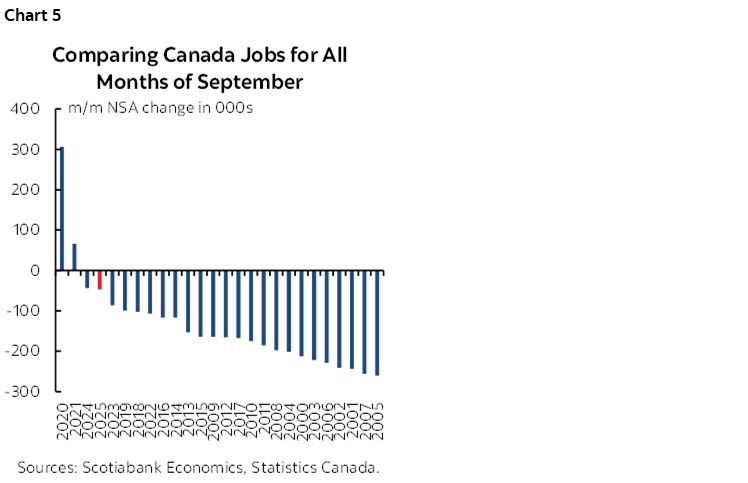
Where I’m skeptical is toward the seasonality aspects of the report. For one, there was an unusually light m/m NSA drop in a month that's usually much bigger (chart 5). That’s the second year in a row when that’s happened. In fact, the month of September has seen the strongest seasonally unadjusted readings— either the biggest gains or the smallest dips—for overall employment on record in each of the pandemic and post-pandemic years from 2020 through to 2025 as shown in the chart. Is this because of changes in seasonal hiring patterns that are genuine in nature only since the pandemic, or that are not being properly controlled? It’s hard to tell and Statcan offers nothing to back up whether or not this is credible.
Further, the SA factor moved HIGHER which negates the whole argument about shedding the pandemic-era weights in a changing recency bias that was previously showing signs of moderating more toward averages (chart 6). This September’s SA factor was among the highest recorded for like months of September. Anything lower would have strongly dented the headline jobs number.
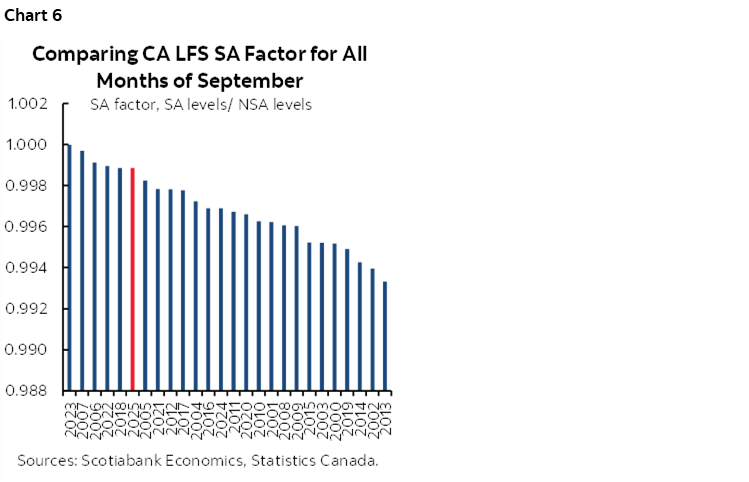
In fact, had Statcan stuck with the September 2024 SA factor, then jobs would have risen by about 20k, or one-third of the reported pace. Again, the question is whether seasonal adjustments are properly controlling for changes in hiring patterns. Statcan will simply say it’s the SA factor that is spat out of an X12A seasonal adjustment calculation but missing is any intuitive explanation for why this September pivoted back to some of the highest seasonal adjustment factors since the pandemic and its immediate aftermath. Take the numbers with a lot of salt in my view.
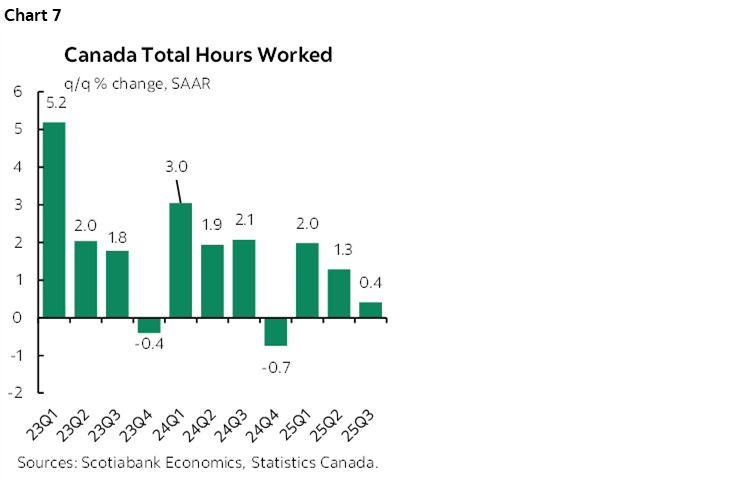
Hours worked are tracking softly for purposes of estimating September monthly GDP and Q3 GDP. Hours were down by 0.2% m/m SA. They were only up by 0.4% q/q SAAR rise in Q3 overall (chart 7). Since GDP is an identity defined as hours times labour productivity, such meek hours worked figures indicate a soft economy especially since productivity is hardly Canada’s strong suit.
By cohort, the gain was led by women 25+ (+40k) followed by men 25+ (25k) as youths 15–24 lost a small amount (-4k).
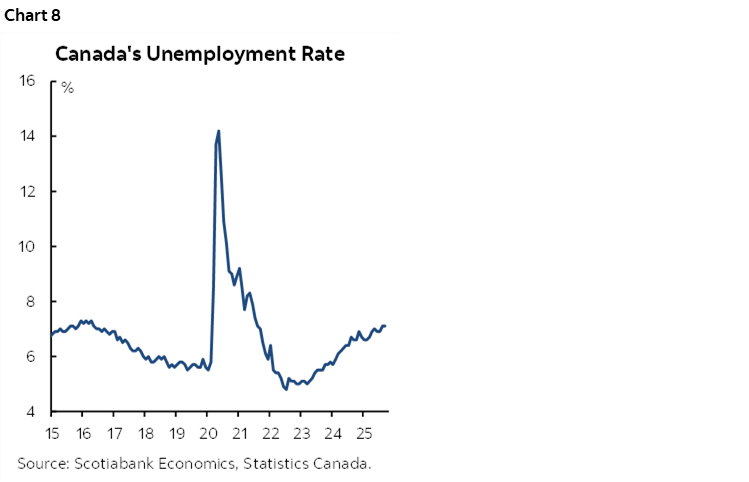
The unemployment rate held stable at 7.1% this month compared to the upward trend since 2022–23 that was primarily driven by an excessive number of temporary residents. Chart 8.
Shortly after the numbers, Ottawa announced a limited set of three policy measures that carry micro, not macro implications. It will make automatic federal benefits entitlement to low-income workers with automated tax filings, make a national school food program permanent and renewed the Canada Strong travel pass. These are not judged to be significant to the macro landscape.
DISCLAIMER
This report has been prepared by Scotiabank Economics as a resource for the clients of Scotiabank. Opinions, estimates and projections contained herein are our own as of the date hereof and are subject to change without notice. The information and opinions contained herein have been compiled or arrived at from sources believed reliable but no representation or warranty, express or implied, is made as to their accuracy or completeness. Neither Scotiabank nor any of its officers, directors, partners, employees or affiliates accepts any liability whatsoever for any direct or consequential loss arising from any use of this report or its contents.
These reports are provided to you for informational purposes only. This report is not, and is not constructed as, an offer to sell or solicitation of any offer to buy any financial instrument, nor shall this report be construed as an opinion as to whether you should enter into any swap or trading strategy involving a swap or any other transaction. The information contained in this report is not intended to be, and does not constitute, a recommendation of a swap or trading strategy involving a swap within the meaning of U.S. Commodity Futures Trading Commission Regulation 23.434 and Appendix A thereto. This material is not intended to be individually tailored to your needs or characteristics and should not be viewed as a “call to action” or suggestion that you enter into a swap or trading strategy involving a swap or any other transaction. Scotiabank may engage in transactions in a manner inconsistent with the views discussed this report and may have positions, or be in the process of acquiring or disposing of positions, referred to in this report.
Scotiabank, its affiliates and any of their respective officers, directors and employees may from time to time take positions in currencies, act as managers, co-managers or underwriters of a public offering or act as principals or agents, deal in, own or act as market makers or advisors, brokers or commercial and/or investment bankers in relation to securities or related derivatives. As a result of these actions, Scotiabank may receive remuneration. All Scotiabank products and services are subject to the terms of applicable agreements and local regulations. Officers, directors and employees of Scotiabank and its affiliates may serve as directors of corporations.
Any securities discussed in this report may not be suitable for all investors. Scotiabank recommends that investors independently evaluate any issuer and security discussed in this report, and consult with any advisors they deem necessary prior to making any investment.
This report and all information, opinions and conclusions contained in it are protected by copyright. This information may not be reproduced without the prior express written consent of Scotiabank.
™ Trademark of The Bank of Nova Scotia. Used under license, where applicable.
Scotiabank, together with “Global Banking and Markets”, is a marketing name for the global corporate and investment banking and capital markets businesses of The Bank of Nova Scotia and certain of its affiliates in the countries where they operate, including; Scotiabank Europe plc; Scotiabank (Ireland) Designated Activity Company; Scotiabank Inverlat S.A., Institución de Banca Múltiple, Grupo Financiero Scotiabank Inverlat, Scotia Inverlat Casa de Bolsa, S.A. de C.V., Grupo Financiero Scotiabank Inverlat, Scotia Inverlat Derivados S.A. de C.V. – all members of the Scotiabank group and authorized users of the Scotiabank mark. The Bank of Nova Scotia is incorporated in Canada with limited liability and is authorised and regulated by the Office of the Superintendent of Financial Institutions Canada. The Bank of Nova Scotia is authorized by the UK Prudential Regulation Authority and is subject to regulation by the UK Financial Conduct Authority and limited regulation by the UK Prudential Regulation Authority. Details about the extent of The Bank of Nova Scotia's regulation by the UK Prudential Regulation Authority are available from us on request. Scotiabank Europe plc is authorized by the UK Prudential Regulation Authority and regulated by the UK Financial Conduct Authority and the UK Prudential Regulation Authority.
Scotiabank Inverlat, S.A., Scotia Inverlat Casa de Bolsa, S.A. de C.V, Grupo Financiero Scotiabank Inverlat, and Scotia Inverlat Derivados, S.A. de C.V., are each authorized and regulated by the Mexican financial authorities.
Not all products and services are offered in all jurisdictions. Services described are available in jurisdictions where permitted by law.