- Canada registered another strong month for job growth, with mixed details
- The numbers vindicate the BoC and PM Carney’s budget for now
- Canadian jobs m/m 000s / UR %, SA, October:
- Actual: 66.6 / 6.9
- Scotia: -25 / 7.1
- Consensus: -5 / 7.1
- Prior: 60.4 / 7.1
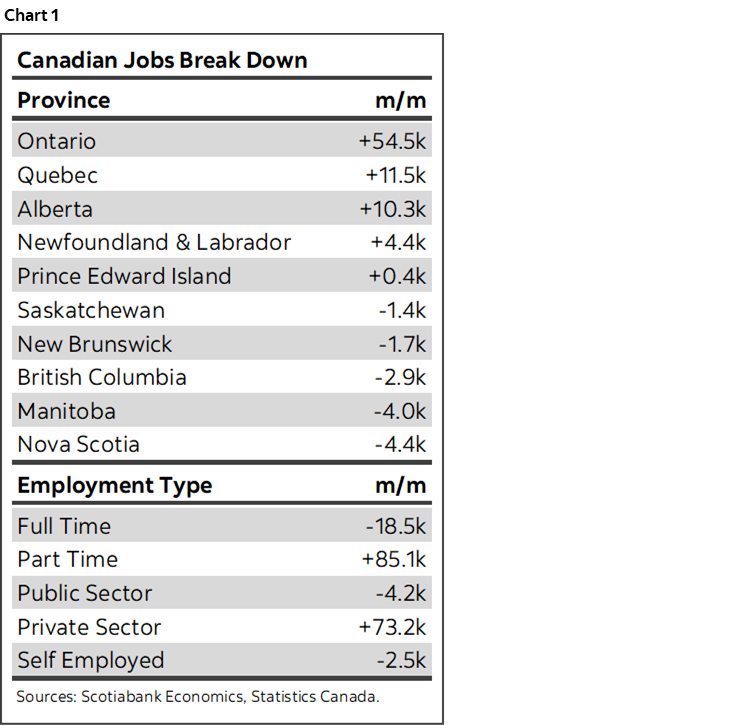
Canada heaped on more jobs of fairly low quality, drove the unemployment rate down, recorded supercharged wage growth and a temporary drop in hours worked. If you believe it. Some summary stats are shown in chart 1.
All of which vindicates—at least for now—the BoC’s clear hold signal and the Carney administration’s resistance against heaping on cyclical stimulus.
NOISE OR REALITY?
In fairness, while it’s a spin of the wheel for a volatile survey, we can’t dismiss two months of strong gains with any greater statistical confidence than we could dismiss the brief summertime soft path as mere statistical noise.
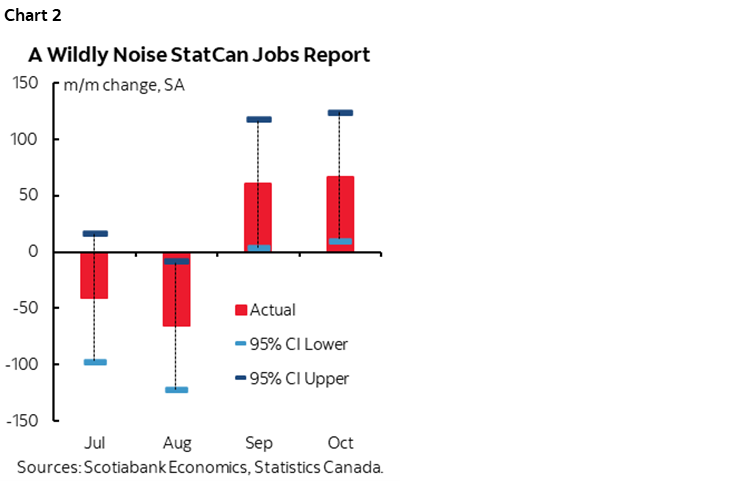
Enter chart 2. The 95% confidence interval around monthly reported changes in Canadian jobs is about +/-57k. In other words, if the Labour Force Survey was repeatedly sampled, then 95 times out of 100 the survey would have turn up a gain anywhere between about 10k and 124k. The prior month would have been anywhere between about 3k and 117k. The month before that would range from –123k and –9k and July would have been between a loss of –98k and a gain of 16k.
Get the point? Carve through the noise in a wildly volatile survey, but do so without cherry-picking which month’s numbers you believe. Don’t be one of those doves who pounced on the July and August declines while dismissing the big gains in September and October. Don’t be one of the hawks who dismisses the July and August reports in favour of the wild gains over the next two months.
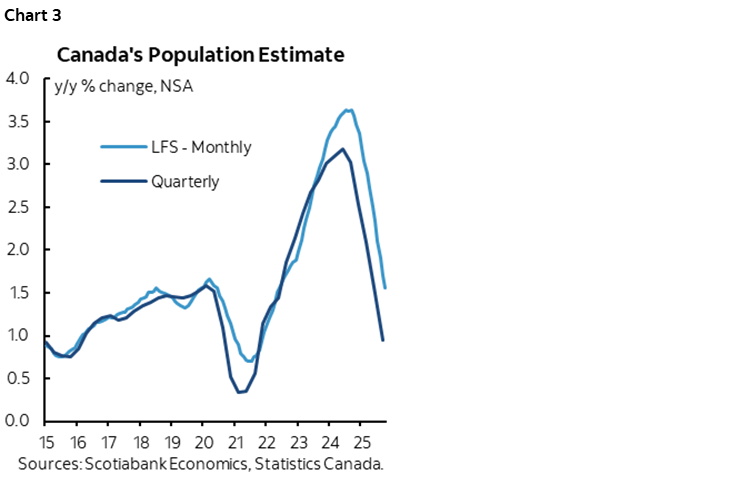
Nevertheless, as a sign of the limited confidence one may have in the report we can look at chart 3. Same agency. Notable differences in recent population growth. The gap between the quarterly total population growth estimates available up to Q3 versus what the LFS says for the monthly adult 15+ population has widened over the past year or so in a way that is fairly rate and more persistent than in the depths of the pandemic. These are fairly large differences in percentage terms applied against the number of people in the country. If they’re having difficulty estimating the population between two different approaches, then perhaps check one’s confidence in the batch of numbers.
DETAILS
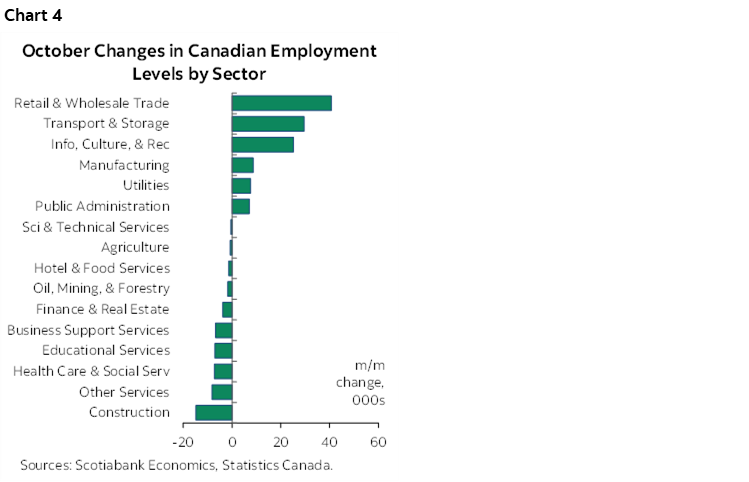
The overall gain in jobs was mostly driven by three sectors: retail/wholesale, transportation and storage, and info/culture/rec (chart 4). These tend not to be relatively high paying jobs and they tend to lean on part-time workers relative to some other sectors.
Enter the fact that part-time jobs drove the overall report with a gain of 85k while full-time jobs fell by 19k. That too is not a great quality signal.
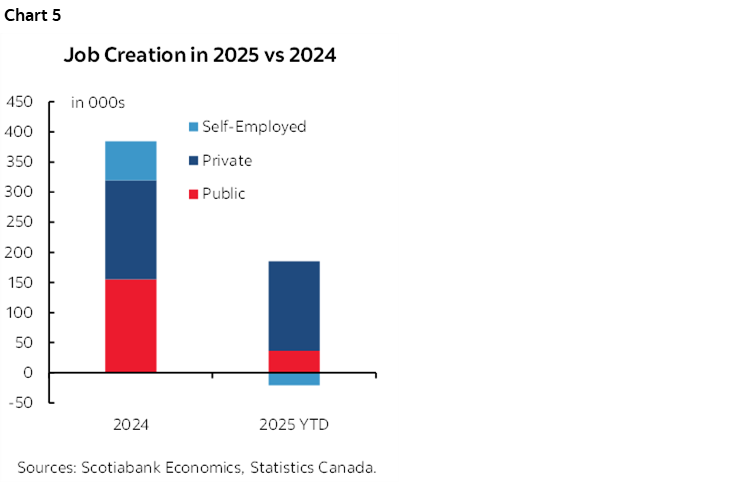
All of the job growth was in private payrolls last month (+73k) as small declines were recorded in public payrolls and the self-employed. For the year as a whole, chart 5 shows that private payrolls are dominating job growth.
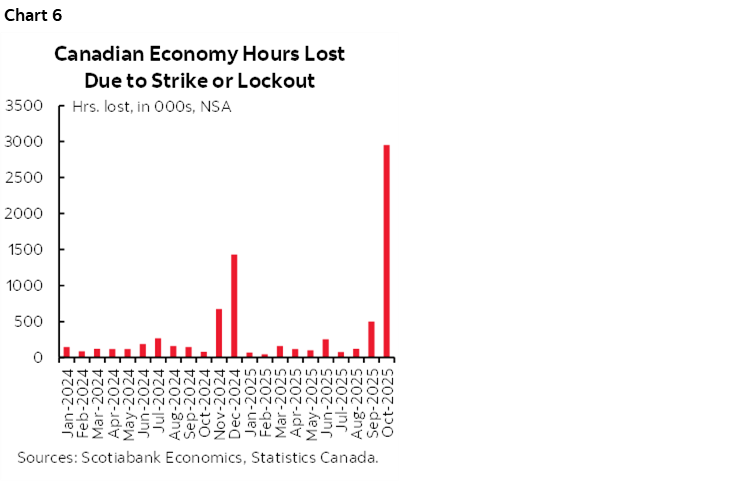
Hours worked fell by –0.2% m/m SA for the second month in a row. More jobs are being created at the margin, but the total hours worked by all employed Canadians are falling. In October’s case, this was driven by the Alberta teachers strike (chart 6) and we’ll see that influence reverse in the next report after they were ordered back to work.
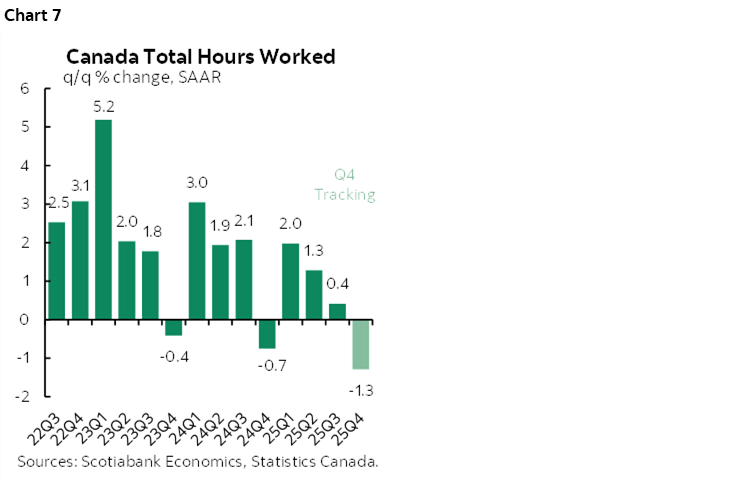
For Q4 overall, hours worked are tracking a drop of –1.3% q/q SAAR in a continuation of a slipping trend (chart 7). This is very tentative a) because it’s based only on October and the Q3 average, and b) because of the strike effect. Still, based on known information so far, this is a negative signal for Q4 GDP defined as hours worked times labour productivity.
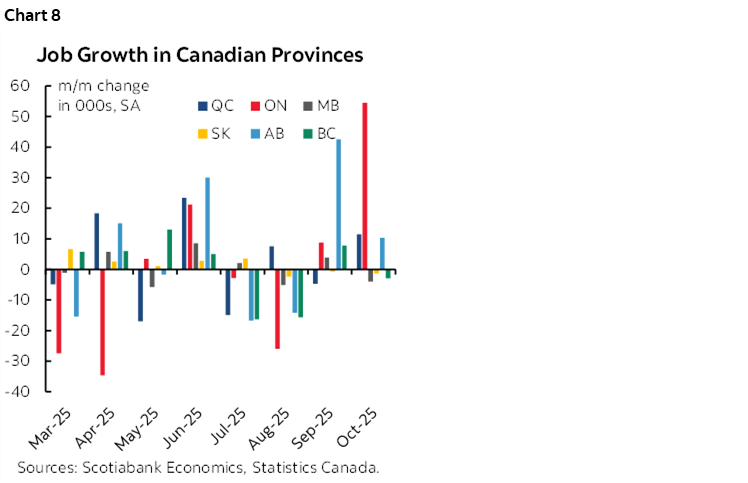
It was Ontario’s turn to drive job gains last month (chart 8) after Alberta drove the prior gain. Alberta still grew a smaller number of jobs last month along with BC, but there isn’t much breadth to the gains otherwise over the past two months.
Wage growth super-accelerated to 9.6% m/m SAAR in October (chart 9). That’s the strongest gain since June 2022. Smoothing through the figures reveals nominal wage growth persistently above the BoC’s 2% inflation target rate while productivity continues to tank. The combination represents cost-push inflation risk.
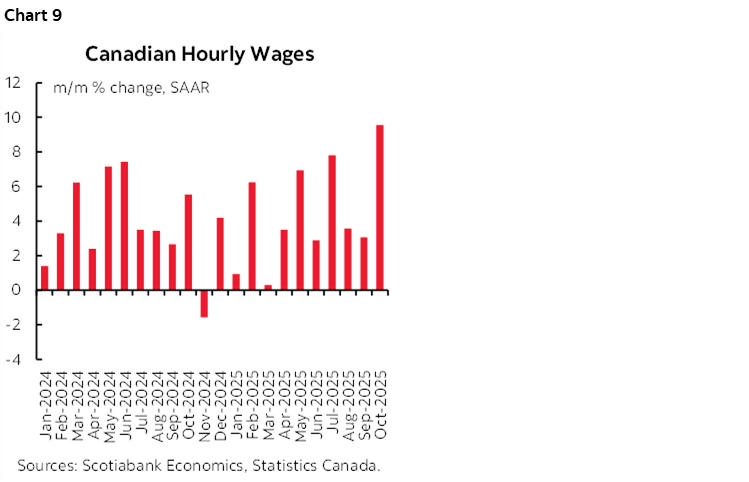
Continue to expect strong trend wage growth as the one-third of Canada’s workforce that is governed by expiring collective bargaining agreements continues to reset wage growth higher to make up for what they negotiated about four years ago on average. Wage settlements data is unfortunately lagging again to July.
DISCLAIMER
This report has been prepared by Scotiabank Economics as a resource for the clients of Scotiabank. Opinions, estimates and projections contained herein are our own as of the date hereof and are subject to change without notice. The information and opinions contained herein have been compiled or arrived at from sources believed reliable but no representation or warranty, express or implied, is made as to their accuracy or completeness. Neither Scotiabank nor any of its officers, directors, partners, employees or affiliates accepts any liability whatsoever for any direct or consequential loss arising from any use of this report or its contents.
These reports are provided to you for informational purposes only. This report is not, and is not constructed as, an offer to sell or solicitation of any offer to buy any financial instrument, nor shall this report be construed as an opinion as to whether you should enter into any swap or trading strategy involving a swap or any other transaction. The information contained in this report is not intended to be, and does not constitute, a recommendation of a swap or trading strategy involving a swap within the meaning of U.S. Commodity Futures Trading Commission Regulation 23.434 and Appendix A thereto. This material is not intended to be individually tailored to your needs or characteristics and should not be viewed as a “call to action” or suggestion that you enter into a swap or trading strategy involving a swap or any other transaction. Scotiabank may engage in transactions in a manner inconsistent with the views discussed this report and may have positions, or be in the process of acquiring or disposing of positions, referred to in this report.
Scotiabank, its affiliates and any of their respective officers, directors and employees may from time to time take positions in currencies, act as managers, co-managers or underwriters of a public offering or act as principals or agents, deal in, own or act as market makers or advisors, brokers or commercial and/or investment bankers in relation to securities or related derivatives. As a result of these actions, Scotiabank may receive remuneration. All Scotiabank products and services are subject to the terms of applicable agreements and local regulations. Officers, directors and employees of Scotiabank and its affiliates may serve as directors of corporations.
Any securities discussed in this report may not be suitable for all investors. Scotiabank recommends that investors independently evaluate any issuer and security discussed in this report, and consult with any advisors they deem necessary prior to making any investment.
This report and all information, opinions and conclusions contained in it are protected by copyright. This information may not be reproduced without the prior express written consent of Scotiabank.
™ Trademark of The Bank of Nova Scotia. Used under license, where applicable.
Scotiabank, together with “Global Banking and Markets”, is a marketing name for the global corporate and investment banking and capital markets businesses of The Bank of Nova Scotia and certain of its affiliates in the countries where they operate, including; Scotiabank Europe plc; Scotiabank (Ireland) Designated Activity Company; Scotiabank Inverlat S.A., Institución de Banca Múltiple, Grupo Financiero Scotiabank Inverlat, Scotia Inverlat Casa de Bolsa, S.A. de C.V., Grupo Financiero Scotiabank Inverlat, Scotia Inverlat Derivados S.A. de C.V. – all members of the Scotiabank group and authorized users of the Scotiabank mark. The Bank of Nova Scotia is incorporated in Canada with limited liability and is authorised and regulated by the Office of the Superintendent of Financial Institutions Canada. The Bank of Nova Scotia is authorized by the UK Prudential Regulation Authority and is subject to regulation by the UK Financial Conduct Authority and limited regulation by the UK Prudential Regulation Authority. Details about the extent of The Bank of Nova Scotia's regulation by the UK Prudential Regulation Authority are available from us on request. Scotiabank Europe plc is authorized by the UK Prudential Regulation Authority and regulated by the UK Financial Conduct Authority and the UK Prudential Regulation Authority.
Scotiabank Inverlat, S.A., Scotia Inverlat Casa de Bolsa, S.A. de C.V, Grupo Financiero Scotiabank Inverlat, and Scotia Inverlat Derivados, S.A. de C.V., are each authorized and regulated by the Mexican financial authorities.
Not all products and services are offered in all jurisdictions. Services described are available in jurisdictions where permitted by law.