- Explosive job growth was backed by strong details
- Explosive wage growth is exceeding inflation and productivity…
- ...and adding to Canada’s competitiveness challenges
- The BoC zigged when it should’ve zagged
- CDN jobs 000s // UR % // wages m/m %, October, SA:
- Actual: 108 / 5.2 / 0.7
- Scotia: 10 / 5.1 / na
- Consensus: 10 / 5.3 / na
- Prior: 21.1 / 5.2 / 0.2
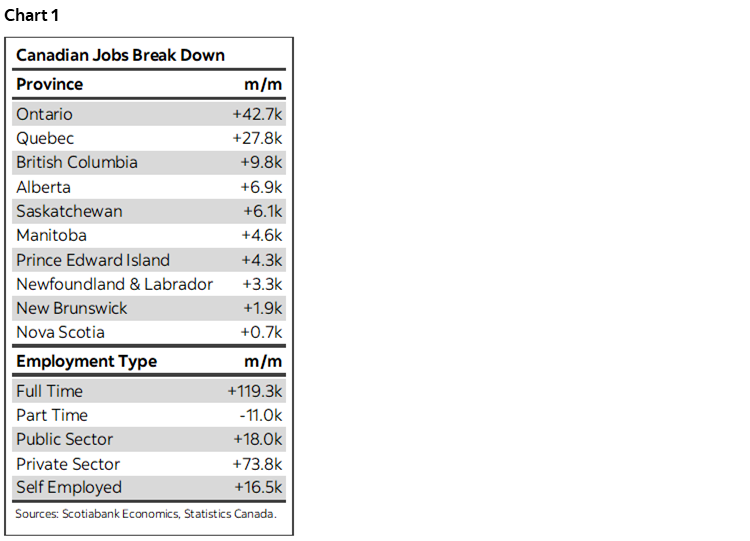
Canada’s latest jobs report was a narrative-buster on multiple counts. Maybe the job market isn’t slowing after all and maybe it’s not as difficult to find workers as businesses seem to be saying. This was a strong report on all counts with some highlights offered in chart 1 and the table above. Trend wage growth in Canada remains explosive and adding to concerns about a potentially developing wage-price spiral and an ongoing competitiveness problem. The overall report also makes the BoC’s recently more dovish than expected twist look a little out of place in relation to a more hawkish Fed and strong jobs figures on both sides of the border with a hot US core CPI report expected next week.
Markets reacted in about the sort of way you might have expected. The Canada 2-year yield initially spiked about 13bps higher post-data and is so far settling in around a 4–5bps gain. The 5-year yield performed similarly and is up by 3–4bps. CAD appreciated to the USD by about a full penny as the US employment figures were solid but not as relatively impressive as Canada’s. OIS contracts are leaning toward pricing a hike of about 35bps on December 7th and hence somewhat on the fence between a 25bps and 50bps hike which isn’t very different than before the data. What markets did, however, was to add a few more basis points to the cumulative rate hikes into late Winter and early Spring by pricing a terminal rate of about 4½% which remains just under 75bps below pricing for the Fed’s terminal rate.
STRONG DETAILS, NOT JUST NOISE
Tempted to dismiss the report as noise? Don’t be. This was a highly statistically significant gain as opposed to just random noise. Statcan estimates that in 95 times out of 100 repeated sampling trials for a labour force household survey we should have a confidence band of +/-57k around the 108k rise. That means we can say at a high level of significance that the gain was somewhere between 50k and 166k. I know that’s still large, but it swamps anyone’s estimate within consensus as everyone was well below the bottom end of that range.
The details were very positive across the board and reinforced the strong headline.
- All of the gain was in full-time jobs that were up by 119k with part-time down 11k.
- Most of the gains were in payrolls(92k) which can tend to be ‘harder’ data than self-employed jobs that were up 17k.
- the private sector added 74k while public sector jobs were also up by 18k.
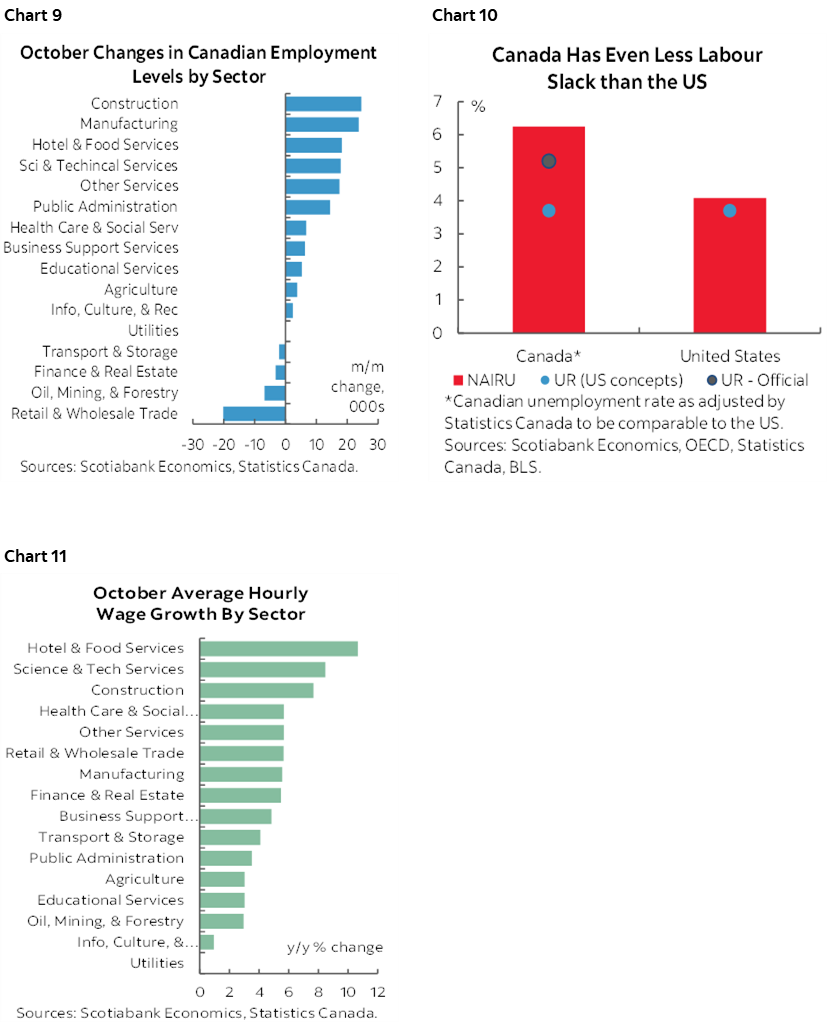
- There was high breadth across sectors. Goods sectors added 45k, services added 63k.
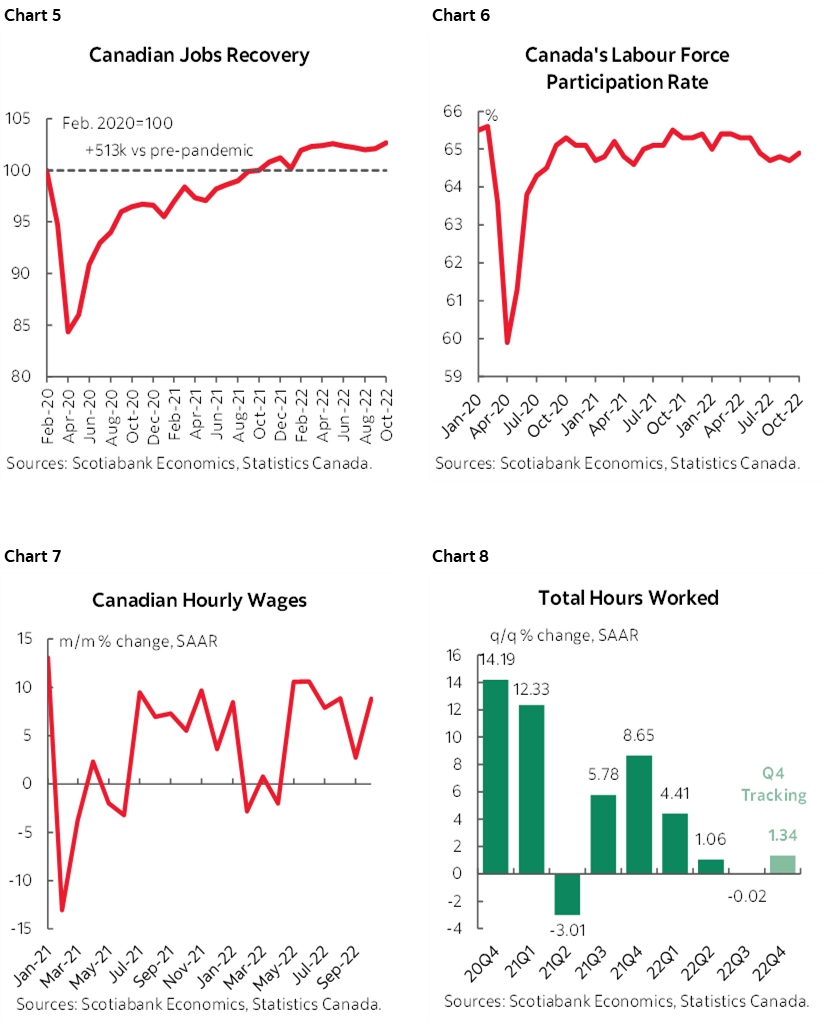
- The labour force increased by 110k which matched the job gain and that’s why the unemployment rate held steady at 5.2%. There were as many new folks entering the job market in search of work as there were folks able to find work last month.
- Hours worked went up by 0.7% m/m SA for the biggest gain since June. Hours worked are very tentatively tracking a gain of 1.3% q/q at a seasonally adjusted and annualized rate into Q4. That is a tentatively encouraging sign after being flat in Q3 and posting a 1.1% gain in Q2. It tentatively suggests that GDP growth may stay in the black in Q4 given GDP equates to hours times labour productivity.
WAGE GROWTH IS BACK TO BEING EXPLOSIVE
The most impactful reading here in my opinion is that the deceleration in wage growth during September seems to have been the aberration along the trend line since gains began to sharply accelerate in May and even much further back than that.
October’s wage gain for permanent employees clocked in at 8.4% m/m at a seasonally adjusted and annualized rate. The month before it had dropped to 2.6% compared to between 8 ½% and 11 ¼% gains from May through August. The three-month moving average is now set at 6.7%. One month up or down doesn’t make a trend, but the trend has enough muscle behind it to be convincing. In fact, you could argue this has been the case dating right back to July 2021 before it was temporarily interrupted by data over February to April this year. Annualized m/m wage growth has been between about 5% and 11% over 12 of the past 16 months. It would be a mistake to ignore this momentum over such a long stretch as just a transitory development.
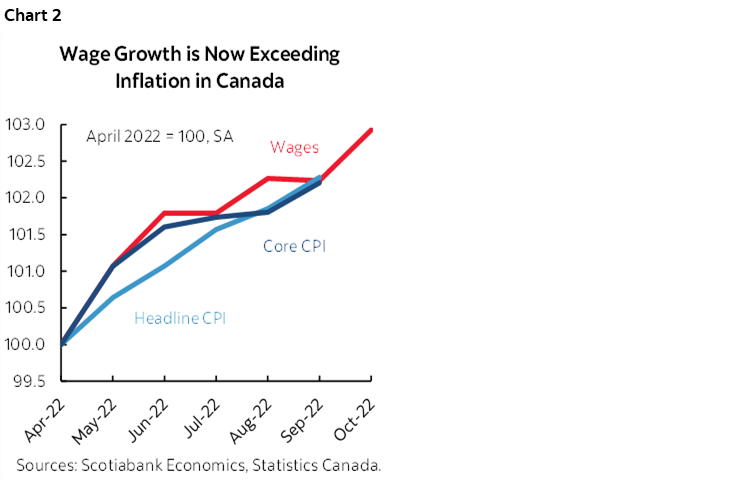
That kind of nominal wage growth is now in excess of inflation. As chart 2 shows, the trend monthly pace of annualized wage gains lies in excess of the annualized monthly pace of CPI inflation and CPI ex-food and energy ‘core’ inflation.
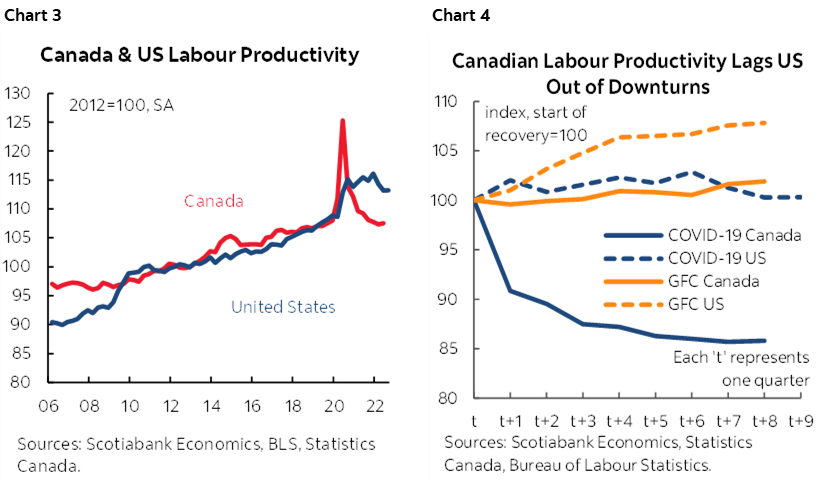
Sounds great, right? That’s the glass half full perspective for workers to be getting pay gains in excess of inflation since who doesn’t like higher pay? The glass half empty perspective says that this comes at a cost because real (ie: inflation-adjusted) wage gains should be primarily driven by productivity gains over time. They are not as Canada’s productivity performance has been miserable throughout the pandemic and much worse than the US. Getting paid more for producing less on average across the Canadian workforce is a rising competitiveness challenge and so expect more tussles between the payers (small and big companies plus governments) and workers. For that matter, more tussles between levels of government that view the pressures differently!
Charts 3–4 highlight arguments around Canada’s competitiveness challenges. The indexed pace of nominal wage gains over the past six months has been exceeding inflation with October’s CPI figures still ahead. Wage gains have been exceeding tumbling labour productivity (output of the volume of goods and services produced per hour worked) in absolute terms and especially relative to the US. These are potentially destabilizing influences from the standpoint of risks facing longer run living standards especially for lower– to middle-income Canadians. The fact that Canada is becoming less and less competitive relative to the US and Mexico while governments continue to spend at very elevated levels is fomenting unfavourable Canadian developments within an integrated NAFTA bloc. Choices it makes going forward will determine how severe these competitive challenges could become.
Please also see the additional charts on the following page.
DISCLAIMER
This report has been prepared by Scotiabank Economics as a resource for the clients of Scotiabank. Opinions, estimates and projections contained herein are our own as of the date hereof and are subject to change without notice. The information and opinions contained herein have been compiled or arrived at from sources believed reliable but no representation or warranty, express or implied, is made as to their accuracy or completeness. Neither Scotiabank nor any of its officers, directors, partners, employees or affiliates accepts any liability whatsoever for any direct or consequential loss arising from any use of this report or its contents.
These reports are provided to you for informational purposes only. This report is not, and is not constructed as, an offer to sell or solicitation of any offer to buy any financial instrument, nor shall this report be construed as an opinion as to whether you should enter into any swap or trading strategy involving a swap or any other transaction. The information contained in this report is not intended to be, and does not constitute, a recommendation of a swap or trading strategy involving a swap within the meaning of U.S. Commodity Futures Trading Commission Regulation 23.434 and Appendix A thereto. This material is not intended to be individually tailored to your needs or characteristics and should not be viewed as a “call to action” or suggestion that you enter into a swap or trading strategy involving a swap or any other transaction. Scotiabank may engage in transactions in a manner inconsistent with the views discussed this report and may have positions, or be in the process of acquiring or disposing of positions, referred to in this report.
Scotiabank, its affiliates and any of their respective officers, directors and employees may from time to time take positions in currencies, act as managers, co-managers or underwriters of a public offering or act as principals or agents, deal in, own or act as market makers or advisors, brokers or commercial and/or investment bankers in relation to securities or related derivatives. As a result of these actions, Scotiabank may receive remuneration. All Scotiabank products and services are subject to the terms of applicable agreements and local regulations. Officers, directors and employees of Scotiabank and its affiliates may serve as directors of corporations.
Any securities discussed in this report may not be suitable for all investors. Scotiabank recommends that investors independently evaluate any issuer and security discussed in this report, and consult with any advisors they deem necessary prior to making any investment.
This report and all information, opinions and conclusions contained in it are protected by copyright. This information may not be reproduced without the prior express written consent of Scotiabank.
™ Trademark of The Bank of Nova Scotia. Used under license, where applicable.
Scotiabank, together with “Global Banking and Markets”, is a marketing name for the global corporate and investment banking and capital markets businesses of The Bank of Nova Scotia and certain of its affiliates in the countries where they operate, including; Scotiabank Europe plc; Scotiabank (Ireland) Designated Activity Company; Scotiabank Inverlat S.A., Institución de Banca Múltiple, Grupo Financiero Scotiabank Inverlat, Scotia Inverlat Casa de Bolsa, S.A. de C.V., Grupo Financiero Scotiabank Inverlat, Scotia Inverlat Derivados S.A. de C.V. – all members of the Scotiabank group and authorized users of the Scotiabank mark. The Bank of Nova Scotia is incorporated in Canada with limited liability and is authorised and regulated by the Office of the Superintendent of Financial Institutions Canada. The Bank of Nova Scotia is authorized by the UK Prudential Regulation Authority and is subject to regulation by the UK Financial Conduct Authority and limited regulation by the UK Prudential Regulation Authority. Details about the extent of The Bank of Nova Scotia's regulation by the UK Prudential Regulation Authority are available from us on request. Scotiabank Europe plc is authorized by the UK Prudential Regulation Authority and regulated by the UK Financial Conduct Authority and the UK Prudential Regulation Authority.
Scotiabank Inverlat, S.A., Scotia Inverlat Casa de Bolsa, S.A. de C.V, Grupo Financiero Scotiabank Inverlat, and Scotia Inverlat Derivados, S.A. de C.V., are each authorized and regulated by the Mexican financial authorities.
Not all products and services are offered in all jurisdictions. Services described are available in jurisdictions where permitted by law.